![]()
![]()
![]()
Growth in wood pulp consumption has been slower than growth in paper & board production over the last decades (Figure 10). Since the late 1980s, consumption of both wood and other fibre pulp have levelled off, while the growth of paper & board production remained strong. Recovered paper has become an important raw material for paper manufacture world-wide, accounting for 33% of the fibre input both in developed and developing countries and totalling 86 million metric tons in 1991. In that year, countries in the Asia-Pacific region consumed more than 31 million, and of that, over 6.2 million were imports (Table 55).
The region's total wood pulp consumption increased from 6.3 million metric tons per year in 1962 to 24.5 in 1992, with the fastest growth during the 1980s (Table 56). Japan has been the leading consumer of wood pulp (14.3 million metric tons in 1992), followed by China (3.4 million), the Republic of Korea (1.8 million), and Indonesia, Australia and India (1.2 million metric tons each). China, the Republic of Korea, Indonesia and India registered the fastest growth during the 1980s.
Table 55. Recovered paper consumption and imports in the Asia-Pacific region, in thousand metric tons, 1991.
|
Country |
Consumption |
Imports |
|
Australia |
757 |
|
|
China |
9019 |
2503 |
|
India |
662 |
229 |
|
Indonesia |
738 |
550 |
|
Japan |
15516 |
850 |
|
Korea, Rep. |
3484 |
1543 |
|
Malaysia |
50 |
|
|
New Zealand |
77 |
|
|
Pakistan |
82 |
|
|
Philippines Sri Lanka |
286 20 |
240 |
|
Thailand |
542 |
293 |
|
Viet Nam |
15 |
|
|
Asia-Pacific |
31248 |
6208 |
Table 56. Consumption of wood pulp, in thousand metric tons, 1962-1992.
|
Country |
1962 |
1972 |
1982 |
1992 |
|
Australia |
507 |
761 |
996 |
1205 |
|
Bangladesh |
30 |
47 |
61 |
108 |
|
Bhutan |
|
|
|
|
|
Cambodia |
0 |
0 |
0 |
0 |
|
China |
855 |
1009 |
1746 |
3377 |
|
Fiji |
|
|
|
|
|
French Polynesia |
|
|
|
|
|
Hong Kong |
0 |
0 |
1 |
7 |
|
India |
141 |
266 |
620 |
1204 |
|
Indonesia |
1 |
1 |
212 |
1234 |
|
Japan |
4387 |
10187 |
10292 |
14273 |
|
Korea Dem People's Rep |
0 |
10 |
56 |
56 |
|
Korea Rep |
74 |
390 |
670 |
1770 |
|
Laos |
|
|
|
|
|
Macau |
|
|
|
|
|
Malaysia |
0 |
2 |
4 |
35 |
|
Myanmar |
|
|
|
|
|
Nepal |
|
|
|
|
|
New Caledonia |
|
|
|
|
|
New Zealand |
252 |
499 |
733 |
720 |
|
Pakistan |
26 |
9 |
12 |
31 |
|
Papua New Guinea |
|
|
|
|
|
Philippines |
39 |
87 |
162 |
191 |
|
Samoa |
|
|
|
|
|
Singapore |
0 |
1 |
3 |
11 |
|
Solomon Islands |
|
|
|
|
|
Sri Lanka |
2 |
6 |
4 |
5 |
|
Thailand |
2 |
66 |
90 |
190 |
|
Tonga |
|
|
|
|
|
Vanuatu |
|
|
|
|
|
Viet Nam |
6 |
8 |
25 |
53 |
|
Asia Pacific |
6322 |
13349 |
15687 |
24470 |
|
World |
63599 |
107354 |
119798 |
145305 |
|
Share |
10% |
12% |
13% |
17% |
The production of wood pulp in the Asia Pacific expanded sharply in response to the rise in consumption during the last decade (Table 57). While the production was virtually static during the 1970s, it increased more than 40% between 1982 and 1992, from 12 to 18 million metric tons. However, given the similar growth in production elsewhere in the world, the region's world share has not changed much since 1970. The largest producers in 1992 were Japan (11.2 million metric tons), China (2.2 million), New Zealand, India and Australia with about 1 million metric tons each.
Table 57. Production of wood pulp, in thousand metric tons, 1962-1992.
|
Country |
1962 |
1972 |
1982 |
1992 |
|
Australia |
380 |
527 |
753 |
980 |
|
Bangladesh |
30 |
23 |
53 |
96 |
|
Bhutan |
|
|
|
|
|
Cambodia |
|
|
|
|
|
China |
766 |
800 |
1330 |
2193 |
|
Fiji |
|
|
|
|
|
French Polynesia |
|
|
|
|
|
Hong Kong |
|
|
|
|
|
India |
20 |
215 |
553 |
1049 |
|
Indonesia |
0 |
1 |
55 |
751 |
|
Japan |
4167 |
9431 |
8617 |
11194 |
|
Korea Dem People's Rep |
0 |
10 |
56 |
56 |
|
Korea Rep |
19 |
84 |
235 |
322 |
|
Laos |
|
|
|
|
|
Macau |
|
|
|
|
|
Malaysia |
|
|
|
|
|
Myanmar |
|
|
|
|
|
Nepal |
|
|
|
|
|
New Caledonia |
|
|
|
|
|
New Zealand |
308 |
600 |
1134 |
1288 |
|
Pakistan |
4 |
0 |
0 |
0 |
|
Papua New Guinea |
|
|
|
|
|
Philippines |
10 |
53 |
126 |
151 |
|
Samoa |
|
|
|
|
|
Singapore |
|
|
|
|
|
Solomon Islands |
|
|
|
|
|
Sri Lanka |
0 |
0 |
0 |
4 |
|
Thailand |
|
|
|
|
|
Tonga |
|
|
|
|
|
Vanuatu |
|
|
|
|
|
Viet Nam |
0 |
8 |
25 |
53 |
|
Asia Pacific |
5704 |
11752 |
12937 |
18137 |
|
World |
63679 |
107449 |
119576 |
153739 |
|
Share |
9% |
11% |
11% |
12% |
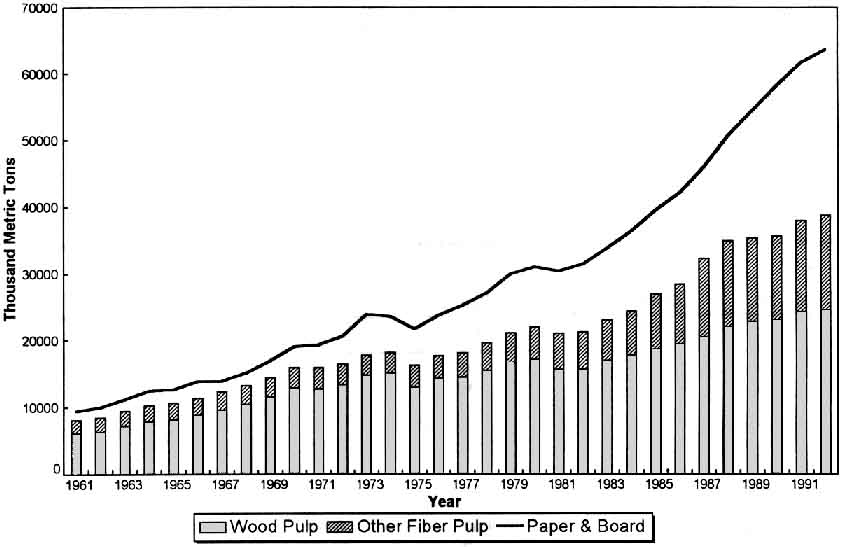
Figure 11 shows the regional production from 1961 to 1992, along with production of other fibre pulp and production of paper & board. Growth of production had been slower than that of consumption (Figure 10), due mainly to the lack of cheap sources of fibre. In 1992, wood pulp production accounted for about 63% of total pulp production in the region, and less than one-third of the total fibre input.
Total imports have increased steadily over the last decades, from 696 thousand metric tons in 1962 to 7.2 million in 1992 (Table 58). Together with recovered paper imports accounted for an important share of fibre input, as shown in Figures 10 and 11. By 1992, imports from other regions represented more than 22% of the consumption. The main suppliers in 1992 were the United States with 2.6 million metric tons, Canada with 2.2 million, Chile with 367 thousand metric tons, and the European Union with 342 thousand (Table 59).
The largest importers in 1992 were Japan (3.1 million metric tons), the Republic of Korea (1.5 million), and China (1.3 million). Imports in those three countries accounted for, respectively, 22%, 82% and 37% of their domestic consumption. Imports have also grown quickly and taken large shares of consumption in Indonesia and Thailand in recent years.
There have been very little exports from countries in the region, a total of only 811 thousand metric tons or 3% of the world's (Table 60). Historically, New Zealand has been the largest exporter in the region: 592 thousand metric tons in 1992, 73% of the region's total. Almost all of New Zealand's exports went to countries within the region.
Japan has been a net importer of pulp for decades. In terms of wood pulp consumed, its self-sufficiency rate declined from 95% in 1962 to 78% in 1992. Underlying this decline is the well-known shortage of domestic pulpwood and an impending decline in by-product chips.
Table 58. Imports of wood pulp, in thousand metric tons, 1962-1992.
|
Country |
1962 |
1972 |
1982 |
1992 |
|
Australia |
127 |
234 |
247 |
226 |
|
Bangladesh |
0 |
24 |
8 |
12 |
|
Bhutan |
|
|
|
|
|
Cambodia |
0 |
0 |
0 |
0 |
|
China |
89 |
263 |
484 |
1258 |
|
Fiji |
|
|
|
|
|
French Polynesia |
|
|
|
|
|
Hong Kong |
0 |
0 |
1 |
15 |
|
India |
121 |
51 |
67 |
155 |
|
Indonesia |
1 |
0 |
157 |
576 |
|
Japan |
227 |
803 |
1743 |
3084 |
|
Korea Dem People's Rep |
|
|
|
|
|
Korea Rep |
55 |
306 |
435 |
1448 |
|
Laos |
|
|
|
|
|
Macau |
|
|
|
|
|
Malaysia |
0 |
2 |
4 |
35 |
|
Myanmar |
|
|
|
|
|
Nepal |
|
|
|
|
|
New Caledonia |
|
|
|
|
|
New Zealand |
15 |
13 |
16 |
24 |
|
Pakistan |
22 |
9 |
12 |
31 |
|
Papua New Guinea |
|
|
|
|
|
Philippines |
29 |
34 |
38 |
40 |
|
Samoa |
|
|
|
|
|
Singapore |
0 |
2 |
3 |
24 |
|
Solomon Islands |
|
|
|
|
|
Sri Lanka |
2 |
6 |
4 |
1 |
|
Thailand |
2 |
66 |
90 |
215 |
|
Tonga |
|
|
|
|
|
Vanuatu |
|
|
|
|
|
Viet Nam |
6 |
0 |
0 |
0 |
|
Asia Pacific |
696 |
1813 |
3309 |
7144 |
|
World |
10116 |
16361 |
18212 |
26886 |
|
Share |
7% |
11% |
18% |
27% |
Table 59. Direction of trade in wood pulp, in thousand metric tons, 1992.
Table 60. Exports of wood pulp, in thousand metric tons, 1962-1992.
|
Country |
1962 |
1972 |
1982 |
1992 |
|
Australia |
0 |
0 |
4 |
1 |
|
Bangladesh |
|
|
|
|
|
Bhutan |
|
|
|
|
|
Cambodia |
|
|
|
|
|
China |
0 |
54 |
68 |
74 |
|
Fiji |
|
|
|
|
|
French Polynesia |
|
|
|
|
|
Hong Kong |
0 |
0 |
0 |
8 |
|
India |
|
|
|
|
|
Indonesia |
0 |
0 |
0 |
93 |
|
Japan |
7 |
47 |
68 |
5 |
|
Korea Dem People's Rep |
|
|
|
|
|
Korea Rep |
|
|
|
|
|
Laos |
|
|
|
|
|
Macau |
|
|
|
|
|
Malaysia |
|
|
|
|
|
Myanmar |
|
|
|
|
|
Nepal |
|
|
|
|
|
New Caledonia |
|
|
|
|
|
New Zealand |
71 |
114 |
417 |
592 |
|
Pakistan |
|
|
|
|
|
Papua New Guinea |
|
|
|
|
|
Philippines |
0 |
0 |
2 |
0 |
|
Samoa |
|
|
|
|
|
Singapore |
0 |
1 |
0 |
13 |
|
Solomon Islands |
|
|
|
|
|
Sri Lanka |
|
|
|
|
|
Thailand |
0 |
0 |
0 |
25 |
|
Tonga |
|
|
|
|
|
Vanuatu |
|
|
|
|
|
Viet Nam |
|
|
|
|
|
Asia Pacific |
78 |
216 |
559 |
811 |
|
World |
10196 |
16456 |
17990 |
27622 |
|
Share |
1% |
1% |
3% |
3% |
![]()
![]()
![]()