![]()
![]()
![]()
The oceans cover 71% of the Earth’s surface and have an average depth of 3,800 m (Angel, 1993). The oceanic environment is defined as the marine water portion that extends over the continental slope and the abyssal plain. The portion of waters over the shelf, which conventionally extends out to a depth of 200 meters, is usually referred to as the neritic environment (see Figure 1).
(from Carpenter and Niem, 1999)
Out of a total ocean surface of about 360 million km2, the neritic environment over the continental shelves covers almost 32 million km2 and hence the oceanic region accounts for over 91% of the world oceans. Table 1 (modified from Caddy et al., 1998) shows the surfaces and percentages of the oceanic portions of each FAO major fishing area defined for statistical purposes (Figure 2). The figures provided are prior to the 2001 modification (implemented in the map below) of the border between areas 51 and 57 (previously Sri Lanka was included in area 51, now it is in area 57).
Although mean productivity per unit area is much lower in the oceans than on land, their very large surface means that the oceans still account for at least a third of the annual global fixation of carbon. For this reason, oceanic communities contribute significantly to global processes (Angel, 1993).
Table 1. Continental shelf and oceanic portions of the FAO fishing areas (after Caddy et al., 1998)
|
FAO fishing area |
Continental
shelf |
Oceanic area |
Total surface |
Oceanic area |
|
18 |
4,482,818 |
4,738,373 |
9,221,191 |
51.4 |
|
21 |
1,294,988 |
4,969,856 |
6,264,844 |
79.3 |
|
27 |
2,745,303 |
11,594,192 |
14,339,495 |
80.9 |
|
31 |
1,533,538 |
13,111,016 |
14,644,554 |
89.5 |
|
34 |
654,364 |
13,463,294 |
14,117,658 |
95.4 |
|
37 |
683,540 |
2,304,357 |
2,987,897 |
77.1 |
|
41 |
1,961,493 |
15,582,750 |
17,544,243 |
88.8 |
|
47 |
422,667 |
17,939,641 |
18,362,308 |
97.7 |
|
48 |
207,613 |
11,609,290 |
11,816,903 |
98.2 |
|
51 |
1,896,583 |
28,285,447 |
30,182,030 |
93.7 |
|
57 |
2,374,430 |
27,506,544 |
29,880,974 |
92.1 |
|
58 |
175,311 |
12,446,060 |
12,621,371 |
98.6 |
|
61 |
3,632,571 |
15,099,749 |
18,732,320 |
80.6 |
|
67 |
1,336,799 |
6,257,136 |
7,593,935 |
82.4 |
|
71 |
6,611,254 |
27,284,538 |
33,895,792 |
80.5 |
|
77 |
806,464 |
47,439,912 |
48,246,376 |
98.3 |
|
81 |
409,520 |
27,248,565 |
27,658,085 |
98.5 |
|
87 |
569,318 |
30,228,835 |
30,798,153 |
98.2 |
|
88 |
137,308 |
9,390,124 |
9,527,432 |
98.6 |
|
TOTAL |
31,935,882 |
326,499,679 |
358,435,561 |
91.1 |
Figure 2. FAO major fishing areas for statistical purposes
Oceanic phytoplankton is responsible for the primary production of the oceans and constitutes the basis of the food chain in the high seas. Primary production is restricted to the so-called euphotic layer, or upper part of the photic zone, where sufficient sunlight penetrates to allow photosynthesis. The depth of the euphotic zone depends on the amount of suspension and detritus present in the water and can vary from 40-50 m in turbid waters to over 100 m where the waters are particularly clear. Production is also limited by the availability of inorganic nutrients.
Below the photic layer there is the aphotic zone, where no light arrives and primary production is absent. Organisms living in this zone which are not performing vertical migration to upper waters are exclusively carnivores, suspension or detritus feeders.
Great quantities of nutrients are continually lost to the aphotic zone and are not available for photosynthesis, however large-scale ocean circulation linked to Earth’s rotation, climatic cycles (seasons) and topography of the ocean basins allow periodical or semi-permanent (in some areas) mixing of superficial and nutrient rich deep waters. This phenomenon called upwelling is the cause of extremely high productivity of some fishing areas.
Oceanic resources include species that are distributed beyond the continental shelf, although they may spend part of their life cycles in the coastal areas. According to the terminology adopted in this report, oceanic resources are marine animals living in the epipelagic, mesopelagic and bathypelagic zones in the oceanic region (Figure 1). Exploitable species living in these zones are fishes, crustaceans, cephalopods and marine mammals. Fishes have the greatest importance, both in number of species and in terms of fishery revenues. According to Helfman et al. (1997), out of approximately 25,000 species of fishes about 325 are epipelagic, representing 1.3% of the total. Mesopelagic and bathypelagic fishes comprise about 1,250 species, corresponding to 5% of the total.
For the purpose of this study, species living in the oceanic region have been classified as either epipelagic or deep-water species (inhabiting the meso- and bathypelagic zones). This classification is somewhat artificial and in several cases it has been difficult to assign species to one of the two categories since several species effect vertical migrations in relation to feeding, reproductive season and circadian rhythms. In such cases, species have been classified on the basis of the zone in which they are usually caught by commercial fisheries.
The reason for categorizing epipelagic and deep-water species among the oceanic resources is that the fisheries targeting the two groups of species are often different in terms of importance, technology, history and value. The valuable and still developing fisheries for tuna and tuna-like species constitute the bulk of the fisheries targeting epipelagic species, although other epipelagic resources such as cephalopods (short-lived and with a rapid turn-over; Caddy and Rodhouse, 1998) might sustain expanding oceanic fisheries, being able to respond promptly to favourable environmental changes (Gonzales et al., 1997).
On the other hand, most oceanic deep-water resources are very dispersed and difficult to harvest and several fisheries on these resources have been discontinued because they were not economically viable. Catches of some deep-water species (in particular blue whiting, Micromesistius poutassou, which constitutes almost half of the deep-water catches in the last twenty years) are mostly destined for reduction into fishmeal because of the rapid deterioration of their flesh, the presence of parasites, and the low market value for the fresh or processed product (Torry Research Station, 1980). In addition, the lack of sound biological information is often a major source of uncertainty on the long-term sustainability of such fisheries (Clark, 1998). Deep-water species are in general characterized by slow growth rates and late age at first maturity (e.g. 25 years for orange roughy, Hoplostethus atlanticus; Smith et al., 1995), which led to weak biological compensation of fishing mortality (Clark, 1998).
Oceanic resources are usually exploited by long-range fleets operating in areas where target species concentrate for feeding or reproduction. The more rapid increase of world fishery fleet sizes as compared to catches and the contemporaneous depletions of some coastal resources have contributed to the increase of fishing effort in oceanic areas (FAO, 1994).
Given the complex interrelations between economic and political factors and the scarce knowledge of oceanic stocks, the issue of oceanic resources management is increasingly coming to international attention in the light of a growing world human population and limited food fish supplies. Furthermore, considering that oceanic species live in a virtually boundless environment and exhibit extensive migratory behaviour amongst high seas and national jurisdictions, their management has necessitates international cooperation. For these reasons, issues concerning highly valuable oceanic stocks such as tuna species are of paramount importance and complexity (FAO, 1994).
The FAO database for capture fishery statistics released in 2001 (FAO, 2001a) covers a period of 50 years, from 1950 to 1999. For the 1950-1969 period, aquaculture production has not yet been separated from capture fisheries production. However, this does not affect oceanic species, since data for the only two oceanic species that have aquaculture production (i.e. northern and southern bluefin tunas) start later in the time series.
The 2001 release of the FAO database included capture statistics for 1,205 species items. “Species items” is the term used to identify the statistical taxonomic unit, which can correspond to species, genus, family or to higher taxonomic levels.
The first step to identify oceanic species among those included in the FAO database consisted in the consultation of two lists already existing: Annex 1 of the 1982 Convention on the Law of the Sea which lists highly migratory species (FAO, 1994) and the oceanic and deep-water resources listed in Table 3 of Caddy et al. (1998). These two lists have been expanded by the addition of other species items recently included in the FAO database and, after the consultation of current literature, amended in a few cases.
Out of 1,205 species items, 120 have been recognized as oceanic because they spend most of their adult life or are caught in the epipelagic, mesopelagic or bathypelagic zones (Figure 1). These species items were further divided into epipelagic (58 species items) and deep-water species (62 items). See Table 2 for the full list of the oceanic species items selected.
The epipelagic group consists of 49 fish, 2 crustacean (krill) and 7 cephalopod (family Ommastrephidae) species items. The two main groups of epipelagic fishes are tuna and tuna-like species (24 species items), which belong to group 36 (Tunas, bonitos, billfishes) of the ‘International Standard Statistical Classification for Aquatic Animals and Plants’ (ISSCAAP) classification used in compiling the FAO fishery statistics, and oceanic sharks (17 species items). The deep-water group consists of 55 fish and 7 crustacean (shrimps and crabs) species items. Several families and orders are represented among the fish species but the most significant group, both in terms of number (15 species items) and economic importance, is that of the Gadiformes.
Marine mammals have not been considered in this study because fishery statistics for blue-, fin-, sperm- and pilot-whales included in the FAO database are given in number of specimens and this does not allow for aggregations with the other data which are all expressed in metric tonnes.
A data sub-set containing capture statistics of the selected oceanic species has been created from the FAO database. Catches reported by flag States for vessels fishing in areas other than those adjacent to the flag State have been classified as Distant Water Fleet (DWF) catches. Vessels fishing in the same FAO fishing area in which their flag State has access to the sea are instead referred to as “bordering countries” throughout the document.
Table 2. List of species items selected as oceanic (epipelagic or deep water)
|
Epipelagic |
|||
|
Scientific name |
FAO English name |
Family |
ISSCAAP group |
|
Auxis rochei |
Bullet tuna |
Scombridae |
Tunas, bonitos, billfishes |
|
Auxis thazard |
Frigate tuna |
Scombridae |
Tunas, bonitos, billfishes |
|
Auxis thazard, A. rochei |
Frigate and bullet tunas |
Scombridae |
Tunas, bonitos, billfishes |
|
Euthynnus affinis |
Kawakawa |
Scombridae |
Tunas, bonitos, billfishes |
|
Euthynnus alletteratus |
Little tunny (= Atl. black skipj) |
Scombridae |
Tunas, bonitos, billfishes |
|
Istiophoridae |
Marlins, sailfishes, etc. nei |
Istiophoridae |
Tunas, bonitos, billfishes |
|
Istiophorus albicans |
Atlantic sailfish |
Istiophoridae |
Tunas, bonitos, billfishes |
|
Istiophorus platypterus |
Indo-Pacific sailfish |
Istiophoridae |
Tunas, bonitos, billfishes |
|
Katsuwonus pelamis |
Skipjack tuna |
Scombridae |
Tunas, bonitos, billfishes |
|
Makaira indica |
Black marlin |
Istiophoridae |
Tunas, bonitos, billfishes |
|
Makaira mazara |
Indo-Pacific blue marlin |
Istiophoridae |
Tunas, bonitos, billfishes |
|
Makaira nigricans |
Atlantic blue marlin |
Istiophoridae |
Tunas, bonitos, billfishes |
|
Tetrapturus albidus |
Atlantic white marlin |
Istiophoridae |
Tunas, bonitos, billfishes |
|
Tetrapturus angustirostris |
Shortbill spearfish |
Istiophoridae |
Tunas, bonitos, billfishes |
|
Tetrapturus audax |
Striped marlin |
Istiophoridae |
Tunas, bonitos, billfishes |
|
Tetrapturus pfluegeri |
Longbill spearfish |
Istiophoridae |
Tunas, bonitos, billfishes |
|
Thunnini |
Tunas nei |
Scombridae |
Tunas, bonitos, billfishes |
|
Thunnus alalunga |
Albacore |
Scombridae |
Tunas, bonitos, billfishes |
|
Thunnus albacares |
Yellowfin tuna |
Scombridae |
Tunas, bonitos, billfishes |
|
Thunnus atlanticus |
Blackfin tuna |
Scombridae |
Tunas, bonitos, billfishes |
|
Thunnus maccoyii |
Southern bluefin tuna |
Scombridae |
Tunas, bonitos, billfishes |
|
Thunnus obesus |
Bigeye tuna |
Scombridae |
Tunas, bonitos, billfishes |
|
Thunnus thynnus |
Atlantic bluefin tuna |
Scombridae |
Tunas, bonitos, billfishes |
|
Xiphias gladius |
Swordfish |
Xiphiidae |
Tunas, bonitos, billfishes |
|
Brama brama |
Atlantic pomfret |
Bramidae |
Miscellaneous pelagic fishes |
|
Cololabis saira |
Pacific saury |
Scomberesocidae |
Miscellaneous pelagic fishes |
|
Coryphaena hippurus |
Common dolphinfish |
Coryphaenidae |
Miscellaneous pelagic fishes |
|
Cypselurus agoo |
Japanese flyingfish |
Exocoetidae |
Miscellaneous pelagic fishes |
|
Lampris guttatus |
Opah |
Lampridae |
Miscellaneous pelagic fishes |
|
Regalecus glesne |
King of herrings |
Regalecidae |
Miscellaneous pelagic fishes |
|
Scomberesox saurus |
Atlantic saury |
Scomberesocidae |
Miscellaneous pelagic fishes |
|
Trachipterus spp |
Dealfishes |
Trachipteridae |
Miscellaneous pelagic fishes |
|
Alopias superciliosus |
Bigeye thresher |
Alopiidae |
Sharks, rays, chimaeras |
|
Alopias vulpinus |
Thresher |
Alopiidae |
Sharks, rays, chimaeras |
|
Carcharhinidae |
Requiem sharks nei |
Carcharhinidae |
Sharks, rays, chimaeras |
|
Carcharhinus brachyurus |
Copper shark |
Carcharhinidae |
Sharks, rays, chimaeras |
|
Carcharhinus falciformis |
Silky shark |
Carcharhinidae |
Sharks, rays, chimaeras |
|
Carcharhinus limbatus |
Blacktip shark |
Carcharhinidae |
Sharks, rays, chimaeras |
|
Carcharhinus obscurus |
Dusky shark |
Carcharhinidae |
Sharks, rays, chimaeras |
|
Carcharhinus plumbeus |
Sandbar shark |
Carcharhinidae |
Sharks, rays, chimaeras |
|
Cetorhinus maximus |
Basking shark |
Cetorhinidae |
Sharks, rays, chimaeras |
|
Isurus oxyrinchus |
Shortfin mako |
Lamnidae |
Sharks, rays, chimaeras |
|
Isurus paucus |
Longfin mako |
Lamnidae |
Sharks, rays, chimaeras |
|
Isurus spp |
Mako sharks |
Lamnidae |
Sharks, rays, chimaeras |
|
Lamna nasus |
Porbeagle |
Lamnidae |
Sharks, rays, chimaeras |
|
Prionace glauca |
Blue shark |
Carcharhinidae |
Sharks, rays, chimaeras |
|
Sphyrna lewini |
Scalloped hammerhead |
Sphyrnidae |
Sharks, rays, chimaeras |
|
Sphyrna zygaena |
Smooth hammerhead |
Sphyrnidae |
Sharks, rays, chimaeras |
|
Sphyrnidae |
Hammerhead sharks, etc. nei |
Sphyrnidae |
Sharks, rays, chimaeras |
|
Euphausia superba |
Antarctic krill |
Euphausiidae |
Krill, planktonic crustaceans |
|
Meganyctiphanes norvegica |
Norwegian krill |
Euphausiidae |
Krill, planktonic crustaceans |
|
Dosidicus gigas |
Jumbo flying squid |
Ommastrephidae |
Squids, cuttlefishes, octopuses |
|
Illex illecebrosus |
Northern shortfin squid |
Ommastrephidae |
Squids, cuttlefishes, octopuses |
|
Martialia hyadesi |
Sevenstar flying squid |
Ommastrephidae |
Squids, cuttlefishes, octopuses |
|
Nototodarus sloani |
Wellington flying squid |
Ommastrephidae |
Squids, cuttlefishes, octopuses |
|
Ommastrephes bartrami |
Neon flying squid |
Ommastrephidae |
Squids, cuttlefishes, octopuses |
|
Todarodes pacificus |
Japanese flying squid |
Ommastrephidae |
Squids, cuttlefishes, octopuses |
|
Todarodes sagittatus |
European flying squid |
Ommastrephidae |
Squids, cuttlefishes, octopuses |
|
Antimora rostrata |
Blue antimora |
Moridae |
Cods, hakes, haddocks |
|
Brosme brosme |
Tusk (= Cusk) |
Gadidae |
Cods, hakes, haddocks |
|
Coryphaenoides rupestris |
Roundnose grenadier |
Macrouridae |
Cods, hakes, haddocks |
|
Lepidorhynchus denticulatus |
Thorntooth grenadier |
Macrouridae |
Cods, hakes, haddocks |
|
Macrouridae |
Grenadiers, rattails nei |
Macrouridae |
Cods, hakes, haddocks |
|
Macrourus berglax |
Roughhead grenadier |
Macrouridae |
Cods, hakes, haddocks |
|
Macrourus spp |
Grenadiers nei |
Macrouridae |
Cods, hakes, haddocks |
|
Macruronus magellanicus |
Patagonian grenadier |
Merlucciidae |
Cods, hakes, haddocks |
|
Macruronus novaezelandiae |
Blue grenadier |
Merlucciidae |
Cods, hakes, haddocks |
|
Macruronus spp |
Blue grenadiers nei |
Merlucciidae |
Cods, hakes, haddocks |
|
Micromesistius australis |
Southern blue whiting |
Gadidae |
Cods, hakes, haddocks |
|
Micromesistius poutassou |
Blue whiting (= Poutassou) |
Gadidae |
Cods, hakes, haddocks |
|
Molva dypterygia |
Blue ling |
Gadidae |
Cods, hakes, haddocks |
|
Molva molva |
Ling |
Gadidae |
Cods, hakes, haddocks |
|
Mora moro |
Common mora |
Moridae |
Cods, hakes, haddocks |
|
Alepocephalus bairdii |
Baird's slickhead |
Alepocephalidae |
Miscellaneous demersal fishes |
|
Anoplopoma fimbria |
Sablefish |
Anoplopomatidae |
Miscellaneous demersal fishes |
|
Aphanopus carbo |
Black scabbardfish |
Trichiuridae |
Miscellaneous demersal fishes |
|
Argentina spp |
Argentines |
Argentinidae |
Miscellaneous demersal fishes |
|
Beryx spp |
Alfonsinos nei |
Berycidae |
Miscellaneous demersal fishes |
|
Centroberyx affinis |
Redfish |
Berycidae |
Miscellaneous demersal fishes |
|
Chlorophthalmidae |
Greeneyes |
Chlorophthalmidae |
Miscellaneous demersal fishes |
|
Dissostichus eleginoides |
Patagonian toothfish |
Nototheniidae |
Miscellaneous demersal fishes |
|
Dissostichus mawsoni |
Antarctic toothfish |
Nototheniidae |
Miscellaneous demersal fishes |
|
Emmelichthyidae |
Bonnetmouths, rubyfishes nei |
Emmelichthyidae |
Miscellaneous demersal fishes |
|
Emmelichthys nitidus |
Cape bonnetmouth |
Emmelichthyidae |
Miscellaneous demersal fishes |
|
Glossanodon semifasciatus |
Deepsea smelt |
Argentinidae |
Miscellaneous demersal fishes |
|
Hoplostethus atlanticus |
Orange roughy |
Trachichthyidae |
Miscellaneous demersal fishes |
|
Hyperoglyphe antarctica |
Bluenose warehou |
Centrolophidae |
Miscellaneous demersal fishes |
|
Lampanyctodes hectoris |
Hector's lanternfish |
Myctophidae |
Miscellaneous demersal fishes |
|
Lepidocybium flavobrunneum |
Escolar |
Gempylidae |
Miscellaneous demersal fishes |
|
Lepidopus caudatus |
Silver scabbardfish |
Trichiuridae |
Miscellaneous demersal fishes |
|
Macroramphosus scolopax |
Longspine snipefish |
Macroramphosidae |
Miscellaneous demersal fishes |
|
Maurolicus muelleri |
Silvery lightfish |
Sternoptychidae |
Miscellaneous demersal fishes |
|
Myctophidae |
Lanternfishes nei |
Myctophidae |
Miscellaneous demersal fishes |
|
Oreosomatidae |
Oreo dories nei |
Oreosomatidae |
Miscellaneous demersal fishes |
|
Pteryqotrigla picta |
Spotted gurnard |
Triglidae |
Miscellaneous demersal fishes |
|
Rexea solandri |
Silver gemfish |
Gempylidae |
Miscellaneous demersal fishes |
|
Ruvettus pretiosus |
Oilfish |
Gempylidae |
Miscellaneous demersal fishes |
|
Seriolella caerulea |
White warehou |
Centrolophidae |
Miscellaneous demersal fishes |
|
Seriolella punctata |
Silver warehou |
Centrolophidae |
Miscellaneous demersal fishes |
|
Thyrsitops lepidopoides |
White snake mackerel |
Gempylidae |
Miscellaneous demersal fishes |
|
Trachichthyidae |
Slimeheads nei |
Trachichthyidae |
Miscellaneous demersal fishes |
|
Trichiuridae |
Hairtails, scabbardfishes nei |
Trichiuridae |
Miscellaneous demersal fishes |
|
Callorhinchus capensis |
Cape elephantfish |
Callorhinchidae |
Sharks, rays, chimaeras |
|
Callorhinchus milii |
Ghost shark |
Callorhinchidae |
Sharks, rays, chimaeras |
|
Callorhinchus spp |
Elephantfishes nei |
Callorhinchidae |
Sharks, rays, chimaeras |
|
Centrophorus squamosus |
Leafscale gulper shark |
Squalidae |
Sharks, rays, chimaeras |
|
Centroscymnus crepidater |
Longnose velvet dogfish |
Squalidae |
Sharks, rays, chimaeras |
|
Chimaera monstrosa |
Rabbit fish |
Chimaeridae |
Sharks, rays, chimaeras |
|
Chimaeriformes |
Chimaeras, etc. nei |
|
Sharks, rays, chimaeras |
|
Hydrolagus novaezealandiae |
Dark ghost shark |
Chimaeridae |
Sharks, rays, chimaeras |
|
Hydrolagus spp |
Ratfishes nei |
Chimaeridae |
Sharks, rays, chimaeras |
|
Somniosus microcephalus |
Greenland shark |
Squalidae |
Sharks, rays, chimaeras |
|
Somniosus pacificus |
Pacific sleeper shark |
Squalidae |
Sharks, rays, chimaeras |
|
Chionoecetes opilio |
Queen crab |
Majidae |
Crabs, sea-spiders |
|
Geryon quinquedens |
Red crab |
Geryonidae |
Crabs, sea-spiders |
|
Geryon spp |
Geryons nei |
Geryonidae |
Crabs, sea-spiders |
|
Lithodes aequispina |
Golden king crab |
Lithodidae |
King crabs, squat-lobsters |
|
Paralomis spinosissima |
Antarctic stone crab |
Lithodidae |
King crabs, squat-lobsters |
|
Pleoticus robustus |
Royal red shrimp |
Solenoceridae |
Shrimps, prawns |
|
Plesiopenaeus edwardsianus |
Scarlet shrimp |
Aristaeidae |
Shrimps, prawns |
Global catches of oceanic species have been steadily increasing (except for a small decrease in the early 1980s) during the 50 years (1950-1999) for which data are available in the FAO database and reached about 8.6 million metric tonnes in 1999 (Figure 3). The share of oceanic catches in global marine catches ranged between 4 and 8 percent from 1950 to 1989. In recent years, the contribution of oceanic catches to total catches increased and exceeded 10% in 1998 and 1999 (Figure 4).
Figure 3. Global catch trend of oceanic species
Figure 4. Oceanic species share
in total marine catches
Until 1975, catches of deep-water species were relatively small, ranging between 2 and 10% of the total oceanic catches, but since the late 1970s their contribution has consistently been greater than 20%, reaching 33% of the total oceanic catches in the last two years for which catch statistics were available (Figure 3).
Among the epipelagic species, catches of tuna and tuna-like species have been increasing dramatically throughout the years. Since the mid-1960s, the rate of increase of tuna and tuna-like catches has been much higher in comparison to other epipelagic species and tuna catches are still growing at a rapid pace while those of the other species have decreased in recent years (Figure 5). Similarly, the deep-water group is dominated by Gadiformes species (ISSCAAP group 32) but some differences can be noted: over half of the catches of the deep-water Gadiformes in the 1975-99 period was constituted by a single species (i.e. Micromesistius poutassou, blue whiting), and the increasing trend of Gadiformes species was not as steady as that of tuna species and it experienced some drops (early and late 1980s, see Figure 6). There is also a big difference in market value between tunas, which are amongst the most valued fishery resources, and deep-water species which, as in the case of blue whiting, are mostly processed into fishmeal.
Figure 5. Captures of oceanic
epipelagic species
Figure 6. Captures of deep-water
species
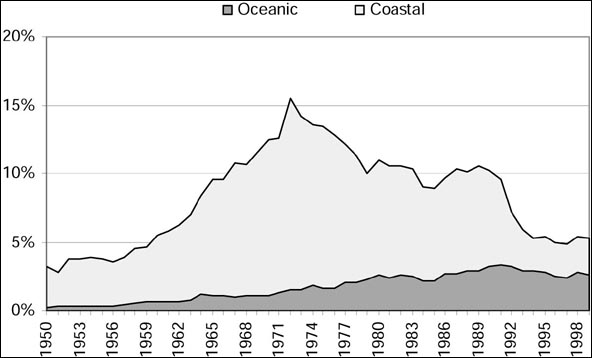
Total marine catches from distant water fisheries reported by DWFs increased from less than one million tonnes in the early 1950s to about 8 million tonnes in 1972, fluctuated around this value until 1991 and then declined rapidly to about 4.5 million tonnes, remaining stable in the most recent years. As a proportion of total marine captures, those reported by DWFs reached a maximum of 15.5% in 1972 and then declined to about 5%, a level at which they have stabilised since 1993 (Figure 7). The starting points of the two marked decreasing trends of DWF catches coincided with two historical events: the oil price hike (1973) and the dissolution of the Former USSR (1991) whose fleets where actively fishing in all oceans (for a more detailed analysis on global catches from DWFs, see Grainger and Garcia, 1996; for selected case studies on DWFs, see Bonfil et al., 1998).
Figure 7. Percentage of DWF catches in total catches broken down as oceanic and coastal species
As can be seen in Figures 7 and 8, until the 1970s catches of oceanic species were a minor portion of the total DWF catches but since 1993 oceanic catches of DWFs account for half or more of the total DWF catches. This remarkable change in the two fractions is due to the contemporaneous decrease of coastal species catches and increase of oceanic catches by DWFs. Following the declarations by an increasing number of countries of the Exclusive Economic Zones (EEZs), after the United Nations Convention on the Law of the Sea (UNCLOS) of 1982, distant water fishing nations had to negotiate access to the marine resources living within the 200 miles limit. This new situation, together with the increasing price of fuel oil, led to an overall increase of costs for DWFs that progressively shifted to oceanic species which are both highly valuable (e.g. tunas) and can be often caught in the high seas, outside areas of national jurisdictions.
Figure 8. Oceanic share in DWF
total catches
However, in terms of quantities, the increase of oceanic catches in recent years is entirely due to the contribution of bordering countries whose catches of oceanic species have been steadily increasing since the early 1980s (Figure 9).
Figure 9. Oceanic catches by DWFs and bordering countries
Figure 9 also shows that the majority (always over 75%) of oceanic catches by vessels of DWFs are of epipelagic species and that deep-water catches exceeded 200,000 tonnes only during the 1982-92 period.
As a proportion of total marine catches in this area, oceanic catches have a limited importance although there has been an increase in recent years (over 5% since 1994; Figure 10). Another peak of oceanic catches was reached in the late 1970s (a maximum of 8.5% on total catches in 1979) due to high catches (up to 90,000 tonnes) of Northern short-fin squid (Illex illecebrosus) reported by Canada. The Northern short-fin squid peak is paralleled by an increase in the same years of molluscan catches in general (Shotton, 1997a). After this peak, catches of deep-water species have always been greater than epipelagic catches reaching 85% of total oceanic catches in 1999. Most of the catches classified as deep-water in Northwest Atlantic are Canadian landings of queen crab (Chionoecetes opilio), which have been progressively increasing in the 1990s and reached more than 95,000 tonnes in 1999.
The percentage of oceanic catches taken by DWFs after the 1970s is very low but previously it reached two noticeable peaks in 1966 and the 1971-75 period. Major fishing nations targeting oceanic species in those years were Former USSR, Japan, Spain and Poland.
Catches of tuna and tuna-like species are not very high in this cold-water area and reached two peaks in the mid-1960s and early 1980s of approximately 17,000 tonnes. Since 1993, total catches of tunas have never exceeded 10,000 tonnes.
Figure 10. Northwest Atlantic (FAO Area 21)


In the Northeast Atlantic area, the peak of marine catches was reached in 1976 (Figure 11). In the same year, catches of oceanic species started to increase considerably, mostly due to catches of blue whiting (Micromesistius poutassou) reported by the Former USSR. This confirms what has been suggested by Cannon (1997), that when catches of historically valuable or traditional species such as cod, haddock and herring began to decline, they were progressively replaced by oceanic deep-water species, formerly not economically viable to exploit.
Since 1978, catches of blue whiting have contributed over three quarters of the deep-water catches in the area. Besides the Former USSR/Russian Federation, major countries fishing deep-water species in the Northeast Atlantic are Norway, Denmark, and Iceland. However, the marked decrease in recent years of the catch-per-unit-effort (CPUE) for some deep-water species (e.g. blue ling, Molva dypterygia, and roundnose grenadier, Coryphaenoides rupestris) in this area (Bergstad, et al., 2001) has prompted the Advisory Committee on Fishery Management (ACFM) of the International Council for the Exploration of the Sea (ICES) to recommend immediate reduction in deep-water fisheries unless they can be shown to be sustainable (ICES, 2002) and led the European Commission to propose extra measures to protect vulnerable deep-water species (Anonymous, 2002).
Catches of epipelagic species are not negligible in this area, but appear very low when compared to total marine catches. This is because the Northeast Atlantic has always been one of the most productive fishing areas in the world, together with the Northwest Pacific and the Southeast Pacific, due to the high productivity of its continental shelf. Catches of the two most important species, albacore and northern bluefin tuna, peaked in the early 1960s at around 65,000 tonnes and since 1968 have ranged between 27,000 and 42,000 tonnes. DWF catches in this area are very low, usually lower than 2% of the total oceanic catches.
Figure 11. Northeast Atlantic (FAO Area 27)


Oceanic catches in this area consist mostly of epipelagic species (Figure 12) since catches of deep-water resources appear to be negligible all along the time period. Over 75% of the total catches of epipelagic species are from tuna and tuna-like species. The remaining catches are mostly of dolphinfish (Coryphaena hippurus) and oceanic sharks of the family Carcharhinidae. Catches of tunas reached a peak in the mid-1980s of about 75,000 tonnes. In the last five years analysed (1995-99), these catches have stabilized around 47,000 tonnes. Overall, oceanic catches represent a minimal portion of the total marine catches, ranging mostly between 2 and 4%.
A comparison between the oceanic and total marine catches reported by DWFs shows that on average DWF oceanic catches represent 74% of all DWF catches, indicating that DWFs in this area target mostly oceanic species. The share of DWFs in the total oceanic catches has been considerable before 1980 with peaks in 1958 (61%), 1964 (78%) and for most of the 1970s. After 1980, the share of DWFs remained below 30% and has exceeded this value only in 1999 with increased tuna catches by Asian countries. It should be noted that about half of the 1994-99 tuna catches taken by DWFs in this area is included in the FAO database as caught by “Other nei (Other countries not elsewhere identified)” and not assigned to a specific country. FAO derives most of the catch statistics for tunas in the Atlantic Ocean from the data provided by the International Commission for the Conservation of Atlantic Tunas (ICCAT). In the ICCAT database, catches classified as “Other nei” are mostly Illegal, Unreported and Unregulated (IUU) catches estimated from trade data (ICCAT, 2001). This means that in this area an alarming quantity of tunas are illegally caught or not reported officially.
Figure 12. Western Central Atlantic (FAO Area 31)


This area, which extends along the west coast of Africa from Morocco southwards to the Democratic Republic of Congo, is characterized by a share of oceanic catches above the global average and by an historical presence of DWFs. Oceanic catches reached their peak in 1991 (402,000 tonnes) and, since then, they have ranged between 320,000 and 380,000 tonnes (Figure 13). About 95% of these quantities are composed of tuna and tuna-like species, the deep-water portion of oceanic catches always being rather small with a peak value of 43,000 tonnes in 1980 (approximately 28,000 tonnes of which constituted catches of snipefish, Macroramphosus scolopax, reported by the Former USSR).
The bulk of oceanic catches in this area is constituted by three species: skipjack, yellowfin and bigeye tunas. The main countries fishing tunas in recent years are Spain, France, Ghana and Japan. As for the Western Central Atlantic, a great and increasing quantity of tuna catches are included in the databases of international organizations (i.e. ICCAT and FAO) as taken by vessels of unknown nationality (“Other nei”). In 1990, the “Other nei” tuna catches were one quarter (36,000 tonnes) of the total tuna catches caught by DWFs, but in 1999 they reached the 40%.
The share of DWFs in oceanic catches has always been very significant in this area (Garibaldi and Grainger, 2002). Note that Spain and Portugal are classified as bordering countries because part of their territories (i.e. Canary and Madeira Islands) lies in this area. Absent until 1954, oceanic catches by DWFs reached almost 88% of total oceanic catches in 1961 and remained at around 80% for the whole of the 1960s. From the early 1970s until 1987 they slowly declined to 33%, but in the 1990s the DWFs share of oceanic catches increased again to about 55%.
Figure 13. Eastern Central Atlantic (FAO Area 34)


In FAO Area 37, oceanic catches represent a small portion of total marine catches but they nevertheless have considerable importance due to the high commercial value of some tuna and tuna-like species. Catches of all epipelagic species together have stabilized around 50,000 tonnes since 1984 and, after the highest ever peak of 69,000 tonnes in 1996, they decreased to 52,500 tonnes in 1999 (Figure 14). Bluefin tuna and swordfish are the main target of tuna fisheries, mostly conducted by bordering countries, while Asian countries are catching only a small portion of these very valuable species. Apart from tunas, other epipelagic species of some importance are dolphinfish (Coryphaena hippurus) and the European flying squid (Todarodes sagittatus).
The practice of fattening wild-caught bluefin tuna in captivity is booming in the area and from 1996 to 2001 there was at least a 20-fold increase in the number of cages in the Mediterranean (Miyake, et al., 2002). This practice aims mainly at increasing the fat content of the flesh, which strongly influences the price of the tuna meat in the Japanese sashimi market. The development of bluefin tuna farming has statistical, biological, management, environmental and socio-economic effects (GFCM-ICCAT, 2002) that need to be addressed urgently by international and national institutions.
As for the Northeast Atlantic area, the bulk of catches in deep waters are constituted by a single species, the blue whiting (Micromesistius poutassou). Landings of this species increased by about 50% in the 1990s in comparison to the previous decade, mainly due to catches reported by Turkey.
The Mediterranean and the Black Sea are semi-enclosed seas and environmental threats such as increasing coastal population, heavy shipping traffic and introduction of alien species are more serious than in open ocean areas. In this area, extended (up to 200 mile) EEZs have not be implemented because of geographical (i.e. complex coastal configurations and the presence of islands) and political circumstances (i.e. longstanding maritime and territorial disputes are historically present and the whole sea would be subject to the jurisdiction of coastal States; for a thorough analysis see: Kliot, 1987). Since national jurisdictions extend much less far than in other areas and the regional fishery management organization is still developing its management role, oceanic resources tend not to be managed and protected effectively.
Figure 14. Mediterranean and Black Sea (FAO Area 37)


The share of oceanic catches in total catches in this area is greater than the global average, exceeding 10% since 1982. Oceanic catches started increasing during the late 1970s (Figure 15); they showed a maximum in 1983 as percentage of total catches (18.5%) and in 1988 as absolute quantity (336,000 tonnes). In the last five years, total oceanic catches fluctuated around 250,000 tonnes. Since the early 1980s, most of the oceanic catches have been composed of deep-water species such as the southern blue whiting (Micromesistius australis), grenadiers (Macruronus magellanicus and Macrourus spp.), and recently by Patagonian toothfish (Dissostichus eleginoides). Catch peaks of southern blue whiting and grenadiers show an asynchronous pattern: the former had peak years in 1983 and 1990, the latter in 1988 and 1999. Until 1990, these species were caught mostly by DWFs (i.e. those of the Former USSR and other Eastern Europe countries), but immediately after these countries drastically reduced the activities of their DWFs, Argentina took over as the most important country fishing deep-water resources in the area.
Catches of epipelagic species are mainly composed of tuna and tuna-like species and the fleets accounting for the main catches are from Brazil, Taiwan Province of China, Spain and Japan. In the Southwest Atlantic, there are very important fisheries for cephalopods operated mainly by Argentina and Asian countries, but these catches were not included in the oceanic dataset object of this study, as only one cephalopod species distributed in this area (Martialia hyadesi) has been classified as fully oceanic. Significant catches (23,464 tonnes) for this species have been reported only in 1995 by Taiwan Province of China.
Figure 15. Southwest Atlantic (FAO Area 41)


This area is characterized by intermittent upwelling regimes that affect quantitative fisheries such as those for small pelagics and this is reflected in the total marine captures, which had periodic peaks (1968, 1973, 1978 and 1987) along the time series (Figure 16). After the 1987 peak (2,750,000 tonnes), total catches have constantly declined and in 1999 they were reduced to less than half (1,250,000 tonnes) of the latest peak. The general decline of marine catches has been associated to environmental changes (low oxygen levels in coastal waters) that led to the marked decrease of sardine stocks in the 1990s (Cochrane, 1997). Apparently, oceanic stocks were not affected by those environmental changes and their fisheries did not undergo any decline.
Share of oceanic catches was below 5% up to 1993, a value around which it has stabilized in recent years. It should be noted, that in this area there are only three coastal countries and that most of the oceanic catches are due to DWFs (Japan, Taiwan Province of China and, before 1980, the Former USSR). The DWFs portion of oceanic catches reached 93% in 1975 and remained high (between 50% and 80%) for the rest of the time series. The DWFs harvested mainly tuna species (bigeye and southern bluefin) and Geryon crabs (caught mainly by Japan) among the deep-water resources.
Figure 16. Southeast Atlantic (FAO Area 47)


Total marine captures in this area increased continuously from 1950 onwards and have stabilized around 3.9 million tonnes since 1997 (Figure 17). For the whole time series, the oceanic share has always been significant, reaching 20% for the first time in 1995 and a maximum of 22% in 1999. Since 1983, more than 75% of the oceanic catches have been from tuna species, while deep-water catches have increased only in the latest years as compared to the quantities reported in the earliest years of the time series. The majority of the deep-water catches are Indian catches of hairtails (family Trichiuridae), a group of fishes which could also be considered as epipelagic because it shows vertical feeding migration (Nakamura and Parin, 1993). A deep-water fishery that could possibly develop in future years is that for lanternfishes (family Myctophidae) in the Arabian Sea (Shotton, 1997b).
Since 1984, catches of oceanic tuna in this area have been increasing steeply and they exceeded 700,000 tonnes in 1999. About two thirds of these catches are harvested by European (e.g. Spain and France) and East Asian (Japan and Taiwan Province of China) fleets. In this area, as for the two tropical areas of the Atlantic Ocean, a great quantity of tuna catches (about 100,000 tonnes in 1999) are attributed to “Other nei” (not identified country) in the Indian Ocean Tuna Commission (IOTC) and FAO databases. Main tuna species caught are skipjack, yellowfin and bigeye tunas. Epipelagic species other than tuna represented in the fishery statistics are dolphinfish and sharks of the family Carcharhinidae.
Figure 17. Western Indian Ocean (FAO Area 51)


Trends in both total marine and oceanic captures in the Eastern Indian Ocean are very similar to those in the Western Indian Ocean. In both areas, total catches have been progressively increasing along the entire time series and tuna catches constitute the bulk of oceanic catches. The major differences are that the steep increase of tuna catches in the Eastern Indian Ocean took place about ten years later than in the Western Indian Ocean (in 1993 instead than 1984) and that DWFs have a more limited role in the Eastern area (Figure 18).
Main tuna target species are the same as in the Western Indian Ocean (i.e. skipjack, yellowfin and bigeye tunas). Bordering nations with important tuna fisheries are Sri Lanka and Indonesia, while Japan and Taiwan Province of China are the main distant water fishing fleets. From 1960 onwards, Sri Lanka has been reporting considerable catches of silky shark (Carcharhinus falciformis). Since 1980, catches of this species have ranged between 10,000 and 25,000 tonnes.
The share of deep-water catches is slightly higher (on average 18% of the oceanic catches) in comparison to the Western Indian Ocean, with the highest quantities (mostly hairtails catches by India and Indonesia) recorded in 1976 and in 1999. Significant catches of orange roughy in the Eastern area were reported for 1998 and 1999 (4,857 and 7,553 tonnes respectively) by Australia, while in previous years catches of this species were mostly concentrated in area 81 (Southwest Pacific).
Figure 18. Eastern Indian Ocean (FAO Area 57)


Total catches in this area are strongly influenced by the trend of marine captures reported by China, which imply an average rate of 10% increase per year in the 1984-99 period. If China is excluded, the sum of total catches of other countries has almost halved in the last ten years.
In contrast to other areas, oceanic catches in the Northwest Pacific have had a major importance, both in terms of quantities and of share, in the first half of the time series (1950-74) than in the second one (1975-99)(Figure 19). As for other temperate areas (e.g. Northwest Atlantic), the majority of the catches of epipelagic species are not accounted for by tuna and tuna-like species. The main epipelagic species caught throughout the years, mostly by Japan and secondarily by the Republic of Korea, are the Pacific saury (Cololabis saira) and the Japanese flying squid (Todarodes pacificus). Variations in the abundance of the latter strongly influence the general trend of oceanic catches in this area. Annual catches of Japanese flying squid depend largely on general environmental and ecological changes (Ogawa and Sasaki, 1991), such as water temperatures and abundance of predators and/or prey, and have shown recovering and increasing trends in the absence of management regulations (Sakurai et al., 1998).
Deep-water species represent only a small proportion of oceanic catches, with a single peak in the 1984-86 period due to catches reported by the Former USSR (silvery lightfish and grenadiers). There are no oceanic species catches reported for DWFs in this area.
Figure 19. Northwest Pacific (FAO Area 61)


As a proportion of total marine catches, oceanic catches in this area are negligible along the whole time series (percentages never exceed 3.5%; Figure 20). Oceanic catches had two peaks, the first and more significant one in the early 1970s and the second during the 1986-94 period. In both cases the bulk of the catches was represented by the deep-water sablefish, Anoplopoma fimbria. However, while the first peak was due to catches reported by DWFs (mostly Japan), the second was attributable to bordering countries (USA and Canada).
Waters of area 67, which extend southwards as far as Cape Mendocino in northern California, should be expected too cold for tuna species but for an eleven year period (1968-78) and in a recent year (1997) catches of tuna and tuna like species have exceeded 15,000 tonnes. Most of these quantities are albacore catches reported by USA. In the latest years, Japan reported about 1,000-2000 tonnes of catches of the neon flying squid (Ommastrephes bartrami) in this area.
Figure 20. Northeast Pacific (FAO Area 67)


As for the two Indian Ocean areas, total catches in this tropical area have been progressively increasing throughout the years, with oceanic catches accounting for a significant percentage (10-20%) of total catches in terms of quantity and much more in terms of value, and with DWFs always playing an important role (Figure 21). This is by far the most important FAO fishing area for catches of those tuna and tuna-like species classified as epipelagic (about 1.8 million tonnes in 1999; the second area in ranking, the Western Indian Ocean, totalled less than half of this).
The most important oceanic species caught in the area are skipjack (Katsuwonus pelamis) and yellowfin tuna (Thunnus albacares). Since 1970, catches of these two species have represented, without much oscillation, respectively 40-62% and 18-28% of the total catches of oceanic tunas. Distant water fleets took about half of these tuna catches throughout the whole time series. The main DWFs are from neighbouring Asian countries (i.e. Japan, Korea Rep., and Taiwan Province of China) and the USA. Among the bordering countries, Indonesia, the Philippines and the Solomon Islands are the countries reporting higher quantities of tuna catches in recent years.
Deep-water species have a very limited importance in comparison to the epipelagic species. Only for hairtails (family Trichiuridae) have there been significant catches, and these have been continuously increasing since 1975, reaching about 34,000 tonnes in 1999.
Figure 21. Western Central Pacific (FAO Area 71)


Oceanic catches represent a stable percentage (33% on average) of the total marine catches and showed a remarkable increase in the 1963-1985 period (up to 500,000 tonnes in 1985), which subsequently stabilized or slightly decreased (444,000 tonnes in 1999; Figure 22).
In the Eastern Central Pacific, as for the other tropical fishing areas, oceanic catches include mostly tuna and tuna-like species. Yellowfin, skipjack and bigeye are the most frequently caught species. Catches by DWFs have exceeded those by bordering countries in the 1985 and, since then, their share has been oscillating around 50% with a decrease in recent years. Main DWFs are from Japan (which has considerably reduced its portion of tuna catches in the latest years), Republic of Korea and Venezuela. Tuna catches by bordering countries are mostly for Mexico and the USA, with a remarkable change in their shares: in 1970, Mexico was catching 5.4% of the oceanic tunas by bordering countries and the USA 93.5% while in 1999 the Mexican share rose to 74.8% and that by of USA decreased to 14.9%.
In recent years, significant catches have been reported for the jumbo flying squid (Dosidicus gigas) and also a good portion of what was reported in previous years as “squids not elsewhere identified” were probably catches of jumbo flying squid (Csirke, 1997). Catches of the family Carcharhinidae and of other oceanic sharks are also represented in the FAO database for this area. Deep-water catches are almost absent in this area except for some thousand tonnes of the deep-water sablefish, Anoplopoma fimbria, reported by the USA.
Figure 22. Eastern Central Pacific (FAO Area 77)


This area has been characterized by increasing captures up to 1992 (when total marine catches reached over 900,000 tonnes) and by a slight decrease in the latest years (780,000 tonnes in 1999; Figure 23). This trend is closely matched by that of oceanic catches, mainly represented by deep-water species, which increased from 1,600 tonnes in 1950 to 498,000 tonnes in 1999 after a peak of almost 600,000 tonnes in 1992. The share of oceanic catches in total catches has been constantly increasing since the 1950s and in 1981 it exceeded that of coastal catches; in recent years it has stabilized at around 60%.
The great importance of oceanic catches is due to deep-water fisheries mainly targeting three species: the Gadiformes species blue grenadier (Macruronus novaezelandiae) and southern blue whiting (Micromesistius australis), and the orange roughy (Hoplostethus atlanticus). Up to the beginning of the 1980s, deep-water species were mostly caught by the Former USSR, while since mid-1980s Japan has been the main distant water fishing nation. New Zealand fisheries for deep-water species started to catch significant quantities in 1979 and from 1992 they have exceeded the total catches of all DWFs which have been declining. Australia, the only other bordering country, has caught considerable quantities of deep-water species only for a few years at the beginning of 1990s.
To better describe their trend, catches of epipelagic species can be divided into two time periods, before and after 1980-81. The first period was dominated by tuna catches, in particular those of southern bluefin tuna (Thunnus maccoyii). This species was so heavily fished in the 1960s that since mid-1980s the main fishing nations had to apply strict quotas to allow the stock to rebuild after a serious decline (CCSBT, 1997). In the second period, from 1981 onwards, fisheries for the Wellington flying squid (Nototodarus sloani) started developing. This species was targeted mostly by Japanese DWF vessels up to 1990, since when catches by New Zealand have progressively replaced those by DWFs.
Figure 23. Southwest Pacific (FAO Area 81)


Trend of total catches in the Southeast Pacific is strongly influenced by the oscillations of the anchoveta (Engraulis ringens) and of other small pelagic species. Biomass of these species fluctuates in relation to the availability of upwelling nutrients, which is driven by the El Niño phenomenon. Total catches being extremely high in this area (the 1994 peak was over 20 million tonnes), the share of oceanic catches has been always quite low not exceeding 4% up to 1997 (Figure 24). In 1998, total catches were lower due to El Niño, while oceanic catches increased and their share peaked at 8.1%. In 1999, oceanic catches reached their maximum at almost 900,000 tonnes but, with the total catches recovering, their share decreased to 6.2%.
A significant increase of oceanic catches started in 1987. Since then, total catches of epipelagic and deep-water species grouped separately showed a series of asynchronous peaks, although the total catches of each group in the whole 1987-99 period have been very similar. Main species among the epipelagics are skipjack and yellowfin tunas, which are increasingly caught by fleets of bordering countries (e.g. Ecuador and Colombia), while in the past DWFs played a major role. Catches of the jumbo flying squid by Japan, Republic of Korea and Peru had an extended peak in the 1991-97 period, collapsed almost to no catches in 1998 during El Niño, and recovered to a significant level (76,000 tonnes) when El Niño was over in 1999.
Deep-water catches have been mostly composed of Patagonian grenadier (Macruronus magellanicus) and secondarily by southern blue whiting (Micromesistius australis) and Patagonian toothfish (Dissostichus eleginoides). Almost all these catches were reported by Chile, and only very small quantities by DWFs.
Figure 24. Southeast Pacific (FAO Area 87)


For the Arctic area, the Former USSR reported catches to FAO only for the 1967-70 period. For this reason, the Arctic area has not been considered in this analysis.
Reporting of data for the three Antarctic areas started in 1966, but up to 1973 no oceanic species were caught (Figure 25). Since 1979, the krill Euphausia superba, an epipelagic species, has accounted for more than 70% of the total catches in the Antarctic areas, with the only exception of 1983-84 when catches dropped. Great quantities of krill have been taken by the Former USSR (with a peak of almost 500,000 tonnes in 1982) up to 1991-92 when, after the dissolution of the USSR, the new Republics drastically reduced their Antarctic fishing activities. In contrast, Japan has steadily caught krill since the 1980s ranging between 40,000 and 80,000 tonnes yearly.
Deep-water species are limited to an extended peak of Myctophidae (lanternfishes) caught during the 1988-92 period by Former USSR countries, and to catches of Patagonian toothfish (Dissostichus eleginoides), mainly in area 58 (Antarctic Indian Ocean).
Decreasing total catches in recent years are due to specific causes, such as the distance from other major fishing grounds and the lack of demand for some Antarctic species (Shotton, 1997c; Nicol and Endo, 1999), rather than to a depletion of the living resources, which are carefully managed by the Commission for the Conservation of Antarctic Living Resources (CCAMLR), although concern is rising for IUU catches of Patagonian toothfish (Lack and Sant, 2001).
Figure 25. Antarctic areas (FAO Areas 48, 58, 88) all together


The classification of the oceanic species items (either epipelagic or deep water) included in the FAO capture fisheries database has allowed a description of the increasing share of oceanic catches in total global marine catches. In the 1990s, concurrent with a slightly declining trend in total coastal species catches (excluding Peruvian anchoveta), both groups of oceanic species have increased their catches by 1 million tonnes, epipelagics from 4.8 to 5.7 million tonnes and deep-water species from 1.8 to 2.9 million tonnes.
The majority of oceanic epipelagic catches (mainly tuna and tuna-like species) is from tropical areas whereas deep-water species are mostly caught in temperate regions. In the last decade, a continuous increase of epipelagic catches has occurred in the tropical areas of the Indian and Pacific Oceans whereas in the two tropical Atlantic areas they have been oscillating and in 1999 totalled catches similar to those of 1990. Deep-water catches have recently increased remarkably in the North Atlantic, probably due to a shift of fishing effort to new target species after the decline of other marine resources in the area, although there have been signs of declining catches in other areas (e.g. Southwest Atlantic, Northeast Pacific and Southwest Pacific) where deep-water species have been caught in significant quantities during the 1980s and in the early 1990s.
However, due to the peculiar biological characteristics of deep-water species, concern is rising on the sustainability of deep-water fisheries and, in particular in the Northeast Atlantic, regional fishery commissions and related institutions are proposing action to protect the deep-water stocks (Anonymous, 2002; ICES, 2002). With regard to oceanic tunas and tuna-like species, differences in life history traits between tropical tunas and temperate tunas may result in different responses to fishing pressure (Fromentin and Fonteneau, 2001) and partially explain why catches of tropical species are still growing whereas stocks of temperate bluefin tuna species have shown serious declines in biomass and catches.
Angel, M.V. 1993. “Biodiversity of the pelagic ocean”. Conservation Biology. 7(4): 760-766.
Anonymous. 2002. “EU to protect deep-water species”. Worldfish Report. 2002. No. 161, March 6, 2002. Agra Europe, London, UK.
Bergstad, O.A., J.D..M. Gordon , and P. Large. 2001. “Is time running out for deep-sea fish?” ICES Newsletter. No. 38. December 2001.
Bonfil, R., G. Munro, U.R. Sumaila, H. Valtysson, M. Wright, T. Pitcher, D. Preikshot, N.Haggan, and D. Pauly. 1998. “Impacts of distant water fleets: an ecological, economic and social assessment”. In: WWF. The Footprint of Distant Water Fleet on World Fisheries. Endangered Sea Campaign, WWF International, Godalming, Surrey, UK.
Caddy, J.F., F. Carocci, and S. Coppola. 1998. “Have peak fishery production levels been passed in continental shelf? Some perspectives arising from historical trends in production per shelf area”. Journal of Northwest Atlantic Fishery Science. 23: 191-219.
Caddy, J.F. and P.G. Rodhouse. 1998. “Cephalopod and groundfish landings: evidence for ecological change in global fisheries?” Reviews in Fish Biology and Fisheries. 8(4): 431-444.
Cannon, J. 1997. “Northeast Atlantic”. In: FAO, Review of the State of World Fishery Resources: Marine Fisheries. FAO Fisheries Circular No. 884. FAO, Rome, Italy.
Carpenter, K.E. and V.H. Niem (eds.). 1999. FAO species identification guide for fishery purposes. The living marine resources of the Western Central Pacific. Volume 3. Batoid fishes, chimaeras and bony fishes part 1 (Elopidae to Linophrynidae). FAO, Rome, Italy.
CCSBT (Commission for the Conservation of Southern Bluefin Tuna). 1997. “Fact Sheet”. On-line at: http://www.home.aone.net.au/ccsbt/facts.html. Viewed 28/08/01.
Clark, M. 1998. “Are deep-water fisheries sustainable? The example of orange roughy in New Zealand”. In: International Council for the Exploration of the Sea (ICES), ICES Theme Session on Impact of Cephalopods in the Food Chain. ICES-CM-1998/O:14. ICES, Copenhagen, Denmark.
Cochrane, K. 1997. “Southeast Atlantic”. In: FAO, Review of the State of World Fishery Resources: Marine Fisheries. FAO Fisheries Circular No. 884. FAO, Rome, Italy.
Csirke, J. 1997. “Eastern Central Pacific”. In: FAO, Review of the State of World Fishery Resources: Marine Fisheries. FAO Fisheries Circular No. 884. FAO, Rome, Italy.
FAO (Food and Agriculture Organization of the United Nations). 1994. “World review of highly migratory species and straddling stocks”. FAO Fisheries Technical Paper. No. 337. FAO, Rome, Italy.
FAO (Food and Agriculture Organization of the United Nations). 2001. Yearbook of Fishery Statistics - Capture Production 1999. Vol. 88/1. FAO, Rome, Italy. Downloadable at: http://www.fao.org/fi/statist/FISOFT/FISHPLUS.asp
Fromentin, J-M. and A. Fonteneau, 2001. “Fishing effects and life history traits: a case study comparing tropical versus temperate tunas”. Fisheries Research. 53: 133-150.
Garibaldi, L. and R.J.R. Grainger. 2002. “Chronicles of catches from marine fisheries in the Eastern Central Atlantic for 1950-2000”. In: Ba, M., P. Chavance, D. Gascuel, D. Pauly and M. Vakily (eds.), Proccedings of the Symposium “Marine fisheries, ecosystems, and societies in West Africa: half a century of change”, Dakar, Senegal, 24-28 June 2002. ACP-EU Fisheries Research Report of the European Union, in press.
GFCM (General Fisheries Commission for the Mediterranean) - ICCAT (International Commission for the Conservation of Atlantic Tunas). 2002. Report of the sixth GFCM-ICCAT meeting on stocks of large pelagic fishes in the Mediterranean. Sliema, Malta, 15-19 April 2002. On-line at: http://www.iccat.es/.
Gonzales, A.F, P.N. Trathan, C. Yau, and P.G. Rodhouse. 1997. “Interactions between oceanography, ecology and fishery biology of the ommastrephid squid Martialia hyadesi in the South Atlantic”. Marine Ecology Progress Series. 152 (1-3): 205-215.
Grainger, R.J.R. and S.M. Garcia. 1996. “Chronicles of marine fishery landings (1950-1994): Trend analysis and fisheries potential”. FAO Fisheries Technical Paper. No. 359. FAO, Rome, Italy.
Helfman, G.S., B.B. Collette, and D.E. Facey. 1997. The diversity of fishes. Blackwell Science, Inc., Malden (Mass.), USA.
ICCAT (International Commission for the Conservation of Atlantic Tunas). 2001. ICCAT Report to the Nineteenth Session of the Coordinating Working Party on Fishery Statistics. Noumea, New Caledonia, July 10-13, 2001. On-line at: ftp://ftp.fao.org/fi/document/cwp/cwp_19/CWP-19-iccat.pdf . Viewed 31/08/01.
ICES (International Council for the Exploration of the Sea). 2002. Advisory Committee on Fishery Management (ACFM) - 2002 Report. On-line at: http://www.ices.dk/committe/acfm/comwork/report/2002/oct/o-3-13.pdf .Viewed 13/12/02.
Kliot, N. 1987. “Maritime boundaries in the Mediterranean: aspects of cooperation and dispute”. In: G. Blake, ed. Maritime Boundaries and Ocean Resources. Croom Helm, London, UK.
Lack, M. and G. Sant. 2001. “Patagonian toothfish: are conservation and trade measures working?” Traffic Bulletin. 19 (1): 15-32.
Miyake, P.M., J.M. de la Serna, A. Di Natale, A. Farrugia, I. Katavic, N. Miyabe, and V. Ticina. 2002. “General review of bluefin tuna farming in the Mediterranean area”. Sixth GFCM-ICCAT meeting on stocks of large pelagic fishes in the Mediterranean. Sliema, Malta, 15-19 April 2002. ICCAT-SCRS/02/36.
Nakamura, I. and N. V. Parin. 1993. Snake mackerels and cutlassfishes of the world. FAO Fisheries Synopsis No. 125, vol. 15. FAO, Rome, Italy.
Nicol, S. and Y. Endo. 1999. “Krill fisheries development, management and ecosystem implications”. Aquatic Living Resources. 12(2): 105-120.
Ogawa, Y. and T. Sasaki. 1991. “Catch-fluctuation patterns of Todarodes pacificus (Steenstrup) in northern Japanese coastal waters of the Pacific Ocean”. Can. Transl. Fish. Aquat. Sci. 5523: 1-24.
Sakurai, Y., J.R. Bower, H. Kiyofuky, S. Saitoh, T. Goto, Y. Hiyama, K. Mori, and Y. Nakamura. 1998. “Changes in inferred spawning sites of Todarodes pacificus (Cephalopoda: Ommastrephidae) due to changing environmental conditions”. In: International Council for the Exploration of the Sea (ICES), ICES Theme Session on Impact of Cephalopods in the Food Chain. ICES-CM-1998/M:18. ICES, Copenhagen, Denmark.
Shotton, R. 1997a. “Northwest Atlantic”. In: FAO, Review of the State of World Fishery Resources: Marine Fisheries. FAO Fisheries Circular No. 884. FAO, Rome, Italy.
Shotton, R. 1997b. “Lanternfishes: a potential fishery in the Northern Arabian Sea?”. In: FAO, Review of the State of World Fishery Resources: Marine Fisheries. FAO Fisheries Circular No. 884. FAO, Rome, Italy.
Shotton, R. 1997c. “Southwest Pacific”. In: FAO, Review of the State of World Fishery Resources: Marine Fisheries. FAO Fisheries Circular No. 884. FAO, Rome, Italy.
Smith, D.C., G.E. Fenton, S.G. Robertson, and S.A. Short. 1995. “Age determination and growth of orange roughy (Hoplostethus atlanticus): a comparison of annulus counts with radiometric ageing”. Canadian Journal of Fisheries and Aquatic Sciences. 52(2): 391-401.
Torry Research Station. 1980. “Handling and Processing Blue Whiting”. Torry Advisory Note. No. 81. Torry Research Station, Aberdeen, UK.
![]()
![]()
![]()