

Required
citation:
FAO. 2020. World Food and Agriculture - Statistical Yearbook
2020. Rome.
https://doi.org/10.4060/cb1329en
The designations employed and the presentation of material in this information product do not imply the expression of any opinion whatsoever on the part of the Food and Agriculture Organization of the United Nations (FAO) concerning the legal or development status of any country, territory, city or area or of its authorities, or concerning the delimitation of its frontiers or boundaries. The mention of specific companies or products of manufacturers, whether or not these have been patented, does not imply that these have been endorsed or recommended by FAO in preference to others of a similar nature that are not mentioned.
ISBN 978-92-5-133394-5
© FAO,
2020
Some rights reserved. This work is made available under the Creative Commons Attribution-NonCommercial-ShareAlike 3.0 IGO licence (CC BY-NC-SA 3.0 IGO; https://creativecommons.org/licenses/by-nc-sa/3.0/igo/legalcode).
Under the terms of this licence, this work may be copied, redistributed and adapted for non-commercial purposes, provided that the work is appropriately cited. In any use of this work, there should be no suggestion that FAO endorses any specific organization, products or services. The use of the FAO logo is not permitted. If the work is adapted, then it must be licensed under the same or equivalent Creative Commons licence. If a translation of this work is created, it must include the following disclaimer along with the required citation: “This translation was not created by the Food and Agriculture Organization of the United Nations (FAO). FAO is not responsible for the content or accuracy of this translation. The original [Language] edition shall be the authoritative edition.”
Disputes arising under the licence that cannot be settled amicably will be resolved by mediation and arbitration as described in Article 8 of the licence except as otherwise provided herein. The applicable mediation rules will be the mediation rules of the World Intellectual Property Organization http://www.wipo.int/amc/en/mediation/rules and any arbitration will be conducted in accordance with the Arbitration Rules of the United Nations Commission on International Trade Law (UNCITRAL).
Third-party materials. Users wishing to reuse material from this work that is attributed to a third party, such as tables, figures or images, are responsible for determining whether permission is needed for that reuse and for obtaining permission from the copyright holder. The risk of claims resulting from infringement of any third-party-owned component in the work rests solely with the user.
Sales, rights and licensing. FAO information products are available on the FAO website (www.fao.org/publications) and can be purchased through [email protected]. Requests for commercial use should be submitted via: www.fao.org/contact-us/licence-request. Queries regarding rights and licensing should be submitted to: [email protected].
Now more than ever, timely, accurate and high-quality statistics are essential to monitor trends and inform policy decisions, whether concerning the longer-term challenge of delivering on the Sustainable Development Goals (SDGs), or the immediate threat represented by the COVID-19 pandemic.
Statistical work has been at the core of FAO’s activities and mandate since its foundation in 1945. FAO is a leading provider of internationally comparable data on food, nutrition and agriculture, which is gathered from national statistical offices and its network of partner agencies, and harmonized to paint a global picture. Data provide, at the same time, the indispensable evidence base that countries require to formulate policy decisions and monitor progress towards agreed objectives. All these data are summarized in this Statistical Yearbook.
After seven years of absence, the revamp of the FAO Statistical Yearbook coincides with the 75th anniversary of the Organization. This is per se a strong statement on the importance and value that FAO assigns to data and statistics as a strategic global public good that contributes to shaping the future world, and is at the foundation of our efforts to advance sustainable development.
Drawing on the wealth of information that FAO statisticians produce across the Organization, this publication, prepared by the Statistics Division, offers a synthesis of the major factors at play in the global food and agricultural landscape. Statistics are presented in four thematic chapters, covering the economic importance of agricultural activities, inputs, outputs and factors of production, their implications for food security and nutrition and their impacts on the environment. The Yearbook is meant to constitute a primary tool for policy makers, researchers and analysts, as well as the general public interested in the past, present and future path of food and agriculture.
It has to be noted that this Statistical Yearbook is only one of a series of tools and statistical publications that FAO provides to users. The freely accessible FAOSTAT data platform contains the largest statistical database on food and agriculture in the world, with approximately 20 000 indicators covering more than 245 countries and territories, and around two million users each year. FAO’s Statistical Pocketbook complements the Yearbook, by providing a quick and easy reference on the main facts and trends of food and agriculture.
In addition to compiling and disseminating data like those presented in this Yearbook, FAO is also involved in strengthening the statistical capacity of countries to produce more and better data; setting standards and methodologies; and leveraging big data innovations. FAO is committed to ensuring free access to current, reliable, timely and trusted data, as it is necessary to chart a course towards a more sustainable agriculture and a world free of hunger.
José
Rosero Moncayo
Director, Statistics Division
This statistical yearbook was prepared by the Statistics Division (ESS) of the Food and Agriculture Organization of the United Nations (FAO) in collaboration with the Communications (OCC), Fisheries (NFI), Forestry (NFO), Land and Water (NSL) and Markets and Trade (EST) divisions. Olivier Lavagne d’Ortigue led the work under the direction of José Rosero Moncayo (ESS Director). We would like to thank the following for their contributions and input: Roberto Bargigia, Carlo Cafiero, Jairo Castano, Giulia Conchedda, Piero Conforti, Christophe Duhamel, Carola Fabi, Juan Feng, Laura Galeotti, Upali Galketi Aratchilage, Pietro Gennari, Filippo Gheri, Virginie Gillet, Chiara Gnetti, Amanda Gordon, Leman Yonca Gürbüzer, Dominique Habimana, Irina Kovrova, Suzanne Lapstun, Arvydas Lebedys, Eun Jeong Lee, Jeannie Marshall, Iswadi Mawabagja, Sharon Mayienga, Sara Montanaro, Javier Montero Serrano, Jean-Marie Munyeshyaka, Beverley New, Giorgio Pala, Raffaella Rucci, Salar Tayyib, Francesco Tubiello, Monica Umena, Stefania Vannuccini, Sven Walter and Nathan Wanner.
The Statistical Yearbook 2020 is divided into four thematic chapters:
• Chapter 1 (Economic dimensions of agriculture) provides an overview of agriculture, forestry and fishing from an economic standpoint.
• Chapter 2 (Production, trade and prices of commodities) presents the outputs of the sector in terms of the production and trade of the different commodities and the evolution of prices.
• Chapter 3 (Food security and nutrition) looks at how some of these outputs are consumed by narrowing the focus on food security and nutrition.
• Chapter 4 (Sustainability and environmental aspects of agriculture) deals with the impacts of the sector as a whole on the environment.
Each chapter draws on the latest available data to describe through text and charts the trends since the early 2000s. As data on each topic are produced according to different schedules and with different methods and sources, the latest year available can change between sections.
The country classification adopted in this publication is based on the United Nations M49 classification (https://unstats.un.org/unsd/methodology/m49/). The country names have been abbreviated in the data tables and figures. The official FAO names can be found at http://termportal.fao.org/faonocs/appl/.
Regional and subregional aggregates are based on the country groupings defined in the United Nations M49 classification. A small subset of indicators used in Part 3 is based on the aggregation rules defined in The State of Food Security and Nutrition in the World 2020 report (https://doi.org/10.4060/ca9692en).
Two types of aggregations are used: sum and weighted mean. A sufficiency condition is imposed when computing the aggregation – the aggregation is computed only when enough countries have reported data, and the current threshold is set at 50 percent of the variable and the weighting variable, if present.
The cut-off date for the data is 21 September 2020.
• When country data have not been reported for the reference year, an asterisk (*) on the year label indicates that the value for the most recent year available is shown. For example, 2016–2018* means that the most recent value for the period from 2016 to 2018 is shown.
• A billion is 1 000 million.
• A trillion is 1 000 billion.
• In data tables:
• A blank means that data are not available or that aggregates cannot be calculated because of missing data for the years shown.
• 0 or 0.0 means zero or a number that is small enough to round to zero at the displayed number of decimal places.
• <2.5 means a proportion less than 2.5 percent.
• <0.1 means less than 100 000 people.
1. Value added of agriculture, forestry and fishing by region
2. Share of agriculture, forestry and fishing value added in total GDP by region (USD 2015 prices)
3. World agricultural land by use
5. World agricultural land by use and main countries (2018)
6. Cropland area per capita by region
7. Area equipped for irrigation by region
8. Share of area equipped for irrigation in land area by region
9. Share of water withdrawal by agriculture in total withdrawal, top countries (2000–2017*)
10. Employment in agriculture, forestry and fishing by region
11. Share of agriculture, forestry and fishing employment in total employment by region
12. Share of women in agriculture, forestry and fishing employment, top countries (2019)
16. Pesticide use per cropland area by region
17A. Chemical fertilizer use by region (Nitrogen, as N)
17B. Chemical fertilizer use by region (Phosphorus, as P2O5)
17C. Chemical fertilizer use by region (Potassium, as K2O)
17D. Chemical fertilizer use by region (Total)
18. Chemical fertilizer use by nutrient and region
19. Chemical fertilizer use per cropland area by NUTRIENT and region
20. World production of crops by commodity group
21. World production of crops, main commodities
22. World production of main primary crops by main producers (2018)
23. World production of vegetable oils, main commodities
24. World production of main vegetable oils by main producers (2017)
25. World production of raw sugar, main producers
26. World production of meat, main items
27. World production of main meat items, main producers (2018)
28A. World production of milk by region
28B. World production of milk by main producers (2018)
29A. World production of hen eggs By region
29B. World production of hen eggs by main producers (2018)
30. World capture fisheries and aquaculture production by species group
31. World capture fisheries and aquaculture production by production mode
32. World capture fisheries and aquaculture production by main producers (2018)
33. World production of roundwood by type
34. World production of roundwood by type, main producers (2018)
35A. World production of selected forest products
35B. World production of selected forest products
36. Value of world food exports
38. Food imports and exports by main categories and region (2018)
39. World exports of cereals by main commodities
40. Main traded cereals, top importers and exporters (quantities, 2018)
41. Value of world forest product exports
42. FAO Food Price Index, world (2014–2016=100)
43. FAO food commodity price indices, world (2014–2016=100)
44. Fish Price Index, world (2014–2016=100)
45. Changes in prices received by farmers, top and bottom countries (2018)
46. Consumer price inflation rates for food by region
47. Prevalence of undernourishment by region
48. Number of people undernourished by region
B1. Food insecurity levels by region and gender (2019)
49. Food insecurity levels based on the Food Insecurity Experience Scale by region
50. Average dietary energy supply by region
51. Cereal import dependency ratio, top countries (2015–2017)
52. Dietary energy supply by region and commodity group
53. Average protein supply by region and origin
54. Average dietary supply adequacy by region
55. Prevalence of stunting in children under 5 years by region
56. Prevalence of obesity in the adult population by region
57. Prevalence of obesity in the adult population, top countries (2016)
58. Share of land area by type and region
59. Share of forest area in total land area, top countries (2018)
60. World primary crops commodities harvested area by type
61. World area under organic agriculture, main countries (2018)
62. Share of area under organic agriculture in total agricultural area, top countries (2018)
63. Water stress, top countries (2009–2017*)
64A. Nitrogen use per cropland area by region Manure (organic)
64B. Nitrogen use per cropland area by region Mineral (CHEMICAL)
B2. Food losses from post-harvest to distribution by commodity groups (2016)
B3. Global trends in the state of the world’s marine fish stocks
66. World crops and livestock greenhouse gas emissions by activity
67. World emissions intensity of agricultural commodities (2017)
68. Temperature change by region
1. Value added of agriculture, forestry and fishing (USD million, 2015 prices)
2. Share of agriculture, forestry and fishing value added in total GDP (USD 2015 prices) (percent)
3. Agricultural land by use (thousand ha)
4. Cropland area per capita (ha per capita)
5. Area equipped for irrigation (thousand ha)
6. Share of area equipped for irrigation in land area (percent)
7. Share of water withdrawal by agriculture in total withdrawal (percent)
8. Employment in agriculture (thousand people)
9. Share of agriculture employment in total employment (percent)
10. Share of women in agriculture, forestry and fishing employment (percent)
14. Pesticide use per cropland area (kg per ha)
15. Chemical fertilizer use by nutrient (thousand tonnes)
16. Chemical fertilizer use per cropland area by nutrient (kg per ha)
17. Production of primary crops by group, 2018 (thousand tonnes)
18. Production of primary crops main commodities, 2018 (thousand tonnes)
19. Production of vegeoils main commodities (thousand tonnes)
20. Production of raw sugar (thousand tonnes)
21. Production of meat (thousand tonnes)
22. Production of milk (thousand tonnes)
23. Production of hen eggs (thousand tonnes)
24. Capture fisheries and aquaculture production, 2018 (thousand tonnes)
25. Capture fisheries and aquaculture production by mode (thousand tonnes)
26. Production of roundwood by type (thousand m3)
27. Production of selected forest products, 2018
28. Food exports, 2018 (USD million)
29. Food net trade (USD million)
30. Food imports, 2018 (USD million)
31. Cereals exports (thousand tonnes)
32. Cereals imports and exports by main commodities, 2018 (thousand tonnes)
33. Forest products exports, 2018 (USD million)
34. FAO food price indices (2014–2016=100)
35. Changes in prices received by farmers (percent)
36. Consumer price inflation rates for food (percent)
37. Prevalence of undernourishment (percent)
38. People undernourished (million)
39. Food insecurity levels (percent)
40. Average dietary energy supply (kcal per capita per day)
41. Cereal import dependency ratio (percent)
42. Dietary energy supply by commodity group, 2017 (kcal per capita per day)
43. Average protein supply by origin (g per capita per day)
44. Average dietary supply adequacy (percent)
45. Children under 5 years who are stunted (percent)
46. Prevalence of obesity in the adult population (percent)
47. Land area by type (thousand ha)
48. Share of forest area in total land area (percent)
49. Primary crops commodities harvested area by type, 2018 (thousand ha)
50. Area under organic agriculture (thousand ha)
51. Share of area under organic agriculture in total agricultural area (percent)
53. Nitrogen use per cropland area (kg per ha)
54. Greenhouse gas emissions due to agriculture and related land use, 2017 (million tonnes CO2eq)
55. Crops and livestock greenhouse gas emissions by activity, 2017 (million tonnes CO2eq)
56. Emissions intensity of agricultural commodities, 2017 (kg CO2eq per kg)
57. Temperature change (degree Celsius)
1. Value added of agriculture, forestry and fishing by region (2018)
2. Share of agriculture, forestry and fishing value added in total GDP (2018, USD 2015 prices)
3. Employment in agriculture, forestry and fishing (2019)
4. Share of agriculture, forestry and fishing employment in total employment (2019)
9. Production of cereals (2018)
10. Production of sugar cane (2018)
11. Production of maize (2018)
13. Production of wheat (2018)
14. Production of potatoes (2018)
15. Production of soybeans (2018)
16. Production of pig meat (2018)
17. Production of chicken meat (2018)
18. Production of cattle meat (2018)
20. capture fisheries and aquaculture production (2018)
21. Aquaculture production (2018)
22. Importers and exporters of forest products (2018)
23. Importers and exporters of food (2018)
24. Food price inflation (2019 average)
25. Prevalence of undernourishment (2017–2019 average)
26. Number of undernourished people (2017–2019 average)
27. Prevalence of stunting in children under 5 years (2000–2019*)
28. Prevalence of obesity in the adult population (2016)
29. Share of forest area in land area (2018)
30. Total renewable water resources per capita (2017)
32. Greenhouse gas emissions due to agriculture and related land use (2017)
1. Focus on The State of Food Security and Nutrition in the World (SOFI) 2020
2. Focus on The State of Food and Agriculture (SOFA) 2019
3. Focus on The State of World Fisheries and Aquaculture (SOFIA) 2020
The global value added generated by agriculture, forestry and fishinga grew by 68 percent in real terms between 2000 and 2018, reaching USD 3.4 trillion in 2018 (see FIGURE 1). This represents an increase of USD 1.4 trillion compared with 2000. In Africa, the value added more than doubled over the period, increasing from USD 170 billion to USD 397 billion. Given its size, Asia was the main contributor to global agriculture, forestry and fishing value added with 63 percent of the world total in 2018: the continent shows an increase of 77 percent, from USD 1.2 trillion in 2000 to USD 2.2 trillion in 2018. The Americas and Oceania present an increase of 47 percent and 21 percent respectively in the 2000–2018 period, while Europe increased its agricultural value added by 18 percent, from USD 278 billion in 2000 to USD 329 billion in 2018. The countries with the largest agriculture, forestry and fishing sector in terms of value added in 2018 are China, India and the United States of America (see TABLE 1).

As non-agricultural activities outpaced agriculture, the global contribution of agriculture to gross domestic product (GDP) declined, which is expected to accompany the growth of total GDP (see FIGURE 2). The share of value added from agriculture, forestry and fishing fell between 2000 and 2018 in all regions except Africa: from 1.8 percent to 1.6 percent in 2018 in Europe, from 10.3 percent to 7.2 percent in Asia, and from 4.0 percent to 2.9 percent in Oceania (it remained virtually unchanged in the Americas at 1.8 percent). It rose marginally in Africa from 14.3 percent to 15.8 percent. This trend, which is seldom observed, is due to increases in the GDP share of agriculture in a number of countries – Algeria, Angola, Chad, the Congo, Eritrea, Gabon, Guinea, Mali, Morocco, the Niger, Nigeria and Sierra Leone. These countries account for about half the total value added from agriculture, forestry and fishing in Africa in 2018 (see TABLE 2). Despite its relatively small economic size, the sector plays a crucial role in the agro-industry value chain and in the use of natural resources. As such, agriculture affects the quality of the environment and food security beyond what its contribution to GDP indicates.

In 2018, the global agricultural land area was 4.8 billion hectares (ha), down 2 percent, or 0.08 billion ha compared with 2000 (see FIGURE 3). Between 2000 and 2018, roughly two-thirds of agricultural land were used for permanent meadows and pastures (3.2 billion ha), which declined by 5 percent (0.15 billion ha). One-third of the total agricultural land was cropland (1.6 billion ha), which increased by 5 percent (0.07 billion ha). Although agricultural land decreased since 2000, it increased on average by 0.1 percent each year over the 1961–2018 period, with a significant expansion up to the 1990s.1

The regional breakdown of the global cropland area varied marginally between 2000 and 2018 (see FIGURE 4). Asia had the largest share of the global cropland area in 2018 (38 percent), followed by the Americas (24 percent), Europe (18 percent), Africa (18 percent) and Oceania (2 percent). Nonetheless, there were differences in cropland expansion in the different regions during this period – Oceania and Africa both had rapid growth in cropland area (25 percent and 21 percent, respectively), while Asia had more moderate growth (5 percent). The cropland area of the Americas remained more or less stable during this period, while Europe was the only region to reduce the amount of land area devoted to crops.

Approximately 30 percent of global cropland and permanent meadows and pastures can be found in three countries (see FIGURE 5), which are not necessarily the ones with the largest country area.b In 2018, 12 percent of global permanent meadows and pastures belonged to China, 10 percent to Australia, and 8 percent to the United States of America. For the same year, the largest share of global cropland was in India (11 percent), followed by the United States of America (10 percent) and China (9 percent). Extensive grasslands versus croplands in agricultural land can indicate intensified livestock practices as opposed to the harvesting of crops.

Cropland area per capita decreased in all regions between 2000 and 2018 as population increased faster than cropland (see FIGURE 6). The world average declined by 15 percent to 0.21 ha per capita in 2018; the decrease was the largest in Africa (-23 percent, to 0.22 ha per capita), followed by the Americas (-15 percent, to 0.38 ha per capita), Asia (-14 percent, to 0.13 ha per capita), Europe (-8 percent, to 0.39 ha per capita) and Oceania (-5 percent, to 0.81 ha per capita). Against this backdrop, the increase in agricultural production over the same period (described in Chapter 2) indicates higher efficiency in feeding the population with limited land resources. The countries with the highest cropland area per capita are Kazakhstan, Australia and Canada (see TABLE 4), due to vast areas of land available over sparsely populated areas. Other reasons for high values include the intense use of agricultural inputs over cropland and dependencies on agricultural imports or food aid.

The development of irrigation is one aspect of agriculture intensification that has allowed total production to grow much faster than the cultivated area.
The global land area equipped for irrigation reached 339 million ha in 2018 (see FIGURE 7), an increase of 17 percent from the 288 million ha of 2000 and more than twice the 1960s irrigated area.2 The vast majority is located in Asia (70 percent), where irrigation was a key component of the green revolution;3 the Americas account for 16 percent and Europe for 8 percent of the world total. As shown in TABLE 5, China (74 million ha) and India (70 million ha) have the largest equipped area for irrigation, far ahead of the United States of America (27 million ha). China and India also have the largest net gains in equipped area between 2000 and 2018 (+20 million ha for China and +10 million ha for India). All the regions except Europe saw increases in the area equipped for irrigation, with Oceania growing the fastest (+23 percent), followed by Africa (+21 percent) and the Americas (+20 percent).

The share of equipped area for irrigation in agricultural land increased to 7.1 percent in 2018, up 1.1 percentage points compared with 2000 (see FIGURE 8). It increased in all regions, with the larger gains located in Asia as described above. The higher levels in Asia compared to the rest of the world are partly attributable to the prevalence of irrigation-intensive rice cultivation in the region. As seen in TABLE 6, Egypt stands out as the country with the highest share of equipped area for irrigation (99.7 percent in 2018), as the agricultural land is concentrated in the Nile valley and delta.4 Countries with low shares are more dependent on rainfed agriculture, which is affected by changing rain patterns and tends to be more extensive than irrigated agriculture. On the other hand, irrigated agriculture competes with other uses of the water resources available in countries.

The share of agricultural water withdrawals in total withdrawals is an indication of the relative weight of agricultural water uses compared to the industrial and municipal ones. As seen in FIGURE 9, the countries with the highest shares are located mostly in Africa and Asia, with the share of Somalia above 99 percent. One trait shared by most of these countries is the income level: out of the top 20 countries, the World Bank classifies seven as low-income and ten as lower-middle income while only three belong to the upper-middle income group.5

The number of people working in agriculture worldwide, including forestry and fishing, went down 16 percent in the 2000–2019 period, reaching 884 million in 2019, or 164 million less than in 2000 (see FIGURE 10). Agricultural employment has declined from approximately 800 million people to 600 million in Asia: this means that nearly one out of every four agricultural workers has left the sector for another job outside agriculture in the region. Between 2000 and 2019, the biggest drop was observed in Europe, as the agricultural population there has decreased by 47 percent from about 35 million, which represents a decrease of 16 million people. During the same period, even if the share of employment in agriculture declined in Africa (see FIGURE 11), agricultural employment increased to approximately 225 million people there. With around 200 million people working in each of China and India in agriculture, together they account for two-thirds of agricultural employment in Asia and 44 percent of global agricultural employment – even though 25 million people left the agriculture sector between 2000 and 2019 in India and 169 million in China (see TABLE 8).

The share of employment in agriculture, forestry and fishing declined globally by about 13 percentage points between 2000 and 2019, to 26.8 percent (see FIGURE 11). Yet, agriculture remains the second largest source of employment worldwide after the services sector.6 A decline in the share of the agricultural sector is usually linked to growing income levels, which explains the drop in the share of employment in agriculture across all regions and nearly all the countries. The lowest share of employment in agriculture was observed in Europe in 2019, where only 5.3 percent of the employed population had a job in agriculture. The highest share was observed in Africa with 49 percent of the total employed population.

FIGURE 12 shows the 20 countries with the highest shares of women in agricultural employment. While on average women represented 37.1 percent of all agricultural workers in 2019, this share is above 50 percent in 22 countries (see TABLE 10), most of them in Africa. Women and men working in agriculture might have different employment status. Generally, the women employed in agriculture are more likely to be engaged as contributing family workers whereas men are more likely to be engaged on their own account as workers generating an income.7 In addition, women often spend more time than men on activities such as food processing and food preparation for the household, child and elder care, water and fuel collection and other unpaid household duties.8

Capital in the agriculture sector includes the machinery, equipment and tools as well as the farm buildings, and is essential in the production of all agricultural outputs. The Gross Fixed Capital Formation (GFCF) is an indication of the amounts that are reinvested in new fixed assets that are part of capital.
High-income countries tend to devote a higher share of their agriculture value added to reinvestments in the sector than countries with lower levels of income (see FIGURE 13). The three countries with the higher share of GFCF in value added in 2017 are all in Europe: Latvia (53 percent), Lithuania and Austria (47 percent each). Australia, Japan and the United States of America were the leaders of their respective regions, each with a share of 29–31 percent in 2017, while the share of South Africa – the leader for Africa – was 21 percent.

Government spending on agriculture is a measure of the public financial support to the sector and complements investments made by the private sector. Asia and Africa had the highest percentage of central government spending to agriculture between 2000 and 2018.9 FIGURE 14 reflects this, as most of the countries with the highest shares are in these two regions, with Malawi (16 percent), Bhutan (12.8 percent), and Guyana (9.7 percent) as the top three countries. In the case of Africa, signatories to the Malabo Declaration of 2014 committed to allocate at least 10 percent of government expenditures to agriculture.10

Global pesticides use increased during the period 2000–2018 by about one-third, to 4.1 million tonnes in 2018 (see FIGURE 15). Nearly all the increase took place between 2000 and 2012, with a plateau afterwards. The highest contributions came from Asia, followed by the Americas, Europe, Oceania and Africa. The regional contributions to the world total changed slightly over time, but Asia, the largest contributor, remained stable at 52–53 percent. The share of the Americas increased from 29 percent to 32 percent of global pesticides consumption while that of Europe decreased slightly from 14 percent to 12 percent. Oceania and Africa applied small amounts of pesticides over time, but Oceania nonetheless had the highest growth in pesticides applications. As shown in TABLE 13, China was the largest pesticide user in 2018 with 1.8 million tonnes, or 43 percent of the world total, far ahead of the United States of America and Brazil (0.4 million tonnes each).

Global pesticides use per cropland area went up 28 percent in the 2000s, from 2.1 kg/ha to 2.6 kg/ha, and levelled out after 2010 (see FIGURE 16), although with some important regional differences. Pesticides application rates in 2018 were highest in Asia, followed by the Americas, Oceania, Europe and Africa. In the 2010s, Oceania surpassed Europe, but both regions remained below the global average. Asia and Africa were the only two regions where pesticides use per cropland area did not increase between 2010 and 2018. The top three countries in terms of pesticides application rate for 2018 were Mauritius, with 28 kg/ha, Ecuador, with 25.8 kg/ha, and Trinidad and Tobago, with 24.9 kg/ha (see TABLE 14).

Total agricultural use of chemical fertilizers, expressed as the sum of the three nutrients nitrogen (N), phosphorus (expressed as P2O5) and potassium (expressed as K2O), was 188 million tonnes in 2018. As shown in FIGURE 17, the breakdown was 109 million tonnes of nitrogen (58 percent of the total), 41 million tonnes of phosphorus (22 percent) and 39 million tonnes of potassium (21 percent). The overall fertilizer use in 2018 was 53 million tonnes, or 40 percent higher than in 2000 (35 percent higher for nitrogen, 26 percent higher for phosphorus, and 80 percent higher for potassium).


Asia represented 55 percent of world total agricultural use of chemical fertilizers in 2018, followed by the Americas (27 percent), Europe (12 percent), Africa (4 percent) and Oceania (2 percent). This ranking of the regions is the same for all nutrients. The main users of chemical fertilizers are China, India, the United States of America and Brazil (see TABLE 15), with China the largest user of any type of fertilizer.
Fertilizer use increased in all regions between 2000 and 2018 (see FIGURE 18). It went up 32 million tonnes – the largest increase in absolute terms – in Asia, or 44 percent. The fastest increase took place in Africa, with a growth of 74 percent equivalent to just 3 million tonnes due to the low starting level. In the Americas, fertilizer use posted a 51 percent increase, or 17 million tonnes, while in Oceania it went up 17 percent (or 0.5 million tonnes) compared to 4 percent in Europe (or 1 million tonnes).

The mix of nutrients varies across the regions. Nitrogen is the dominant nutrient, accounting for more than 60 percent of fertilizer use in Europe (64 percent), Africa (64 percent) and Asia (61 percent), and around half of the total in Oceania (52 percent) and the Americas (48 percent). The use of phosphorus accounts for 17 to 25 percent of the total in all the regions except Oceania, where its share is 35 percent. The share of potassium in fertilizer use is the highest in the Americas with 26 percent, followed by Asia and Europe (19 percent each), Africa and Oceania (13 percent each). The use of phosphorus declined in Europe and Oceania between 2000 and 2018, while the use of potassium declined only in Europe over the same period.
World agricultural use of chemical fertilizers per cropland area rose by 33 percent during the 2000–2018 period, to 121 kg of nutrients per hectare – expressed as the sum of nitrogen, phosphorus and potassium (see FIGURE 19). This corresponds to an additional 30 kg/ha compared with 2000. Of the total amount, 70 kg/ha correspond to nitrogen (up 28 percent), 26 kg/ha to phosphorus (up 19 percent) and 25 kg/ha to potassium (up 68 percent).

Fertilizer use per cropland area in 2018 was the highest in Asia, at 178 kg/ha, followed by the Americas (135 kg/ha), Oceania (83 kg/ha), Europe (77 kg/ha) and Africa (25 kg/ha). With a growth rate of 47 percent between 2000 and 2018, the Americas were the region with the fastest increase in fertilizer use per cropland area, ahead of Africa (+44 percent), Asia (+35 percent) and Europe (+10 percent) – Oceania is the only region showing a decrease (-10 percent).
Total production of primary crops increased by almost 50 percent between 2000 and 2018, to 9.1 billion tonnes in 2018, slightly below the record high of 2017 (see FIGURE 20). This represents 2.9 billion tonnes more than in 2000. With about one-third of the total, cereals were the main group of crops produced in 2018, followed by sugar crops (24 percent) and vegetables (12 percent). Oil crops, fruit, and roots and tubers each accounted for 9 to 11 percent of the total production. The increase in production is mostly attributable to a combination of factors seen in Chapter 1 (increased use of irrigation, pesticides and fertilizers, and to a lesser extent a larger cultivated area); other factors such as better farming practices11 and the use of high-yield crops12 also play a role.

While a large number of crops are cultivated and harvested around the world, just four individual crops accounted for half the global production of primary crops in 2018: sugar cane (21 percent of the total, with 1.9 billion tonnes), maize (13 percent, with 1.1 billion tonnes), rice (9 percent, with 0.8 billion tonnes) and wheat (8 percent, with 0.7 billion tonnes) – see FIGURE 21. Potatoes and soybeans each accounted for an additional 4 percent of world crop production.

Sugar cane accounted for around 20 percent of the global crop production over the 2000–2018 period. This is almost twice the share of maize, which surpassed rice in 2001 to become the second most produced crop worldwide. As seen in TABLE 18, the Americas is the leading region in the production of sugar cane (54 percent of the world total), maize (50 percent) and soybeans (87 percent), while Asia leads in the production of rice (90 percent), wheat (45 percent) and potatoes (51 percent).
FIGURE 22 shows that for each main crop commodity, the top three producers combined account for a significant share of the world total: slightly above 40 percent for wheat and potatoes, around 60 to 65 percent for sugar cane, maize and rice, and 80 percent for soybeans in 2018. For each crop, the top producer also has a sizeable share of the global output: in 2018, Brazil accounted for around 40 percent of world sugar cane production, the United States of America grew around 35 percent of the global production for both maize and soybeans, while China (which ranked in the top three producers for five out of the six main crop commodities) produced about 25 percent of the world output of rice and potatoes, and slightly less than 20 percent of the world output of wheat. Such a concentration can have a large impact on prices when harvests are affected – either positively or negatively – in the main producing countries that export part of their production.

Most primary crops can be consumed unprocessed, but two crop groups in particular require processing for the production of commodities used both as food and fuel: oil crops and sugar crops. Therefore, they have an impact on nutrition and health, but also on energy and the environment.
The total world production of vegetable oils more than doubled between 2000 and 2017, to 191 million tonnes in 2017 (see FIGURE 23). This is 99 million tonnes more than in 2000. Palm oil had the largest increase, both absolute and relative, as its production went up 44 million tonnes, or 197 percent; it overtook soybean oil as the main vegetable oil produced in 2006. The use of palm oil for biodiesel explains most of this spectacular growth.13 The other main vegetable oils are rapeseed oil, accounting for 13 percent of global vegetable oil production in 2017, and sunflower oil, which accounted for 9 percent of total vegetable oil production in 2017, down from 11 percent in 2000.

As with primary crops, the production of the main vegetable oils is heavily concentrated in a handful of countries (see FIGURE 24). Palm oil is striking because close to 85 percent of global production came from two countries in 2017: Indonesia (53 percent) and Malaysia (30 percent). In 2017, the top three producers accounted for 63–65 percent of the production of soybean oil and sunflower oil, and for slightly less than half of the production of rapeseed oil. China was the main producer of soybean oil, with a share of 30 percent in 2017 and the United States of America a distant second with a share of 19 percent. The difference between the first and second producer was much smaller for rapeseed and sunflower oil: Canada led the production of rapeseed oil in 2017, with 16 percent of the world total, just ahead of Germany (16 percent), while Ukraine produced 29 percent of the global sunflower oil production in 2017, with the Russian Federation a close second (26 percent).

The global production of raw sugar reached 182 million tonnes in 2017, up 37 percent compared with 2000, or 49 million tonnes (see FIGURE 25). As sugar cane, the main sugar crop, grows in tropical regions, the main producing countries are located there. The largest producing country is Brazil, which increased its share in the world total from 13 percent in 2000 to 22 percent in 2017. It overtook India in 2003, which accounted for 12 percent of the global production in 2017. The other main producers account for 4 to 6 percent of the total production each, with the Russian Federation relying only on sugar beet for sugar production.

World meat production reached 342 million tonnes in 2018, up 47 percent, or 109 million tonnes compared with 2000 (see FIGURE 26). Although many species are raised for their meat, only three accounted for nearly 90 percent of the global production during the 2000–2018 period: pig, chicken and cattle (not taking into account the different breeds for each). Pig meat represented 35 percent of the total in 2018, which is a small decrease compared to its 38 percent share in 2000. With 33 percent of the global production in 2018, chicken meat showed the largest growth in absolute and relative terms (+95 percent, or 56 million tonnes). The share of cattle meat dropped from 24 percent in 2000 to 20 percent in 2018.

The market concentration of meat production is not as strong as for primary crops and vegetable oils, even though the top three producers accounted for about 60 percent of world pig meat production and slightly more than 40 percent of global chicken and cattle meat production (see FIGURE 27). China and the United States of America are among the three largest producers for each main meat type: in particular, China alone produced 45 percent of world pig meat, and the United States of America produced 17 to 18 percent of world chicken and cattle meat. The difference between the two countries is that meat production in China is mostly for the domestic market, whereas a significant share of American meat production (especially in the case of chicken) is exported.14

World milk production rose by 45 percent to 843 million tonnes in 2018, an increase of 264 million tonnes compared with 2000 (see FIGURE 28). Asia was the largest milk-producing region in 2018 with a 42 percent share of the total, ahead of Europe (27 percent), the Americas (22 percent), Africa (6 percent) and Oceania (4 percent). In particular, milk production in Asia more than doubled between 2000 and 2018, from 169 million tonnes to 354 million tonnes mostly due to the increase in India (108 million tonnes), which is the largest producer with a 22 percent share of the total in 2018. With a 12 percent share, the United States of America was the second largest producer; the other main producers (Pakistan, China, Brazil, the Russian Federation and France) each accounted for 3 to 5 percent of the global production. The combined share of the top three milk producers was 39 percent of the total.


In 2018, world hen eggs production reached 77 million tonnes, a 50 percent increase from the 2000 level, which translates into an additional 26 million tonnes over the period (see FIGURE 29). Asia is by far the main producing region, accounting for 60 percent of the global production in 2018, followed by the Americas (21 percent), Europe (14 percent), Africa (4 percent) and Oceania (0.4 percent). Production growth rates were well above 50 percent in all the regions but Europe, where it grew by just 17 percent (see TABLE 23); as a result, its share in the world total drops from 18 percent to 14 percent. With 35 percent of the total, China ranked as the largest hen egg producing country; the other main producers (the United States of America, India, Mexico, Brazil, Japan, the Russian Federation and Indonesia) combined do not surpass it. Together, the top three producers accounted for half the global hen eggs production in 2018.


Total world fisheries and aquaculture production showed a 42 percent growth in the 2000–2018 period, reaching an all- time record of 179 million tonnes in 2018. This represents an overall expansion of 53 million tonnes compared to 2000. The total first sale value of the 2018 production is estimated at USD 401 billion.15 A large number of species are harvested every year, with the quantities and specific species varying from country to country. Finfish (freshwater, diadromous and marine fish) had a share of 77 percent of the total in 2018, with a slight decline compared to 79 percent in 2000. With 41 percent of the total, marine fish were the main group of species produced in 2018, followed by freshwater fish (32 percent), molluscs (13 percent) and crustaceans (9 percent). Thanks to the expansion of aquaculture production, freshwater fish experienced major growth, more than doubling (+131 percent) between 2000 and 2018, going from about 25 million tonnes in 2000 (20 percent of the total) to 57 million tonnes in 2018. Other major increases were experienced by crustaceans (+103 percent) and diadromous fish (+90 percent).
The significant expansion of the fisheries and aquaculture production came with many transformations, including changes in the source of production being increasingly dependent on aquaculture. In the last three decades, aquaculture has been the main driver of the increase in fisheries and aquaculture production, with an average growth of 5.3 percent per year in the period 2000–2018, reaching a record 82.1 million tonnes in 2018. At the global level, after several decades of sustained growth, capture fisheries production has been rather stable at around 90 million tonnes since the early 1990s, with some inter-annual fluctuations in the range of 3 to 6 million tonnes. These fluctuations have been mainly determined by variations in catches of anchoveta in South America, particulary affected by climatic change variability, but they also depended on the productivity of ecosystems, fishing intensity management and fish stock status (see Box 3). In 2018, capture fisheries production peaked at 96.4 million tonnes, representing 54 percent of total production. If aquatic plants are also included, aquaculture became in 2013 the main source of fishery and aquaculture production, with a share of 54 percent of the total in 2018.16


As seen in TABLE 25, Asia played a major role in the overall growth of fisheries and aquaculture production and represented about 70 percent of total production in 2018 compared to 57 percent in 2000. In 2018, the Americas had a share of 14 percent, followed by Europe (10 percent), Africa (7 percent) and Oceania (1 percent). China is by far the main producer for both capture fisheries and aquaculture, with a 36 percent share of the total production in 2018, compared with 30 percent in 2000. In 2018, other major producers were Indonesia and India, and these three countries together represented just under 50 percent of total fisheries and aquaculture production. These three countries were also the dominant producers for aquaculture, while for capture fisheries China and Indonesia were followed by Peru in 2018. The overall share of the top three producers was 73 percent of aquaculture and 31 percent of capture fisheries in 2018. Despite this concentration of production, aquaculture has experienced growth across the world, with the unequal rates reflecting differences in local policy, management objectives, site opportunities and environmental factors.
Global production of roundwood rose from 3.5 billion m³ in 2000 to slightly more than 4 billion m³ in 2018, which represents a 15 percent increase over the period (see FIGURE 33). In 2018, wood fuel was the main product with a 49 percent share of the total (1.9 billion m³), followed by coniferous industrial roundwood with 30 percent (1.2 billion m³) and non-coniferous industrial roundwood with 22 percent (0.9 billion m³). In particular, the rebound was quite strong after the decline in coniferous industrial roundwood production in 2009, which resulted in the lowest total roundwood production during the 2000–2018 period. As seen in TABLE 26, Asia and the Americas are the two main producing regions, accounting each for 29 percent of the total roundwood production; Africa and Europe have similar shares of roughly 20 percent, while Oceania represents the remaining 2 percent.

The share of the combined three main producers of roundwood commodities in 2018 was roughly 30 percent for wood fuel, 40 percent for non-coniferous industrial roundwood and 50 percent for coniferous industrial roundwood (see FIGURE 34).

As many developing countries rely on wood for energy purposes (notably cooking), the larger producers are all in this category: in 2018, India ranked first with 303 million m³ (16 percent of total production), followed by China with 163 million m³ and Brazil with 123 million m³ (respectively 8 percent and 6 percent of global production). TABLE 26 shows that five African countries are included in the top 10: Ethiopia, the Democratic Republic of the Congo, Nigeria, Ghana and Uganda.
The main industrial roundwood producers are all countries with a large forest area and an established logging industry. In the case of coniferous industrial roundwood, the top producers in 2018 were the United States of America, with a production of 295 million m³ (25 percent of the total production), followed by the Russian Federation with 175 million m³ (15 percent) and Canada with 128 million m³ (11 percent). China led the production of non-coniferous industrial roundwood in 2018, with 152 million m³ (17 percent of the global production), followed by Brazil (114 million m³, or 13 percent) and the United States of America (98 million m³, or 11 percent).
FIGURE 35 shows the production of the main products derived from wood. The year 2018 saw a decrease in production of paper and paperboard, at 408 million tonnes, with a decrease of 1.6 percent over the 2017 production. The same is true for recovered paper, with a production of 229 million tonnes in 2018 (-1.9 percent over the 2017 production). Over the 2000–2018 period though, the two products show a production increase of 26 percent (paper and paperboard) and 60 percent (recovered paper). Wood pulp and wood charcoal reached their highest values ever in 2018 with 192 million tonnes and 53 million tonnes respectively, up 12 percent for wood pulp and 45 percent for wood charcoal compared to the 2000 amounts. Wood pellets and other agglomerates, for which data collection was started in 2012, show a steady growth with a production record of 43 million tonnes in 2018, an increase of 83 percent since the 23 million tonnes produced in 2012. World production of sawnwood recovered strongly from its low point of 2009 and reached its highest level ever in 2018 with 492 million m³, an increase of 28 percent compared with 2000. The production of wood-based panels has plateaued since 2016, with the 404 million m³ produced in 2018 representing a 127 percent increase from the 2000 production.


The monetary value of global food exports multiplied by 3.6 in nominal terms between 2000 and 2018, from about USD 380 billion in 2000 to slightly less than USD 1.4 trillion in 2018, with strong increases in all food commodity groups (see FIGURE 36). Fruit and vegetables accounted for 23 percent of the total value of food exports in 2018, followed by cereals and preparations (14 percent). Fish and meat each had a share of 11 percent. As seen in TABLE 28, the United States of America was the largest food exporter in 2018 with 9 percent of the total, followed by the Netherlands and China (6 percent each).

Looking at the food net trade, defined as the nominal value of exports minus that of imports, two regions stand out: the Americas as the largest net exporter with a USD 104 billion surplus in 2018, and Asia as the largest net importer, posting a USD 181 billion deficit in 2018 (see FIGURE 37). Oceania remained a net exporter of food during the 2000–2018 period and Africa a net importer. Europe was a net importer of food during most of the period, but became a net exporter in 2013. As seen in TABLE 29, the largest net exporting countries in 2018 are Brazil (+USD 62 billion), the Netherlands (+USD 22 billion) and Thailand and New Zealand (+USD 20 billion each). Looking at TABLE 28, Brazil derives a large share of its food exports from fruit and vegetables and meat, the Netherlands from fruit and vegetables, Thailand from cereals and preparations and New Zealand from dairy and eggs. The largest net importing countries are China (-USD 75 billion), Japan (-USD 54 billion) and the United Kingdom of Great Britain and Northern Ireland (-USD 28 billion). TABLE 30 shows that fruit and vegetables account for the larger share of both China and the United Kingdom of Great Britain and Northern Ireland’s food imports, while fish is Japan’s main food import.

Trade flows vary considerably between regions and commodity groups (see FIGURE 38). The largest individual flows are observed for fruit and vegetables, with Europe importing USD 140 billion and the Americas exporting USD 132 billion in 2018. Asia was the top importing region for cereals and preparations, fats and oils, and sugar and honey; for beverages, dairy and eggs, fish, fruit and vegetables, and meat, the main importer was Europe. For all commodity groups but three, Europe was the main exporter; the Americas led for fruit and vegetables, and Asia for fats and oils and fish. Fruit and vegetables are the commodity group with the largest net trade amounts: Asia’s trade deficit was USD 58 billion, while the Americas’ surplus was USD 67 billion. In 2018, Africa and Asia were net importers of all commodity groups but two (fish and fruit and vegetables for Africa, fish and fats and oils for Asia). Oceania was a net exporter of all commodity groups in 2018. The Americas and Europe were net exporters of most groups, but each had significant net imports in one category: the Americas had a deficit of USD 17 billion for beverages and Europe had one of USD 41 billion for fruit and vegetables.

Looking at the quantities instead of the values traded gives a vastly different picture. In that case, cereals are by a wide margin the most traded commodity group, with exports reaching a historical peak at 481 million tonnes in 2018 (see FIGURE 39). This is 207 million tonnes, or 76 percent more than in 2000. Three crops accounted for 86 percent of all exports in 2018: wheat (40 percent), maize (36 percent) and rice (10 percent). The relative shares of wheat and rice have barely changed between 2000 and 2017, and that of maize increased by 6 percentage points.

For each of the main traded cereals, exports tend to originate from a few countries while imports are more dispersed (see FIGURE 40).17 In 2018, the top three exporters accounted for significant shares of the total exports: 47 percent for wheat, 67 percent for maize and 61 percent for rice. In comparison, the top three importers accounted for 15 to 25 percent of the total imports for these commodities. The main producers tend to also feature among the main exporters. China stands out as a major producing country focusing on domestic demand since its exports are fairly small compared to its production (see TABLES 20 and 32); it is also the main importer of rice.

The nominal value of global forest products exports peaked at USD 269 billion in 2018, up USD 124 billion or 86 percent compared with 2000 (see FIGURE 41). All the main products rebounded after their sharp drop in 2009. With 39 percent of the total value, paper and paperboard was the most traded commodity in 2018, even though its share steadily declined from 48 percent in 2000. Together with pulp for paper and recovered paper, it accounts for 58 percent of the total. Pulp for paper, sawnwood and wood-based panels each represented 13 to 16 percent of the value of forestry exports in 2018, with small changes compared to their 2000 shares.

The Food and Agriculture Organization of the United Nations (FAO) Food Price Index, which measures the monthly change in international prices of a basket of food commodities, consists of the average of five commodity group price indices (cereals, dairy, meat, oils and sugar), weighted with the average export shares of each of the groups for 2014–2016. Since January 2000, it went up 43.5 points to 96.1 points in August 2020 (see FIGURE 42). The FAO Food Price Index surged in 2007/2008 during the food security crisis that saw the price of cereals reach record levels, especially rice and wheat. Food prices soared again in late 2010 and early 2011 (especially sugar and dairy). Overall, the period of sustained high prices lasted much longer than in the previous commodity price booms and busts with the return to the pre-surge price levels only five years later, in January 2016. The FAO Food Price Index declined during the early phase of the COVID-19 pandemic reflecting uncertainties faced by commodity markets. However, it increased for three months in a row between June and August 2020 to its highest value since February 2020.

An important factor to note is that the overall trend of the FAO Food Price Index can mask a wide discrepancy of movements across sectors, as shown in FIGURE 43. The market fundamentals of supply and demand, as well as exchange rates dynamics, drive the evolution of international prices. The indices for vegetable oils and sugar show great volatility since the beginning of 2017, with most recently a sharp drop during the first months of 2020 as the COVID-19 pandemic disrupted international food markets. In contrast, the indices for dairy, cereals and oils appear less volatile.

The FAO Fish Price Index measures the monthly changes in international prices of a basket of fisheries and aquaculture commodities. The index consists of the average of five commodity group price indices (whitefish, salmon, tuna, other pelagic fish and shrimps) weighted by the average export shares of each of the groups for the 2014–2016 period. Since January 2000, it went up from 65.9 to 91.1 points in May 2020. It showed several fluctuations during the overall period with higher prices experienced in 2008, 2011, 2013, 2014 and from 2016 to early 2019 (see FIGURE 44). Alternatively, the index dropped in 2012, 2015 and early 2020. Being an average, it masks wide differences among species and across the aquaculture and capture fisheries sector, in addition to the dynamics of supply and demand and exchange rates. For example, tunas, which rely almost entirely on capture fisheries, showed more price fluctuations than shrimps, which are increasingly sourced from aquaculture. Since the beginning of 2020, the price indices of all commodity groups are on a downward trend except tunas, which experienced increases on a month-by-month basis.

Looking at the country level, changes in domestic prices received by agricultural producers varied between +63 percent (in the Islamic Republic of Iran) and 30 percent (in Zambia) in 2018 compared with 2017 (see FIGURE 45). The largest fluctuations, either up or down, often took place in Asia and Africa. Many factors can affect producer prices, including favourable or poor harvests compared to the previous year, production costs, market structure, subsidy schemes and external factors – as is the case, for instance, of economic sanctions against the Islamic Republic of Iran in 2018. The characteristics of the food supply chain (including the transformation of goods and the incorporation of services along the chain) play a key role in shaping the transmission of price shocks between producers and consumers. They can explain different rates of change in producer prices compared to consumer prices.

Consumer prices for food increased unevenly across regions between 2014 and 2020 (see FIGURE 46). While the world average fluctuated between 1.5 percent and 3.5 percent between January 2014 and the second half of 2018, it increased steadily since the beginning of 2019 to peak at 6.9 percent in May 2020. Africa experienced the highest inflation rate in food prices during the period, reaching a peak at 18.9 percent in April 2014 and staying above 10 percent since April 2016. Asia had the second highest inflation rate in food prices for most of the period, with a strong increase from 3.7 percent in December 2018 to 8.1 percent in May 2020. Inflation rates in food prices had been negative for several months in a row in the Americas in 2017 and Oceania in 2018, but have since increased to their highest value in May 2020: 8.9 percent for Oceania and 7.6 percent for the Americas. In contrast, the increase in consumer prices for food has remained around 2 percent since the first half of 2017 in Europe.

The global level of the prevalence of undernourishment (PoU) has been increasing since 2014, after a decades-long decline (see FIGURE 47). Nearly 9 percent of the world population suffered from hunger in 2019. The situation is most alarming in Africa, where the PoU is the highest among all regions and has shown a steady increase since 2014. By 2019, almost 20 percent of the population in Africa were undernourished. The PoU in Latin America and the Caribbean, as well as in Oceania, has also shown a slight increase since 2014. In Asia, the PoU has been mostly declining since 2002, although it remains the second highest among all regions (8.3 percent in 2019).

Almost 690 million people in the world were still hungry in 2019 (see FIGURE 48). This is 121 million people, or 15 percent less than in 2000. Even though its PoU is the second highest, Asia is home to 55 percent of the world’s hungry people due to its large population base, and the two countries with the largest number of hungry people are in Asia (see TABLE 38). However, the number of hungry people in Asia declined by 29 percent, or 154 million, between 2000 and 2019. In Latin America and the Caribbean, 48 million people were undernourished in 2019, a 17 percent decrease compared with 2000 equivalent to 10 million people. By contrast, the hungry population increased by 51 million, or 26 percent, between 2000 and 2019 in Africa, to 250 million. It also increased by 26 percent in Oceania, where an additional 0.5 million people became undernourished during the 2000–2019 period.

In 2019, 9.7 percent of the world population (746 million people) were exposed to severe food insecurity based on the Food Insecurity Experience Scale (FIES) (see FIGURE 49). This number and the levels over the 2014–2019 period are broadly consistent with those of the PoU, confirming that these two indicators complement each other as they both measure the extent of severe food deprivation. As one of the official Sustainable Development Goal (SDG) indicators, the prevalence of moderate or severe food insecurity provides additional information on people who do not have regular access to nutritious and sufficient food, even if they are not necessarily suffering from hunger. In 2019, it is estimated that an additional 16.2 percent of the world population, or 1.3 billion people, have experienced food insecurity at moderate levels. This brings the total estimates for moderate or severe food insecurity in 2019 to 25.9 percent of the world population, or 2 billion people. Moderate or severe food insecurity is much higher in Africa than in any other part of the world, affecting more than half the population in 2019. This is followed by Latin America (32 percent), Asia (22 percent), Oceania (14 percent) and Northern America and Europe (8 percent).

The Food Insecurity Experience Scale (FIES) data collected by FAO in more than 140 countries over six years at the individual (rather than household) level provide a unique opportunity to produce gender-disaggregated estimates for the prevalence of food insecurity. In every region, the prevalence of moderate or severe food insecurity is slightly higher in adult women than in adult men, with the largest differences found in Latin America. Differences are statistically significant.18

The world average dietary energy supply (DES), measured as calories per capita per day, has been increasing steadily, to around 2 870 kcal per person per day over the period from 2017 to 2019, up 7 percent compared with 2000 to 2002 (see FIGURE 50). It is the highest in Northern America and Europe, at about 3 500 kcal per person per day; the gap with Oceania and Latin America and the Caribbean, slightly above 3 000 kcal per person per day, is substantial. While the lowest among all regions, Africa has also witnessed a steady increase in DES followed by a slight decline in recent years, probably due to the drought in 2016 and political conflicts in some countries that adversely affected agricultural production.19

Given the importance of cereals as staple foods worldwide (see FIGURE 52) and the discrepancy between consumption and production in many countries, a measure of food security is the cereals imports dependency ratio, defined as the net trade of cereals (imports minus exports) divided by the total cereals supply in a country (the country’s own production plus the imports minus the exports). Among the most cereals import-dependent countries in the period from 2015 to 2017, the majority are small island developing states20 and countries in the Near East, where the natural conditions are not favourable to cereals production (see FIGURE 51).

The composition of the dietary energy supply, detailed in food balance sheets,21 varies greatly between the regions, with notable evolutions between 2000 and 2017 (see FIGURE 52). Cereals were the most important contributor to the dietary energy supply in all regions, with shares in 2017 ranging from 25 percent in Oceania to around 50 percent in Asia and Africa. Fats and oils is the second major food group in all the regions but Africa. Regional specificities include the high share of roots, tubers and pulses in Africa, of sugar in the Americas, and of fats and oils in Oceania. Between 2000 and 2017, the most visible changes in the composition of the food supply took place in Asia (where the share of cereals dropped by 6 percentage points while that of fats and oils, meat, fruit and vegetables, and dairy and eggs increased significantly).

The average protein supply increased in all regions between 2000 and 2017 (see FIGURE 53). The growth in developing regions was as fast or faster than the world average of 10 percent: 15 percent in Asia, 13 percent in Africa, 10 percent in Latin America and the Caribbean. The share of protein from animal origin went up across all regions as well (as a consequence of the increased share of meat, fish, and dairy and eggs in diets observed in FIGURE 52): it is highest in Oceania and lowest in Africa. Strong disparities also prevail between regions in terms of levels and composition. Protein supply was highest in Northern America and Europe in 2015−17, with 105 g per person per day compared with 61 g per person per day for Africa – the primary reason for this is the difference in the availability of protein from animal-sourced foods. In 2015−17, plants were the main source of protein in Africa (78 percent) and Asia (66 percent), but accounted for 49 percent in Latin America and the Caribbean, 41 percent in Northern America and Europe, and 36 percent in Oceania.

The average dietary supply adequacy has been increasing steadily since the early 2000s in every region, with Northern America and Europe being the highest and Africa being the lowest. In recent years, the average dietary supply adequacy in Africa remained unchanged or decreased because of the declining dietary energy supply in the region (see FIGURE 50).

Dietary supply adequacy divides a country’s average supply of calories for food consumption by the average dietary energy requirement estimated for its population, to measure the adequacy of food supply in terms of calories. Analysed together with the prevalence of undernourishment, it helps identify the cause of undernourishment as mainly due to insufficient food supply or to particularly bad distribution.
The prevalence of stunting among children under five years (as well as the number of stunted children) decreased worldwide from 32 percent in 2000 to 21 percent in 2019 (see FIGURE 55). The decrease took place in all developing regions, with the largest drop in Asia, from 38 percent in 2000 to 22 percent in 2019. However, this global progress may have disguised a starker situation in some parts of the world. As seen in TABLE 45, the prevalence of child stunting is still extremely high in some countries, sometimes reaching more than 50 percent. A majority of the countries with a high prevalence of stunting are in Sub-Saharan Africa.

Obesity among adults of 18 years and above increased rapidly in every region of the world between 2000 and 2016 (see FIGURE 56). In 2016, 13.1 percent of the adult population in the world was obese, an increase from 8.7 percent in 2000. Oceania and Northern America and Europe had the highest prevalence of adult obesity (both at around 27–28 percent), followed by Latin America and the Caribbean. The prevalence of adult obesity in Africa and Asia was lower than the world average, although it has been steadily increasing.

The 20 countries with the highest prevalence of obesity among adults in 2016 were clustered in the Pacific Islands, the Near East and North Africa (see FIGURE 57). In all of them, 30 percent or more of the population is obese, with the highest proportion in Nauru at 61 percent. For many of these countries, multiple forms of malnutrition coexist: in Egypt, for example, the prevalence of child stunting was as high as 22.3 percent in 2014 (see TABLE 45), while the prevalence of adult obesity was 32 percent in 2016 (see TABLE 46).

FIGURE 58 shows that the global shares of the three different types of land (agricultural, forest and other) in total land area remained relatively stable from 2000 to 2018 with slight reductions in agricultural land and forest land shares. With 46 percent, Europe has the largest share of forest land, closely followed by the Americas (41 percent), while the other regions are all around 20 percent. More than half of all land (54 percent) in Asia is agricultural land, compared with 45 percent in Oceania, 38 percent in Africa, 30 percent in the Americas and 21 percent in Europe. The conversion of land from one use to another also varied between the regions. Oceania had agricultural land converted to other land. Both Africa and the Americas converted forest land to agricultural land and/or other land. Europe and Asia were the only regions to have forest land expansion coupled with agricultural land reduction from 2000 to 2018.

Countries with the highest share of forest area in land area are located in all regions of the world, mostly the tropical ones; they also tend to be developing countries (see FIGURE 59). Forest covered 98 percent of the land area in Suriname, 94 percent in Guyana and 92 percent in the Federated States of Micronesia. The biggest increases in the share of forest area between 2000 and 2018 took place in Viet Nam (+9 percentage points), Cuba (+9 percentage points) and Fiji (+7 percentage points), while the largest decreases in the share of forest area over the same period happened in Paraguay (-16 percentage points), Nicaragua (-15 percentage points) and Cambodia (-14 percentage points), as featured in TABLE 48. In absolute terms, the top country for afforestation was China, with an additional 39 million ha of forest between 2000 and 2018; deforestation was the strongest in Brazil as 52 million ha of forest were lost there in the 2000–2018 period (see TABLE 47).

The global harvested area of primary crops went up 20 percent between 2000 and 2018 to 1.4 billion ha (see FIGURE 60). Cereals accounted for more than half the world’s harvested area during the period, even though their share declined to 51 percent in 2018. Oil crops covered 22 percent of the global harvested area and experienced the fastest growth in both absolute (+92 million ha) and relative terms (+41 percent). The other main crop groups each account for less than 5 percent of the global harvested area.

One visible aspect of the efforts to make the agriculture sector more sustainable is the rise of organic agriculture, the main feature of which is its avoidance of chemical fertilizers and pesticides,22 with many environmental benefits. In 2018, the agriculture area under certified organic status or in conversion to organic was 71.1 million ha. Australia accounted for half the total, followed by Argentina (5 percent) and China (4 percent). The eight countries with the largest organic agriculture area made up 74 percent of the global area under certified organic agriculture (see FIGURE 61).

Normalizing the agriculture area under certified organic or in conversion to organic by the country area allows for comparison of the importance that countries give to this aspect of sustainable agriculture. Looking at countries with a sizeable agricultural area in FIGURE 62, the countries with the highest share of area under organic agriculture in total agricultural area for 2018 are Austria (24 percent), Sweden (20 percent) and Italy (16 percent). Fourteen of the top 20 countries are in Europe, highlighting that the region has emphasized the importance of organic agriculture. In other regions, the balance between conventional versus organic farming is still tilted towards the conventional.

Water stress, defined as the share of freshwater withdrawal in available freshwater resources, after taking into account environmental water requirements, affects predominantly Western and Central Asia as well as Northern Africa (see FIGURE 63). The countries experiencing the most acute water stress levels (Kuwait, the United Arab Emirates and Saudi Arabia) are all located in the Arabian peninsula and are withdrawing each year 9 to more than 20 times their renewable freshwater resources. As a result, non-renewable water resources are used and are diminishing rapidly. The national water stress level can hide some differences within a country. Peru is an extreme example of these differences with high water stress in the southern region of the country that is part of the Atacama Desert and much lower water stress in the north-eastern region that is part of the Amazon Forest.23

Both chemical and organic fertilizers are used to provide nutrients to soils worldwide. In the case of nitrogen (the main nutrient), manure complements mineral fertilizers described in Chapter 1, but at a much lower level in all regions. The global average use of organic nitrogen went up 6 percent to 17 kg/ ha between 2000 and 2018, compared to 28 percent for chemical nitrogen, to 70 kg/ ha in 2018 (see FIGURE 64). With 25 kg/ha in 2018, Europe had the highest use of manure per hectare even though it declined slightly from its 2000 level, followed by Asia (20 kg/ ha), the Americas (17 kg/ ha), Oceania (7 kg/ha) and Africa (5 kg/ ha). The ranking, and the order of magnitude, are quite different for chemical nitrogen: Asia is the largest user, with 108 kg/ha, followed by the Americas (65 kg/ ha), Europe (50 kg/ha), Oceania (44 kg/ ha) and Africa (16 kg/ha).


FAO has put forth a methodology for monitoring SDG target 12.3 on food loss reduction.24 Countries will use SDG indicator 12.3.1.a Food Loss Index to measure food losses and identify critical points where losses are high and highly variable. In the absence of nationally collected data, model-based estimates are used to provide a rough baseline to start monitoring the situation. The next step will be to replace modelled estimates with improved data collection.
Figure B2 reports the global food loss percentage for all countries by commodity groups in 2016. The model was based on all available officially reported data from post-harvest up to but excluding the retail level, and on additional information from a literature review. The overall loss percentage for all commodity groups is 13.8 percent globally. The highest losses are found in roots, tubers and oil-bearing crops, followed by fruits and vegetables, which confirms expectations given their highly perishable nature. Results for roots, tubers and oil-bearing crops are mainly driven by cassava and potato losses, where the highest amount of data is reported. In fact, cassava is the most perishable of roots and tubers and can deteriorate within two or three days after harvesting; potatoes, on the other hand, require careful handling and proper storage, especially in the warm and humid climates of many developing countries.

The percentage of stocks fished within biologically sustainable levels is the indicator used to measure progress towards SDG target 14.4. FAO’s latest long-term monitoring of assessed marine fish stocks25 highlighted that the successes achieved in some countries and regions have not been sufficient yet to reverse the global trend of overfished stocks. In places where fisheries management is not in place, or is ineffective, the status of fish stocks is poor and deteriorating. The share of stocks fished at biologically unsustainable levels has been increasing in recent decades, especially in the late 1970s and 1980s, from 27 percent in 2000 to 34 percent in 2017. Conversely, the stocks fished within biologically sustainable levels have declined from 73 percent in 2000 to 66 percent in 2017, of which about 6 percent were underfished. While the underfished stocks have declined constantly from 1974 to 2017, the maximally sustainable fished stock declined from 51 percent in 1974 to 42 percent in 1989, and increased, with some fluctuations, up to 60 percent in 2017. About 79 percent of current marine capture fisheries landings are estimated to come from biologically sustainable stocks.

Agriculture is both affected by climate change and an important contributor to greenhouse gas (GHG) emissions. Crop and livestock activities, together with associated land use, emitted 10.4 billion tonnes of carbon dioxide equivalent (Gt CO2eq) of GHG into the atmosphere in 2017, a decrease of 1 percent, or 0.2 Gt CO2eq compared with 2000 (FIGURE 65). Crop and livestock activities within the farm gate accounted for 5.4 Gt CO2eq, or 52 percent of the total emissions in 2017, followed by net forest conversion/deforestation (2.9 Gt CO2eq, or 28 percent) and peatland degradation (2.1 Gt CO2eq, or 20 percent). Asia was the top agricultural emitter, with 3.3 Gt CO2eq (31 percent of the total) in 2017, followed by the Americas and Africa (3.0 Gt CO2eq, at 28–29 percent each), Europe (0.9 Gt CO2eq, or 9 percent) and Oceania (0.3 Gt CO2eq, or 2 percent). CO2 represents 44 percent of the total emissions, or 4.6 Gt CO2eq; next are methane (CH4) with 3.4 Gt CO2eq (32 percent) and nitrous dioxide (N2O) with 2.5 Gt CO2eq (24 percent).

World agriculture emissions within the farm gate (those related to crops and livestock) grew by 16 percent between 2000 and 2017, to 5.4 Gt CO2eq (see FIGURE 66). Around two-thirds derive from livestock-related activities, and with 2.1 Gt CO2eq, the emissions from enteric fermentation generated in the digestive system of ruminant livestock were alone responsible for about 40 percent of agricultural emissions. Animal and chemical sources of soil fertilization contributed to more than one-third of agricultural emissions. Methane released from the cultivation of rice paddies was responsible for a constant 10 to 11 percent share of agricultural emissions over the 2000–2017 period.

Calculating emissions intensitiesc allows for comparison of the GHG performance of a range of commodities, as they represent an indication of the efficiency of production for each commodity, by country and over time. As seen in FIGURE 67, the most CO2-intensive commodities on average are cattle meat (26 kg CO2eq/kg) and sheep meat (22 kg CO2eq/kg). The intensity of pig and chicken meat is much lower (1.5 kg CO2eq/kg and 0.6 kg CO2eq/kg respectively), in the same range as processed livestock commodities such as cow milk (0.9 kg CO2eq/kg) and hen eggs (0.6 kg CO2eq/kg) or rice (0.9 kg CO2eq/kg). With 0.2 kg CO2eq/kg, cereals excluding rice have the lowest emissions intensity of all major commodities. As seen in TABLE 56, the intensities change significantly across regions, reflecting large differences in associated efficiencies of production. For instance, the emissions intensity of cattle meat is almost twice the world average in Africa (48 kg CO2eq/kg) and nearly half in Europe (14 kg CO2eq/kg).

Worldwide, winters and summers alike are becoming increasingly hotter than the 1951–1980 average (see FIGURE 68). With nearly 1.7 °C more than the reference average for the world, 2016 was the warmest year at the global level; 2019 had the second highest global mean annual temperature change. Europe is the region where the temperature change has been the highest in 2019 (and also for most of the 2000–2019 period), with 2.1 °C, followed by Africa, Oceania and Asia (each around 1.4 °C), and the Americas (1.2 °C). The average temperature change in the current decade (2011 to 2019) was 1.26 °C, compared to 1.01 °C in the previous decade (2001 to 2010). As seen in TABLE 57, more than 150 countries had a mean annual temperature change at least 1.0 °C higher than the 1951–1980 average in 2019; the largest mean annual temperature change was recorded in Poland (2.6 °C).

Statistics are at the core of the work of the Food and Agriculture Organization of the United Nations (FAO), its mandate and strategic goals. Article I of its constitution states that “The Organization shall collect, analyse, interpret and disseminate information relating to nutrition, food and agriculture. […] the term ‘agriculture’ and its derivatives includes forestry, fisheries and aquaculture.”
FAO has a decentralized statistical system, with several technical units carrying out statistical activities. The Statistics Division (ESS) produces a vast array of data on agriculture (covering the socioeconomic, environmental, production, trade, food security and nutrition aspects), which form the majority of FAO statistics – other technical divisions are in charge of data on fisheries and aquaculture, forestry, international commodity prices and water. ESS develops and advocates for the implementation of methodologies and standards for data collection, validation, processing and analysis of food and agriculture statistics. In these statistical domains, it also plays a vital role in the compilation, processing and dissemination of internationally comparable data, and provides essential capacity-building support to member countries. In addition, ESS disseminates documents, working papers and statistical publications that cover agricultural and food security statistics (including prices, production, trade and agri-environmental statistical data). ESS is involved in managing a number of large-scale projects aimed at improving statistical methodologies and establishing best practices for collecting, collating, processing, and for disseminating and using data relevant to food security, agriculture and rural areas.
The Office of Chief Statistician (OCS) is responsible for the overall coordination and governance of FAO’s statistical work, both at headquarters and in FAO’s Regional and Country Offices. OCS provides guidance to the technical units in charge of data acquisition, compilation and dissemination, with the aim of ensuring quality and consistency of statistical practices at the corporate level. It plays a quality assurance role in developing methods and standards for food and agriculture statistics and in providing technical assistance and capacity development to member countries. OCS also leads the Organization’s work to monitor the Sustainable Development Goal (SDG) indicators under FAO custodianship.
The prevalence of obesity in the adult population is the percentage of adults age 18 and over whose Body Mass Index (BMI) is more than 30 kg/m². The BMI is a simple index of weight-for-height, or the weight in kilograms divided by the square of the height in metres.
Source: WHO
Owner: World Health Organization, Global Health Observatory Data Repository/World Health Statistics
Land used for cultivation of crops and animal husbandry. It is the total of areas under “Cropland” and “Permanent meadows and pastures.”
Source: FAO, Statistics Division
Owner: FAO
Annual quantity of self-supplied water withdrawn for irrigation, livestock and aquaculture purposes, including water specifically withdrawn by water supply companies to operate irrigation systems. It can include water from freshwater resources, as well as water from over-abstraction of renewable groundwater or withdrawal from fossil groundwater, direct use of agricultural drainage water, direct use of (treated) wastewater and desalinated water. Water for the dairy and meat industries and industrial processing of harvested agricultural products is included under industrial water withdrawal.
Source: FAO, Land and Water Division (AQUASTAT)
Owner: FAO
Sum of areas under “Agriculture area certified organic” and “Agriculture area in conversion to organic.” Agriculture area certified organic is the land area exclusively dedicated to organic agriculture and managed by applying organic agriculture methods. It refers to the land area fully converted to organic agriculture. It is the portion of land area (including arable lands, pastures or wild areas) managed (cultivated) or wild harvested in accordance with specific organic standards or technical regulations, which has been inspected and approved by a certification body. Agriculture area in conversion to organic is the land area that is going through the organic conversion process, usually a two-year period of conversion to organic land.
Source: FAO, Statistics Division
Owner: FAO
Agriculture, forestry and fishing (AFF) refers to the broad agricultural sector including crop growing and animal production, forestry and logging, and fishing and aquaculture. These sub-sectors correspond to Section A of the International Standard Industrial Classification (ISIC), revision 4 and are covered in its Divisions 1, 2 and 3. To distinguish the agricultural sector (crop and livestock in Division 1 of ISIC), the broad agricultural sector is abbreviated as AFF.
Source: United Nations Statistics Division
Owner: UN
This is the total value added in AFF. The value added is the net output of a sector after adding up the value of all outputs and subtracting intermediate inputs. It is calculated without making deductions for depreciation of fabricated assets or depletion and degradation of natural resources. ISIC, revision 3 or 4, determines the origin of value added. Agriculture here refers to the broad agricultural sector (AFF).
Source: World Bank
Owner: World Bank
Animal oils and fats include animal fats that are obtained in the course of dressing the carcasses of slaughtered animals (slaughter fats), or at a later stage in the butchering process when meat is being prepared for final consumption (butcher fats).
Source: FAO, Statistics Division
Owner: FAO
Aquaculture fish production is defined as the farming of aquatic organisms. Farming implies some form of intervention in the rearing process to enhance production, such as regular stocking, feeding, protection from predators, etc. Farming also implies individual or corporate ownership of the stock being cultivated. For statistical purposes, aquatic organisms, which are harvested by an individual or corporate body that has owned them throughout their rearing period, contribute to aquaculture, while aquatic organisms, which are exploitable by the public as a common property resource, with or without appropriate licences, are the harvest of fisheries. In the case of capture-based aquaculture, only the incremental growth (or weight gain) in captivity, could and should be reported as the production from aquaculture. Data included here cover aquaculture production of fish, molluscs, crustaceans and miscellaneous aquatic animals but exclude the production of marine mammals, crocodiles, corals, pearls, sponges and aquatic plants. Fish production is the sum of aquaculture and capture fish production. Data are expressed in live weight equivalent.
Source: Fisheries Division (Fishery and Aquaculture statistics)
Owner: FAO
Arable land is the total of areas under temporary crops, temporary meadows and pastures, and land with temporary fallow. Arable land does not include land that is potentially cultivable but is not normally cultivated.
Source: FAO, Statistics Division
Owner: FAO
Area harvested refers to the area from which a crop is gathered. It excludes, therefore, the area from which, although sown or planted, there was no harvest due to damage, failure, etc. It is usually net of temporary crops and sometimes gross of permanent crops. The net area differs from the gross area insofar as the latter includes uncultivated patches, footpaths, ditches, headlands, shoulders, shelterbelts, etc. If the crop under consideration is harvested more than once during the year as a consequence of successive cropping (i.e. the same crop is sown or planted more than once in the same field during the year), the area is counted as many times as harvested.
Source: FAO, Statistics Division
Owner: FAO
Hunting, collecting and gathering activities directed at removing or collecting live wild aquatic organisms are capture fish production. The capture production statistics here indicates the nominal catches of aquatic organisms, killed, caught, trapped or collected for all commercial, industrial, recreational and subsistence purposes or other utilizations in live weight equivalent. Data included here cover capture production of fish, molluscs, crustaceans and miscellaneous aquatic animals but exclude production of marine mammals, crocodiles, corals, pearls, sponges and aquatic plants. Fish production is the sum of aquaculture and capture fish production.
Source: Fisheries Division (Fishery and Aquaculture statistics)
Owner: FAO
The cereal import dependency ratio provides a measure of the dependence of a country or region from cereal imports. The higher the value of the indicator, the higher the dependence. Specifically, the cereal imports dependency ratio tells how much of the available domestic food supply of cereals has been imported and how much comes from the country’s own production. It is computed as (cereal imports - cereal exports)/(cereal production + cereal imports - cereal exports) * 100. Given this formula the indicator assumes only values less than or equal to 100. Negative values indicate that the country is a net exporter of cereals. The indicator is calculated in three-year averages, to reduce the impact of possible errors in estimated production and trade, due to the difficulties in properly accounting for stock variations in major foods.
Source: FAO, Statistics Division
Owner: FAO
Wheat, rice paddy, barley, maize, popcorn, rye, oats, millets, sorghum, buckwheat, quinoa, fonio, triticale, canary seed, mixed grain and cereals nes are all considered cereals.
Source: FAO, Statistics Division
Owner: FAO
Cereals, flours and cereal grains that are either rolled, flaked, pearled, sliced or kibbled are cereals and preparations.
Source: FAO, Statistics Division
Owner: FAO
The food consumer price index (CPI) measures the price change between the current and reference periods of the average basket of food items purchased by households. The food CPI is rescaled to a unique base year of 2010 by FAO for all countries with sufficient time coverage. FAO uses the geometric mean of the monthly indices of the year 2010 as the rescaling factor.
Source: IMF, UNSD, OECD and national statistics’ websites
Owner: IMF, UNSD and FAO
Cropland is the land used for cultivation of crops. The total of areas under “Arable land” and “Permanent crops”.
Source: FAO, Statistics Division
Owner: FAO
Crop statistics include permanent and temporary crops and cover the following categories: Crops primary, Fibre crops primary, Cereals, Coarse grain, Citrus fruit, Fruit, Oil crops (oil and cake equivalent), Pulses, Roots and tubers, Treenuts and Vegetables.
Source: FAO, Statistics Division
Owner: FAO
Butter, buttermilk, cheese, cream, ghee, milk, whey and yoghurt are all dairy products.
Source: FAO, Statistics Division
Owner: FAO
The food available for human consumption, expressed in kilocalories per person per day is the dietary energy supply. At the country level, it is calculated as the food remaining for human use after taking out all non-food utilization, including exports, industrial use, animal feed, seed, wastage and changes in stocks.
Source: FAO, Statistics Division
Owner: FAO
The dietary energy supply adequacy average expresses the dietary energy supply (DES) as a percentage of the average dietary energy requirement (ADER). Each country’s or region’s average supply of calories for food consumption is normalized by the average dietary energy requirement estimated for its population to provide an index of adequacy of the food supply in terms of calories.
Source: FAO, Statistics Division
Owner: FAO
The figures for the dietary energy supply average are based on the latest available data from national food balance sheets, and represent the amount of food available for human consumption.
Source: FAO, Statistics Division
Owner: FAO
Egg production by type of poultry should refer to the total production of eggs in the shell by all types of hens in both the traditional sector (individually owned small flocks) and the modern sector (large-scale, intensive commercial poultry farms). Total production includes eggs for hatching but excludes farm waste.
Source: FAO, Statistics Division
Owner: FAO
Greenhouse gas (GHG) emissions from agriculture consist of non-CO2 gases, namely methane (CH4) and nitrous oxide (N2O), produced by crop and livestock production and management activities. Land use includes CO2 emissions by sources and removals by sinks from forest land, cropland and grassland, as well as emissions of non-CO2 from fires of biomass and organic soils.
Source: FAO, Statistics Division and Global Forest Resources Assessments
Owner: FAO
Emissions in agriculture covers all the emissions produced in the different agricultural emissions subdomains (enteric fermentation, manure management, rice cultivation, synthetic fertilizers, manure applied to soils, manure left on pastures, crop residues, cultivation of organic soils, burning of crop residues, burning of savanna, energy use), providing a picture of the contribution to the total amount of GHG emissions from agriculture. GHG emissions from agriculture consist of non-CO2 gases, namely methane (CH4) and nitrous oxide (N2O), produced by crop and livestock production and management activities. The FAOSTAT emissions database is computed following Tier 1 Intergovernmental Panel on Climate Change (IPCC) 2006 Guidelines for National GHG Inventories.
Source: FAO, Statistics Division
Owner: FAO
Emissions in land use covers all GHG emissions and removals produced in the different Land Use subdomains, representing the three IPCC Land Use categories: cropland, forest land, and grassland, collectively called emissions/removals from the Forestry and Other Land Use (FOLU) sector. FOLU emissions consist of CO2 (carbon dioxide), CH4 (methane) and N2O (nitrous oxide) associated with land management activities. CO2 emissions/removals are derived from estimated net carbon stock changes in above- and below-ground biomass pools of forest land, including forest land converted to other land uses. CH4 and N2O, and additional CO2 emissions are estimated for fires and drainage of organic soils. The FAOSTAT emissions database is computed following Tier 1 IPCC 2006 Guidelines for National GHG Inventories
Source: FAO, Statistics Division
Owner: FAO
Emissions in peatland is calculated as emissions (CO2eq) for cropland organic soils + grassland organic soils + burning - biomass organic soils. The FAOSTAT emissions database is computed following Tier 1 IPCC 2006 Guidelines for National GHG Inventories.
Source: FAO, Statistics Division
Owner: FAO
Employment comprises all persons of working age who, during a specified brief period, such as one week or one day, were in the following categories: a) paid employment (whether at work or having a job but not at work); or b) self-employment (whether at work or with an enterprise but not at work). The working-age population is the population above the legal working age, but for statistical purposes it comprises all persons above a specified minimum age threshold for which an inquiry on economic activity is made. To promote international comparability, the working-age population is often defined as all persons aged 15 and older, but this may vary from country to country based on national laws and practices (some countries also use an upper age limit). The classification by economic activity refers to the main activity of the establishment in which a person worked during the reference period. The branch of economic activity of a person does not depend on the specific duties or functions of the person’s job, but rather on the characteristics of the economic unit in which the person worked. Data presented by branch of economic activity is based on ISIC.
Source: ILO estimates, November 2019 (Employment by economic activity)
Owner: ILO
Export values are reported as FOB (free on board: the value of the goods plus the value of the services performed to deliver the goods to the border of the exporting country).
Source: FAO, Statistics Division
Owner: FAO
The use of fertilizers refers to agricultural use of mineral or chemical fertilizers for the three main plant nutrients: nitrogen (N), phosphorus (expressed as P2O5) and potassium (expressed as K2O). It includes both straight fertilizers (those containing only one of the three primary plant nutrients) and compound fertilizers (those containing more than one of the three primary plant nutrients; they may be NP, NK, PK or NPK). Agricultural use refers to the use for crops, livestock, forestry, fisheries and aquaculture, excluding use for animal feed.
Source: FAO, Statistics Division
Owner: FAO
Fish net trade is exports plus re-exports minus imports.
Source: Fisheries Division (Fishery and Aquaculture statistics)
Owner: FAO
The FAO Fish Price Index measures the monthly changes in international prices of a basket of fisheries and aquaculture commodities. The index consists of the average of five commodity group price indices (whitefish, salmon, tuna, other pelagic fish and shrimps) weighted by the average export shares of each of the groups for the 2014–2016 period.
Source: Fisheries Division (Fishery and Aquaculture statistics)
Owner: FAO
Food is comprised of the commodities in the Standard International Trade Classification (SITC) sections 0 (food and live animals), 1 (beverages and tobacco), and 4 (animal and vegetable oils and fats) and SITC division 22 (oil seeds, oil nuts and oil kernels).
Source: FAO, Statistics Division
Owner: FAO
The FAO Food Price Index is a measure of the monthly change in international prices of a basket of food commodities. It consists of the average of five commodity group price indices (meat, dairy, cereals, vegetable oils and sugar), weighted with the average export shares of each of the groups for 2014–16.
Source: FAO, Statistics Division
Owner: FAO
Land spanning more than 0.5 ha with trees higher than 5 metres and a canopy cover of more than 10 percent, or trees able to reach these thresholds in situ. Excludes land that is predominantly under agricultural or urban land use, and land that is predominantly used for maintenance and restoration of environmental function. Explanatory notes:
• Forest land is determined both by the presence of trees and by the absence of other predominant land uses. The trees should be able to reach a minimum height of 5 metres in situ.
• Includes areas with young trees that have not yet reached but that are expected to reach a canopy cover of 10 percent and tree height of 5 metres. It also includes areas that are temporarily unstocked owing to clear-cutting as part of a forest management practice or natural disasters, and that are expected to be regenerated within five years. Local conditions may, in exceptional cases, justify the use of a longer time frame.
• Includes forest roads, firebreaks and other small open areas.
• May include forest land in national parks, nature reserves and other protected areas, such as those of specific environmental, scientific, historical, cultural or spiritual interest.
• Includes windbreaks, shelter belts and corridors of trees with an area of more than 0.5 ha and width of more than 20 metres.
• Includes abandoned shifting cultivation land with a regeneration of trees that have, or are expected to reach, a canopy cover of 10 percent and tree height of 5 metres.
• Includes areas with mangroves in tidal zones, regardless of whether this area is classified as land area or not.
• Includes areas with bamboo and palms provided that land use, height and canopy cover criteria are met.
• Some agroforestry systems such as the taungya system, where crops are grown only during the first years of the forest rotation should be classified as forest.
• Excludes tree stands in agricultural production systems, such as fruit-tree plantations (permanent crops), oil palm plantations, rubber and Christmas trees (permanent crops) and agroforestry systems when crops are grown under tree cover.
Source: FAO, Statistics Division
Owner: FAO
Products of domestic origin or manufacture shipped out of the country are forest product exports. They include exports from free economic zones and re-exports and exclude “in-transit” shipments. They are reported in cubic metres of solid volume or metric tonnes and values are normally recorded as FOB.
Source: FAO, Forestry Division
Owner: FAO
Products imported for domestic consumption or processing shipped into a country are forest product imports. They include imports into free economic zones or for re-export and exclude “in-transit” shipments. They are reported in cubic metres of solid volume or metric tonnes and values normally include cost, insurance and freight (CIF).
Source: FAO, Forestry Division
Owner: FAO
Forest product production includes the production of products that may immediately be consumed in the production of another product (e.g. wood pulp, which may immediately be converted into paper as part of a continuous process). This includes production from all sources within the country including public, private and informal sources. It excludes the production of veneer sheets that are used for plywood production within the same country. It is reported in cubic metres of solid volume in the case of roundwood, sawnwood and wood-based panels and metric tonnes in the case of charcoal, pulp and paper products.
Source: FAO, Forestry Division
Owner: FAO
Vegetables, as classified in this group, are mainly annual plants cultivated as field and garden crops in the open and under glass, and used almost exclusively for food. Vegetables grown principally for animal feed or seed should be excluded. Certain plants, normally classified as cereals and pulses, belong to this group when harvested green, such as green maize, green peas, etc. Chilies and green peppers are included in this grouping when they are harvested for consumption as vegetables and not processed into spices. Trade data for fresh vegetables also include chilled vegetables, meaning the temperature of the products has been reduced to around 0 ˚C without the products being frozen. Fruit crops consist of fruits and berries that, with few exceptions, are characterized by their sweet taste. Nearly all are permanent crops, mainly from trees, bushes and shrubs, as well as vines and palms. Fruit crops are consumed directly as food and are processed into dried fruit, fruit juice, canned fruit, frozen fruit, jam, alcoholic beverages, etc.
Source: FAO, Statistics Division
Owner: FAO
The government expenditure on agriculture refers to core areas of government functions relevant to agriculture, forestry and fishing (AFF) based on the Classification of Functions of Government as outlined in the Government Finance Statistics Manual of the International Monetary Fund (IMF) (2014). Statistics on expenditure in AFF are used to compile the Agriculture Orientation Index.
Source: FAO, Statistics Division
Owner: FAO and IMF
The Gross Fixed Capital Formation is the total value of a producer’s acquisitions, less disposals, of fixed assets during the accounting period plus certain additions to the value of non-produced assets (such as subsoil assets or major improvements in the quantity, quality or productivity of land) realized by the productive activity of institutional units.
Source: UNSD, OECD and national statistics’ websites
Owner: UNSD, OECD and FAO
Import values are reported as CIF (cost insurance and freight: the value of the goods, plus the value of the services performed to deliver goods to the border of the exporting country, plus the value of the services performed to deliver the goods from the border of the exporting country to the border of the importing country).
Source: FAO, Statistics Division
Owner: FAO
All roundwood except wood fuel is industrial roundwood. In production statistics, it is an aggregate comprising sawlogs and veneer logs; pulpwood, round and split; and other industrial roundwood. It is reported in cubic metres solid volume underbark (i.e. excluding bark).
Source: FAO, Forestry Division
Owner: FAO
The inflation rate of an index for any month refers to the percentage change in the index value for the month as compared to the index value of the corresponding month of the previous year. Global and regional food consumer price inflation measures food inflation for a group of countries at different geographical scales: Africa, Europe, Oceania, Latin America and the Caribbean, North America and Asia. Global and regional inflation are calculated using household consumption expenditure weights.
Source: FAO, Statistics Division
Owner: FAO
Country area excluding area under inland waters and coastal waters.
Source: FAO, Statistics Division
Owner: FAO
Land area equipped with irrigation infrastructure and equipment, in working order, to provide water to crops. The equipment does not have to be used during the reference year. The area equipped for irrigation covers areas equipped for fully controlled irrigation by any of the methods of surface, sprinkler or localized irrigation. It also includes areas under partially controlled irrigation methods of spate irrigation (controlling floodwater to water crops), equipped wetlands and inland valley bottoms and equipped flood recession. It excludes manual watering of plants using buckets, watering cans or other devices.
Source: FAO, Statistics Division
Owner: FAO
Land cultivated with long-term crops that do not have to be replanted for several years (such as cocoa and coffee), land under trees and shrubs producing flowers (such as roses and jasmine), and nurseries (except those for forest trees, which should be classified under “Forestry”) are all considered land under permanent crops. Permanent meadows and pastures are excluded from land under permanent crops.
Source: FAO, Statistics Division
Owner: FAO
Land used permanently (five years or more) to grow herbaceous forage crops through cultivation or naturally (wild prairie or grazing land) is considered land under permanent meadows and pastures. Permanent meadows and pastures on which trees and shrubs are grown should be recorded under this heading only if the growing of forage crops is the most important use of the area. Measures may be taken to keep or increase productivity of the land (i.e. use of fertilizers, mowing or systematic grazing by domestic animals.) This class includes:
• grazing in wooded areas (agroforestry areas, for example)
• grazing in shrubby zones (heath, maquis, garigue)
• grassland in the plain or low mountain areas used for grazing: land crossed during transhumance where the animals spend a part of the year (approximately 100 days) without returning to the holding in the evening: mountain and subalpine meadows and similar; and steppes and dry meadows used for pasture.
Source: FAO, Statistics Division
Owner: FAO
Livestock primary production includes products from live and slaughtered animals. Products from slaughtered animals include meat, offals, raw fats, fresh hides and skins. Products from live animals include milk, eggs, honey, beeswax and fibres of animal origin.
Source: FAO, Statistics Division
Owner: FAO
Meat is defined as the flesh of animals (excluding fish) used for food. In production data, meat is normally reported inclusive of bone and exclusive of meat that is unfit for human consumption. As reported by individual countries, meat production data may refer either to commercial production (meat entering marketing channels), inspected production (from animals slaughtered under sanitary inspection), or total production (the total of the above-mentioned categories plus slaughter for personal consumption). All FAO annual production data refer to total production.
Source: FAO, Statistics Division
Owner: FAO
Whole fresh milk production from buffaloes, camels, cows, goats and sheep.
Source: FAO, Statistics Division
Owner: FAO
Net CO2 emissions/removals from forest land consist of net carbon stock change in the living biomass pool (aboveground and belowground) associated with: (i) forest, referring to changes occurred on forest land in the reported year; and (ii) net forest conversion from forest land to other land uses. The FAOSTAT data are computed at Tier 3, with the stock difference method, following IPCC 2006 Vol. 4, Ch. 2 and 4.
Source: FAO, Statistics Division
Owner: FAO
Net CO2 emissions/removals from forest land consist of net carbon stock gain/loss in the living biomass pool (aboveground and belowground biomass) associated with forest and net forest conversion. The FAOSTAT emissions database is computed following Tier 1 IPCC 2006 Guidelines for National GHG Inventories and uses area and carbon stocks data compiled by countries in the FAO Global Forest Resource Assessments.
Source: FAO, Statistics Division
Owner: FAO
Value in USD of exports minus imports.
Source: FAO, Statistics Division
Owner: FAO
Oil-bearing crops or oil crops include both annual (usually called oilseeds) and perennial plants whose seeds, fruits or mesocarp and nuts are valued mainly for the edible or industrial oils that are extracted from them. Oil crops exclude dessert and table nuts, although they are rich in oil, as well as annual oilseed plants that are either harvested green or are used for grazing and for green manure. Some oil crops are also fibre crops in that both the seeds and the fibres are harvested from the same plant (for example coconuts, kapok fruit, seed cotton, linseed and hempseed).
Source: FAO, Statistics Division
Owner: FAO
The paper and paperboard category is an aggregate category. In the production and trade statistics, it represents the sum of graphic papers; sanitary and household papers; packaging materials and other paper and paperboard. It excludes manufactured paper products such as boxes, cartons, books and magazines, etc.
Source: FAO, Forestry Division
Owner: FAO
Insecticides, fungicides, herbicides, disinfectants and any substance or mixture of substances intended for preventing, destroying or controlling any pest, including vectors of human or animal disease, unwanted species of plants or animals causing harm during or otherwise interfering with the production, processing, storage, transport or marketing of food, agricultural commodities, wood and wood products or animal feedstuffs, or substances which may be administered to animals for the control of insects, arachnids or other pests in or on their bodies. The term includes substances intended for use as a plant growth regulator, defoliant, desiccant or agent for thinning fruit or preventing the premature fall of fruit, and substances applied to crops either before or after harvest to protect the commodity from deterioration during storage and transport. Pesticides use data refers to quantities of pesticides applied to crops and seeds in the agricultural sector. Figures are expressed in metric tonnes of active ingredients. However, due to some country reporting practices, the data may be reported by: use in formulated product; sales; distribution or imports for use in the agricultural sector.
Source: FAO, Statistics Division
Owner: FAO
The prevalence of moderate or severe food insecurity is an estimate of the percentage of people in the population who live in households classified as moderately or severely food insecure. The assessment is conducted using data collected with the Food Insecurity Experience Scale (FIES) or a compatible experience-based food security measurement questionnaire (such as the Household Food Security Survey Module – HFSSM). The probability to be food insecure is estimated using the one-parameter logistic Item Response Theory model (the Rasch model) and thresholds for classification are made cross-country comparable by calibrating the metrics obtained in each country against the FIES global reference scale, maintained by FAO. The threshold to classify “moderate or severe” food insecurity corresponds to the severity associated with the item “having to eat less” on the global FIES scale. In simpler terms, a household is classified as moderately or severely food insecure when at least one adult in the household was reported to have been exposed, at times during the year, to low-quality diets and might have been forced to also reduce the quantity of food they would normally eat because of a lack of money or other resources. It is an indicator of a lack of food access.
Source: FAO, Statistics Division
Owner: FAO
The prevalence of severe food insecurity is an estimate of the percentage of people in the population who live in households classified as severely food insecure. The assessment is conducted using data collected with the FIES or a compatible experience-based food security measurement questionnaire (such as the HFSSM). The probability to be food insecure is estimated using the one-parameter logistic Item Response Theory model (the Rasch model) and thresholds for classification are made cross-country comparable by calibrating the metrics obtained in each country against the FIES global reference scale, maintained by FAO. The threshold to classify “severe” food insecurity corresponds to the severity associated with the item “having not eaten for an entire day” on the global FIES scale. In simpler terms, a household is classified as severely food insecure when at least one adult in the household was reported to have been exposed, at times during the year, to several of the most severe experiences described in the FIES questions, such as having been forced to reduce the quantity of the food, having skipped meals, having gone hungry, or having to go for a whole day without eating because of a lack of money or other resources. It is an indicator of lack of food access.
Source: FAO, Statistics Division
Owner: FAO
Expresses the probability that a randomly selected individual from the population consumes an amount of calories that is insufficient to cover their energy requirement for an active and healthy life. The indicator is computed by comparing a probability distribution of habitual daily dietary energy consumption with a threshold level called the minimum dietary energy requirement. Both are based on the notion of an average individual in the reference population.
Source: FAO, Statistics Division
Owner: FAO
Producer prices are prices received by farmers for primary crops, live animals and livestock primary products as collected at the point of initial sale (prices paid at the farm-gate).
Source: FAO, Statistics Division
Owner: FAO
Figures relate to the total domestic production whether inside or outside the agricultural sector, i.e. it includes non-commercial production and production from kitchen gardens. Unless otherwise indicated, production is reported at the farm level for crop and livestock products (i.e. in the case of crops, excluding harvesting losses) and in terms of live weight for fish items (i.e. the actual ex-water weight at time of catch). All data shown relate to total meat production from both commercial and farm slaughter. Data are expressed in terms of dressed carcass weight, excluding offal and slaughter fats. Production of beef and buffalo meat includes veal; mutton and goat meat includes meat from lambs and kids; pig meat includes bacon and ham in fresh equivalent. Poultry meat includes meat from all domestic birds and refers, wherever possible, to ready-to-cook weight.
Source: FAO, Statistics Division
Owner: FAO
Production and crops refer to the actual harvested production from the field or orchard and gardens, excluding harvesting and threshing losses and that part of a crop not harvested for any reason. Production, therefore, includes the quantities of the commodity sold in the market (marketed production) and the quantities consumed or used by the producers (auto-consumption). When the production data available refers to a production period falling into two successive calendar years and it is not possible to allocate the relative production to each of them, it is usual to refer production data to that year into which the bulk of the production falls. Crop production data are recorded in tonnes (t). In many countries, crop production data are obtained as a function of the estimated yield and the total area. If such a compilation method of production statistics is enforced by the country, it must be ensured that the total area does not refer to sown or planted areas, which would then give the biological production, but to the actually harvested area during the year.
Source: FAO, Statistics Division
Owner: FAO
National average protein supply (expressed in grams per capita per day) includes the following groups: meat, offals, animal fats and products, milk and products, eggs, fish, seafood and products, aquatic products and other.
Source: FAO, Statistics Division
Owner: FAO
National average protein supply is expressed in grams per capita per day.
Source: FAO, Statistics Division
Owner: FAO
Waste and scraps of paper or paperboard that have been collected for reuse or trade include paper and paperboard that have been used for their original purposes and residues from paper and paperboard production.
Source: FAO, Forestry Division
Owner: FAO
All roundwood felled or otherwise harvested and removed is comprised of all wood obtained from removals, i.e. the quantities removed from forests and from trees outside the forest, including wood recovered from natural, felling and logging losses during the period, calendar year or forest year. It includes all wood removed with or without bark, including wood removed in its round form, or split, roughly squared or in other form (e.g. branches, roots, stumps and burls, where these are harvested) and wood that is roughly shaped or pointed. It is an aggregate comprising wood fuel, including wood for charcoal and industrial roundwood (wood in the rough). It is reported in cubic metres solid volume underbark (i.e. excluding bark).
Source: FAO, Forestry Division
Owner: FAO
Roots and tubers are plants yielding starchy roots, tubers, rhizomes, corms and stems. The denomination “roots and tubers” excludes crops that are cultivated mainly for feed (mangolds, swedes) or for processing into sugar (sugar beets), and those classified as “roots, bulb and tuberous vegetables” (onions, garlic and beets).
Source: FAO, Statistics Division
Owner: FAO
Wood that has been produced from both domestic and imported roundwood, either by sawing lengthways or by a profile-chipping process and that exceeds 6 mm in thickness is sawnwood.
Source: FAO, Forestry Division
Owner: FAO
Starchy roots include cassava and products, potatoes and products, sweet potatoes and other roots.
Source: FAO, Statistics Division
Owner: FAO
Height-for-age less than -2 standard deviations of the WHO Child Growth Standards median, among children aged 0–59 months.
Source: World Bank
Owner: UNICEF/WHO/The World Bank: Joint child malnutrition estimates
Sugar crops include sugar beet, sugar cane, sugar crops nes.
Source: FAO, Statistics Division
Owner: FAO
The number of people undernourished is obtained by multiplying estimates of the proportion of undernourished for each country by estimates of the total population. Undernourishment refers to the condition of people whose dietary energy consumption is continuously below a minimum dietary energy requirement for maintaining a healthy life and carrying out light physical activity.
Source: FAO, Statistics Division
Owner: FAO
Vegetable oils are the oil equivalent of oil crops, which include seeds, nuts, oil palm fruit, olives and soybeans.
Source: FAO, Statistics Division
Owner: FAO
Water stress is the ratio between total freshwater withdrawn by all major sectors and total renewable freshwater resources, after taking into account environmental water requirements.
Source: FAO, Land and Water Division (AQUASTAT)
Owner: FAO
Wood carbonized by partial combustion or by heat from external sources is wood charcoal. It includes charcoal used as a fuel or for other uses, e.g. as a reduction agent in metallurgy or as an absorption or filtration medium.
Source: FAO, Forestry Division
Owner: FAO
Roundwood that will be used as fuel for purposes such as cooking, heating or power production is wood fuel. This includes wood harvested from main stems, branches and other parts of trees (where these are harvested for fuel) and wood that will be used for the production of charcoal (e.g. in pit kilns and portable ovens), wood pellets and other agglomerates. It also includes wood chips to be used for fuel that are made directly (i.e. in the forest) from roundwood. It excludes wood charcoal, pellets and other agglomerates. It is reported in cubic metres solid volume underbark (i.e. excluding bark).
Source: FAO, Forestry Division
Owner: FAO
Wood pellets are made from wood agglomerates produced from co-products (such as cutter shavings, sawdust or chips) of the mechanical wood processing industry, furniture-making industry or other wood transformation activities. They are produced either directly by compression or by the addition of a binder in a proportion not exceeding 3 percent by weight. Such pellets are cylindrical, with a diameter not exceeding 25 mm and a length not exceeding 100 mm. They are assumed to have 8 percent moisture content.
Source: FAO, Forestry Division
Owner: FAO
Wood pulp is fibrous material prepared from pulpwood, wood chips, particles or residues by a mechanical and/or chemical process for further manufacture into paper, paperboard, fibreboard or other cellulose products. It is an aggregate comprising mechanical wood pulp, semi-chemical wood pulp, chemical wood pulp and dissolving wood pulp. It is reported in metric tonnes air-dry weight (i.e. with 10 percent moisture content).
Source: FAO, Forestry Division
Owner: FAO
This product category is an aggregate comprising veneer sheets, plywood, particle board and fibreboard. It is reported in cubic metres solid volume.
Source: FAO, Forestry Division
Owner: FAO
1 FAO. 2020. Land use [online]. Rome. [cited September 2020]. http://www.fao.org/faostat/en/#data/RL.
2 FAO. 2020. Land use [online]. Rome. [cited September 2020]. http://www.fao.org/faostat/en/#data/RL.
3 FAO. 1999. The FAO Field Programme and agricultural development in Asia and the Pacific [online]. Bangkok. http://www.fao.org/3/AC621E/ac621e00.htm.
4 FAO. 2016. Country Profile – Egypt. [online]. Rome.FAO AQUASTAT Reports. www.fao.org/3/i9729en/I9729EN.pdf.
5 World Bank. 2020. World Bank Country and Lending Groups. [online]. Washington, D.C. [cited September 2020]. https://datahelpdesk.worldbank.org/knowledgebase/articles/906519-world-bank-country-and-lending-groups.
6 ILO. 2019. Employment by sex and economic activity - ILO modelled estimates. [online]. Geneva. [cited September 2020]. https://www.ilo.org/shinyapps/bulkexplorer25/?lang=en&segment=indicator&id=EMP_2EMP_SEX_ECO_NB_A.
7 ILO. 2019. Employment by sex, status in employment and economic activity. [online]. Geneva. [cited September 2020]. https://www.ilo.org/shinyapps/bulkexplorer11/?lang=en&segment=indicator&id=EMP_TEMP_SEX_STE_ECO_NB_A.
8 UN. 2020. Time-use statistics [online]. New York. [cited September 2020]. https://unstats.un.org/unsd/gender/timeuse/.
9 FAO. 2019. Government expenditure on agriculture [online].Rome. [cited September 2020]. http://www.fao.org/economic/ess/investment/expenditure/en/.
10 African Union. 2014. Malabo Declaration on Accelerated Agricultural Growth and Transformation for Shared Prosperity and Improved Livelihoods. Addis Ababa. Addis Ababa, African Union Commission (also available at https://www.au.int/web/sites/default/files/documents/31247-doc-malabo_declaration_2014_11_26.pdf).
11 FAO. Climate-Smart Agriculture and Digital Agriculture [online]. Rome. [cited September 2020]. http://www.fao.org/climate-smart-agriculture/en/ and http://www.fao.org/digital-agriculture/en/.
12 FAO. Biotechnology [online]. Rome. [cited September 2020]. http://www.fao.org/biotechnology/en/.
13 OECD & FAO. 2019. OECD-FAO Agricultural Outlook 2019–2028. Paris, OECD Publishing and Rome, FAO (also available at https://doi.org/10.1787/agr_outlook-2019-en).
14 FAO. 2019. Trade – Crops and livestock products [online]. Rome. [cited September 2020]. http://www.fao.org/faostat/en/#data/TP.
15 FAO. 2020. The State of World Fisheries and Aquaculture 2020. Sustainability in action. Rome. (also available at http://www.fao.org/3/ca9229en/ca9229en.pdf).
16 FAO. 2020. FAO Yearbook. Fishery and Aquaculture Statistics 2018. Rome (also available at http://www.fao.org/3/cb1213t/cb1213t.pdf).
17 OECD & FAO. 2019. OECD-FAO Agricultural Outlook 2019-2028. Paris, OECD Publishing and Rome, FAO (also available at https://doi.org/10.1787/agr_outlook-2019-en).
18 FAO, IFAD, UNICEF, WFP & WHO. 2020. The State of Food Security and Nutrition in the World 2020. Transforming food systems for affordable healthy diets. Rome, FAO (also available at http://www.fao.org/3/ca9692en/ca9692en.pdf).
19 FAO. Drought in the Horn of Africa [online]. Rome. [cited September 2020]. http://www.fao.org/emergencies/crisis/drought-hoa/intro/en/.
20 UN. Small Island Developing States [online]. New York. [cited September 2020]. https://sustainabledevelopment.un.org/topics/sids/list.
21 The methodology for compiling the food balance sheets was revised at the end of 2019. Data up to 2013 still use the previous methodology, which may cause breaks in series. More information on the new methodology is available at http://fenixservices.fao.org/faostat/static/documents/FBS/New%20FBS%20methodology.pdf. A summary of the methodological changes can be found at http://fenixservices.fao.org/faostat/static/documents/FBS/Key%20differences%20between%20new%20and%20old%20Food%20Balance%20Sheet.pdf.
22 FAO. 1998. Evaluating the potential contribution of organic agriculture to sustainability goals [online]. Rome. http://www.fao.org/3/ac116e/ac116e00.htm.
23 FAO & UN-Water. 2018. Progress on level of water stress. Global baseline for SDG 6 Indicator 6.4.2: Level of water stress: freshwater withdrawal as a proportion of available freshwater resources. Rome, FAO and UN-Water (also available at http://www.fao.org/3/ca1592en/ca1592en.pdf).
24 SOFA. 2020. The State of World Fisheries and Aquaculture 2020. Sustainability in action. Rome (also available at http://www.fao.org/3/ca9229en/ca9229en.pdf).
25 SOFIA. 2019. The State of Food and Agriculture 2019. Moving forward on food loss and waste reduction. Rome (also available at http://www.fao.org/3/ca6030en/ca6030en.pdf).


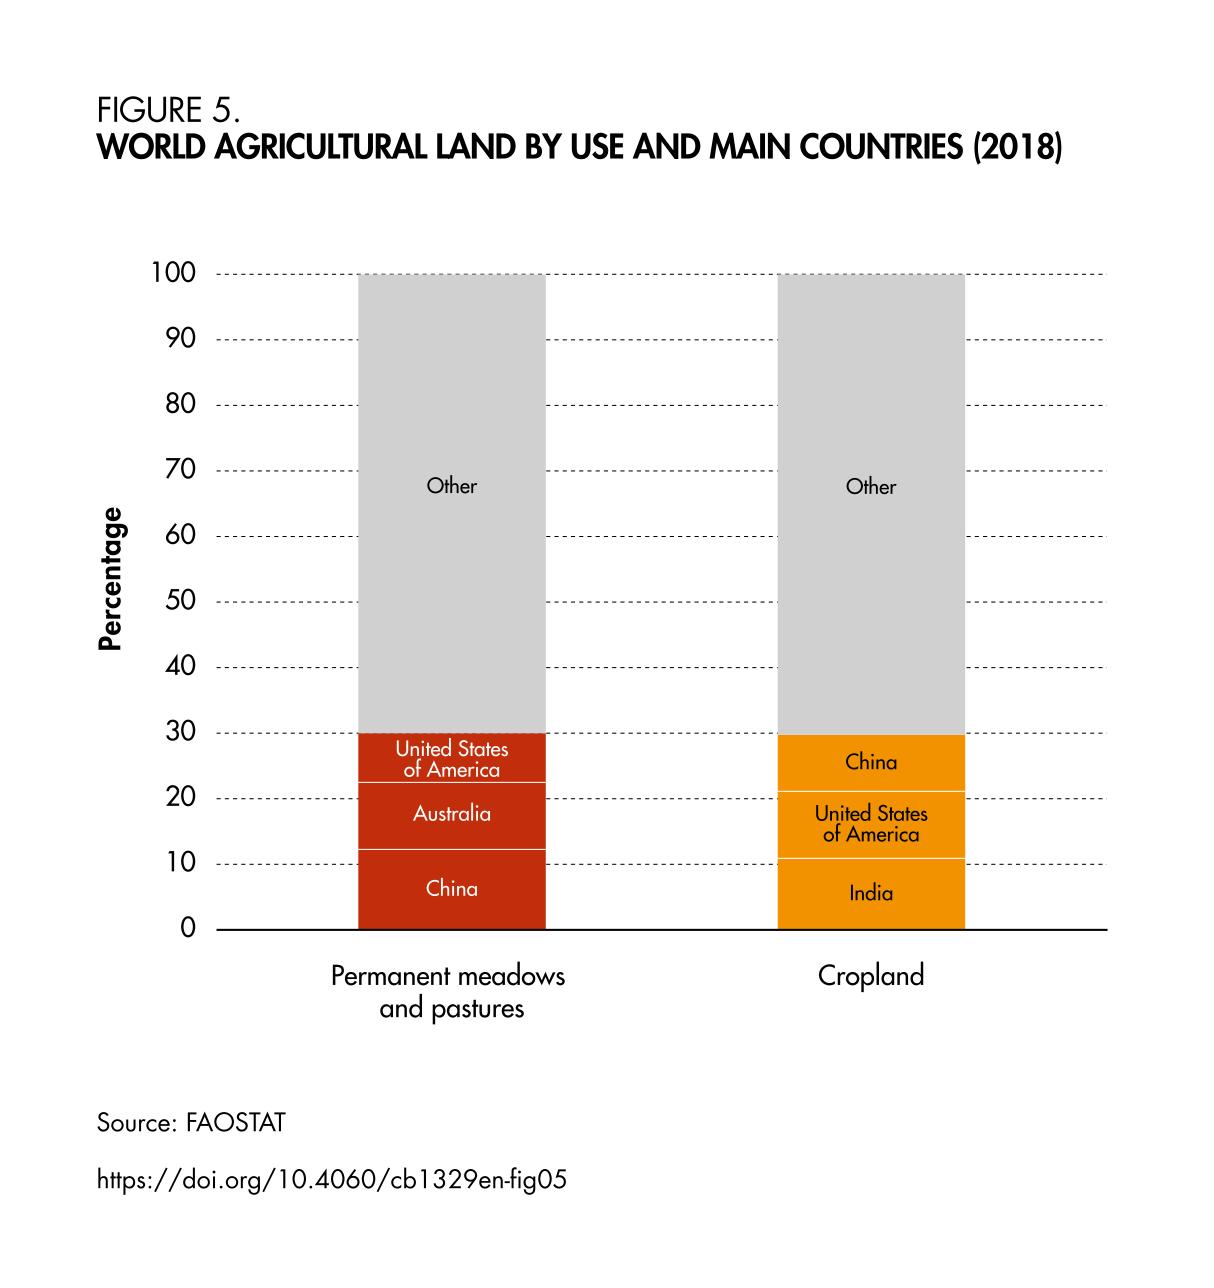
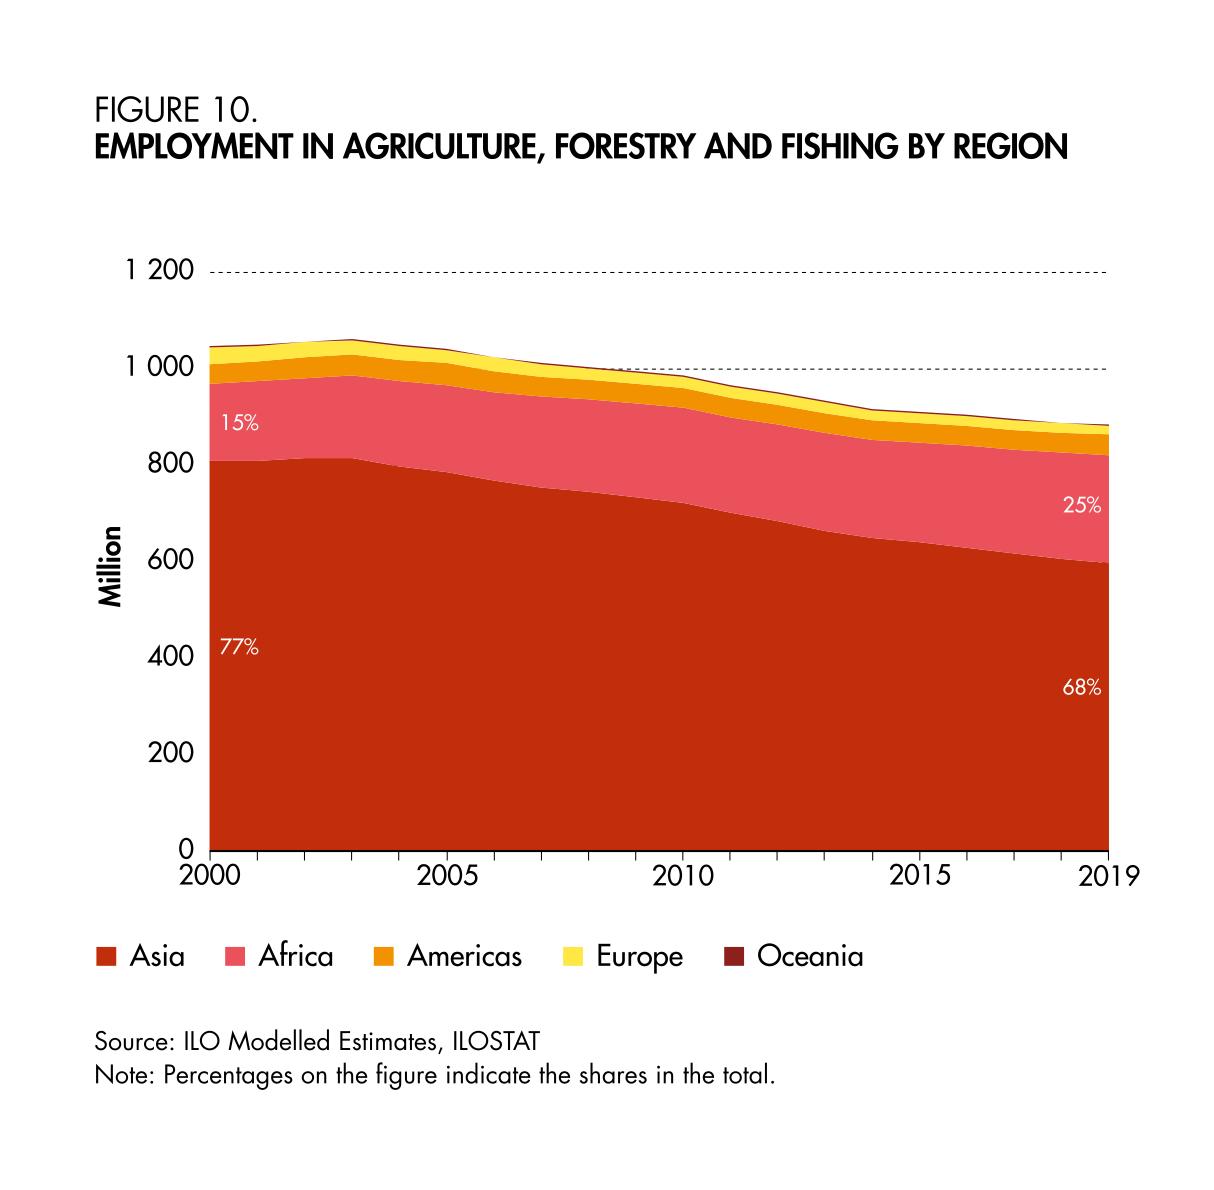
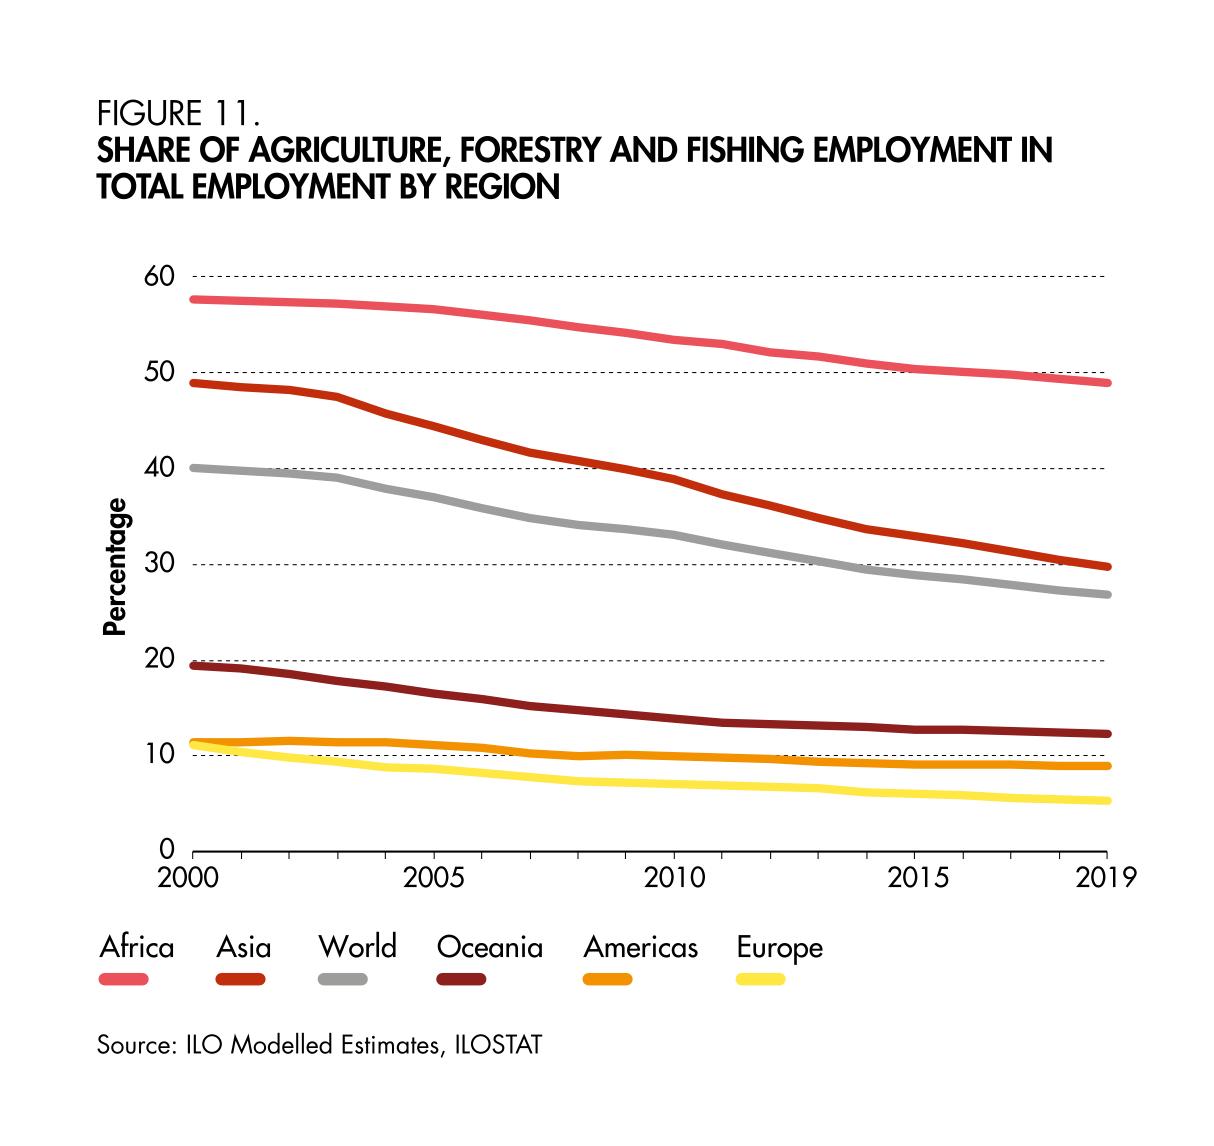
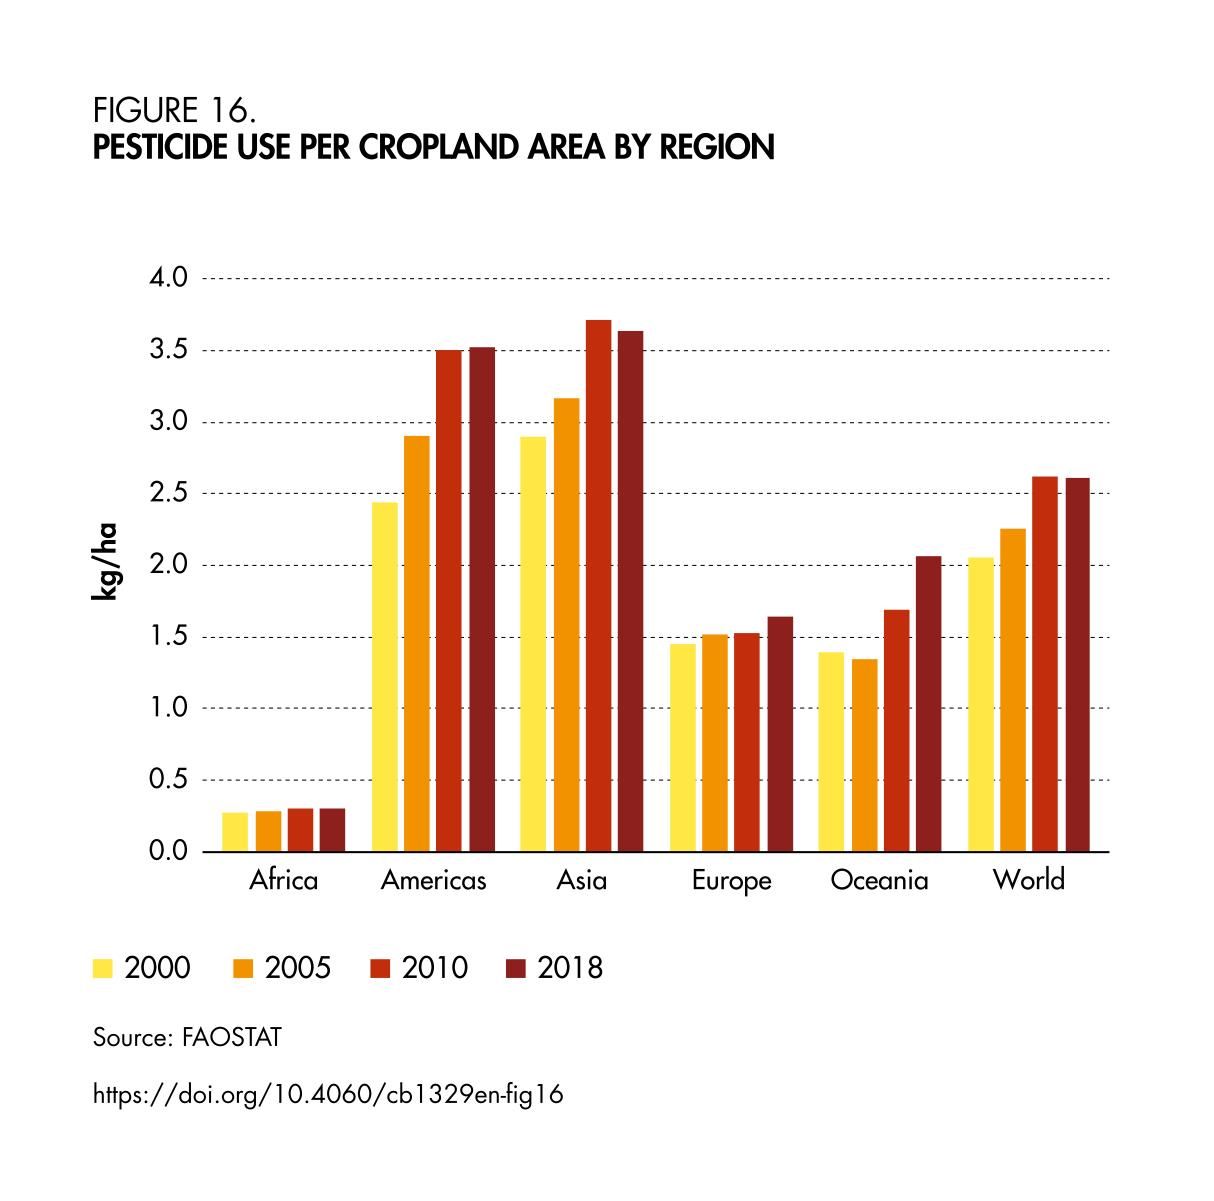
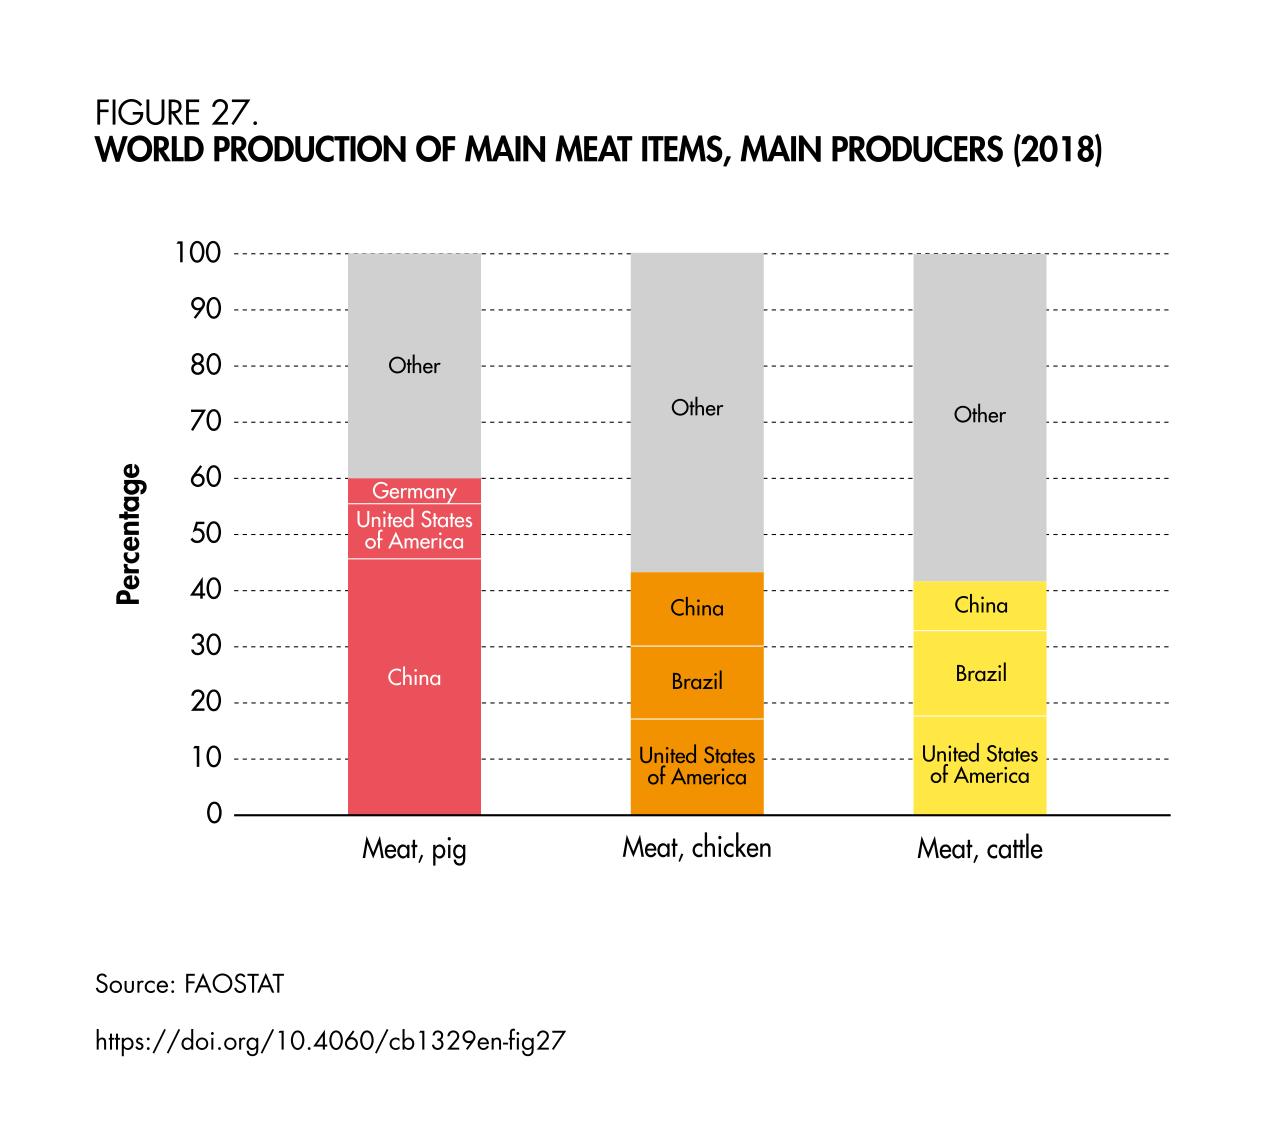
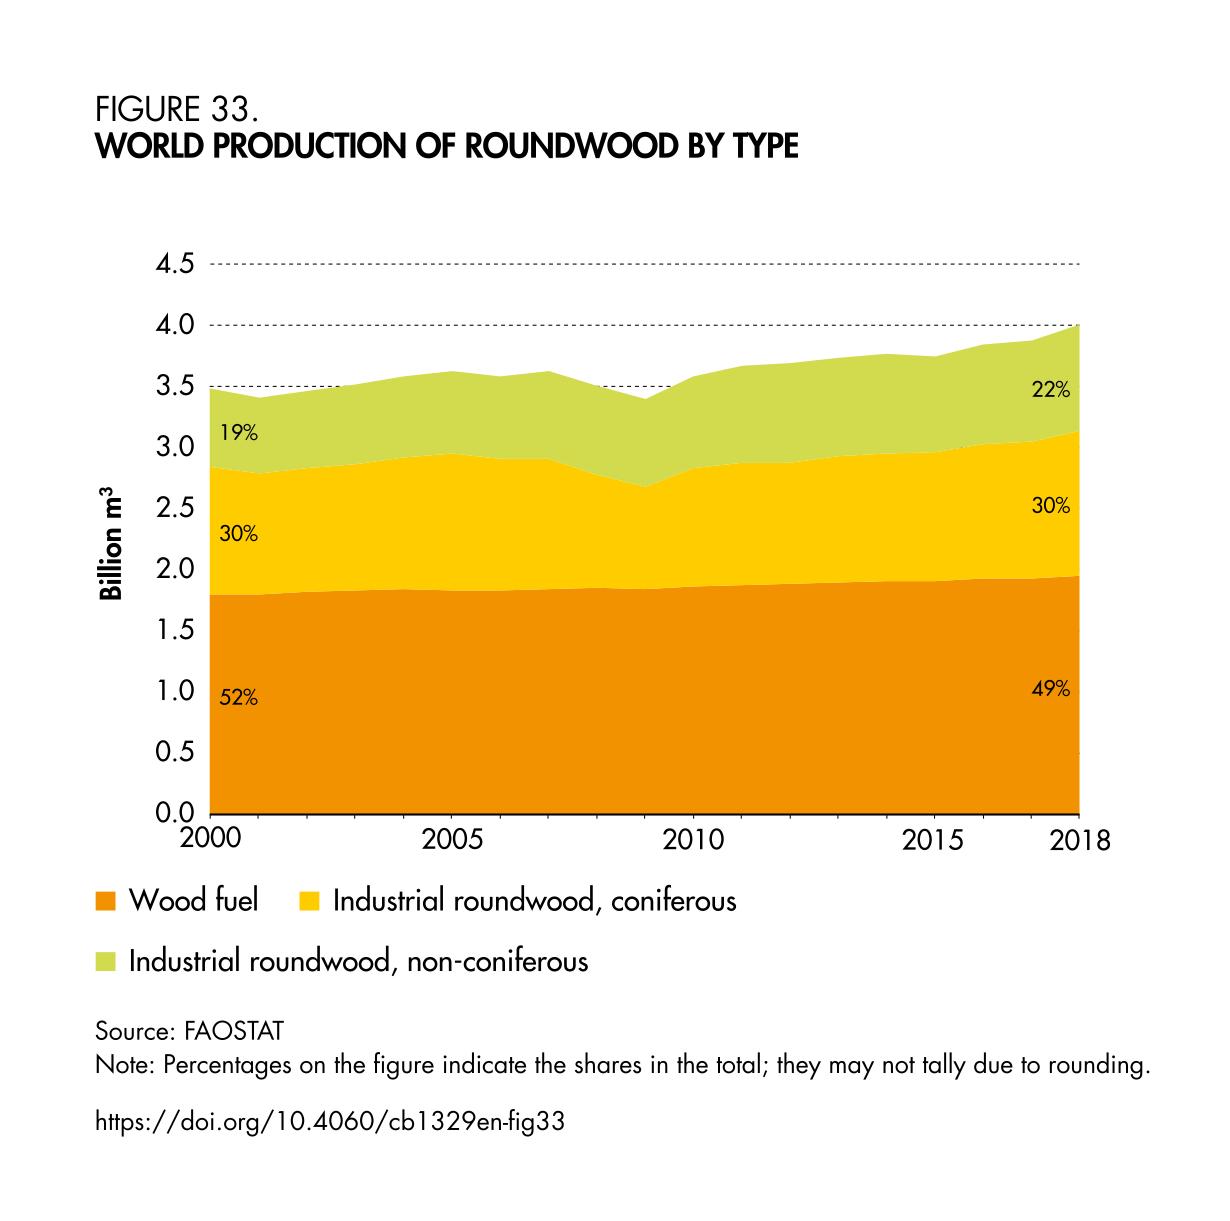
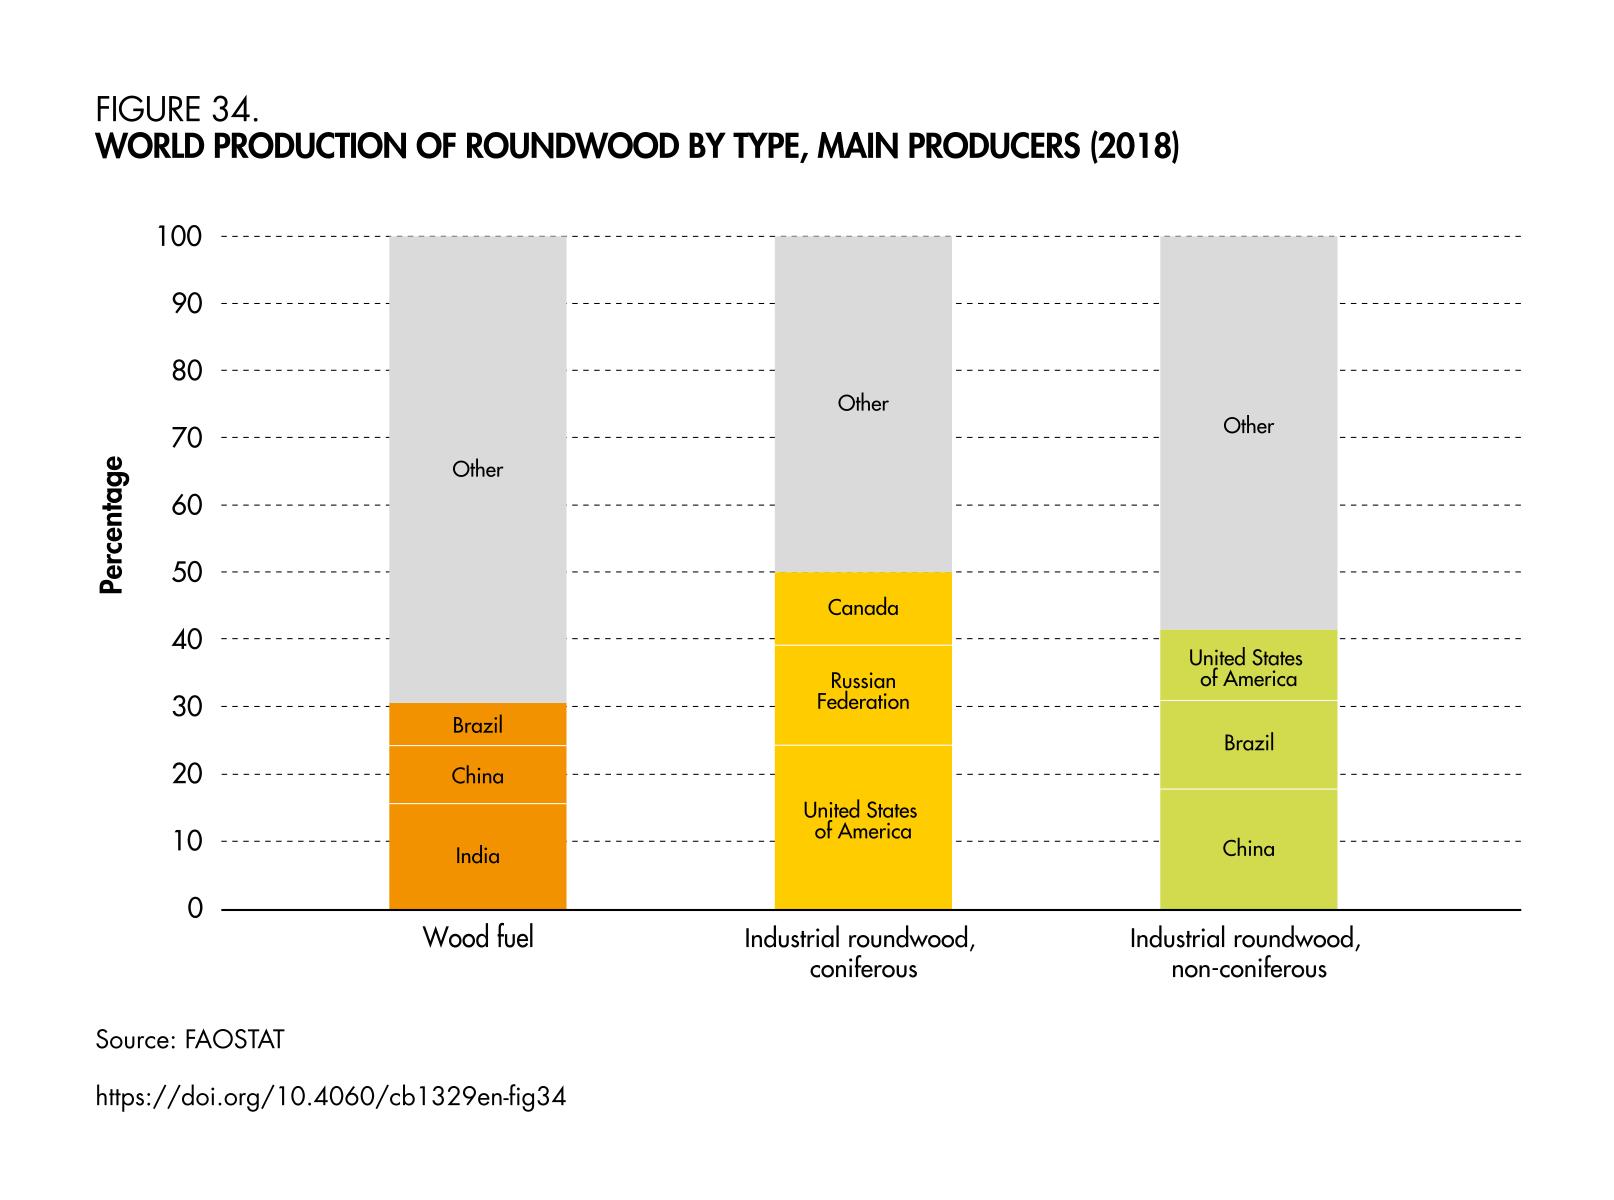
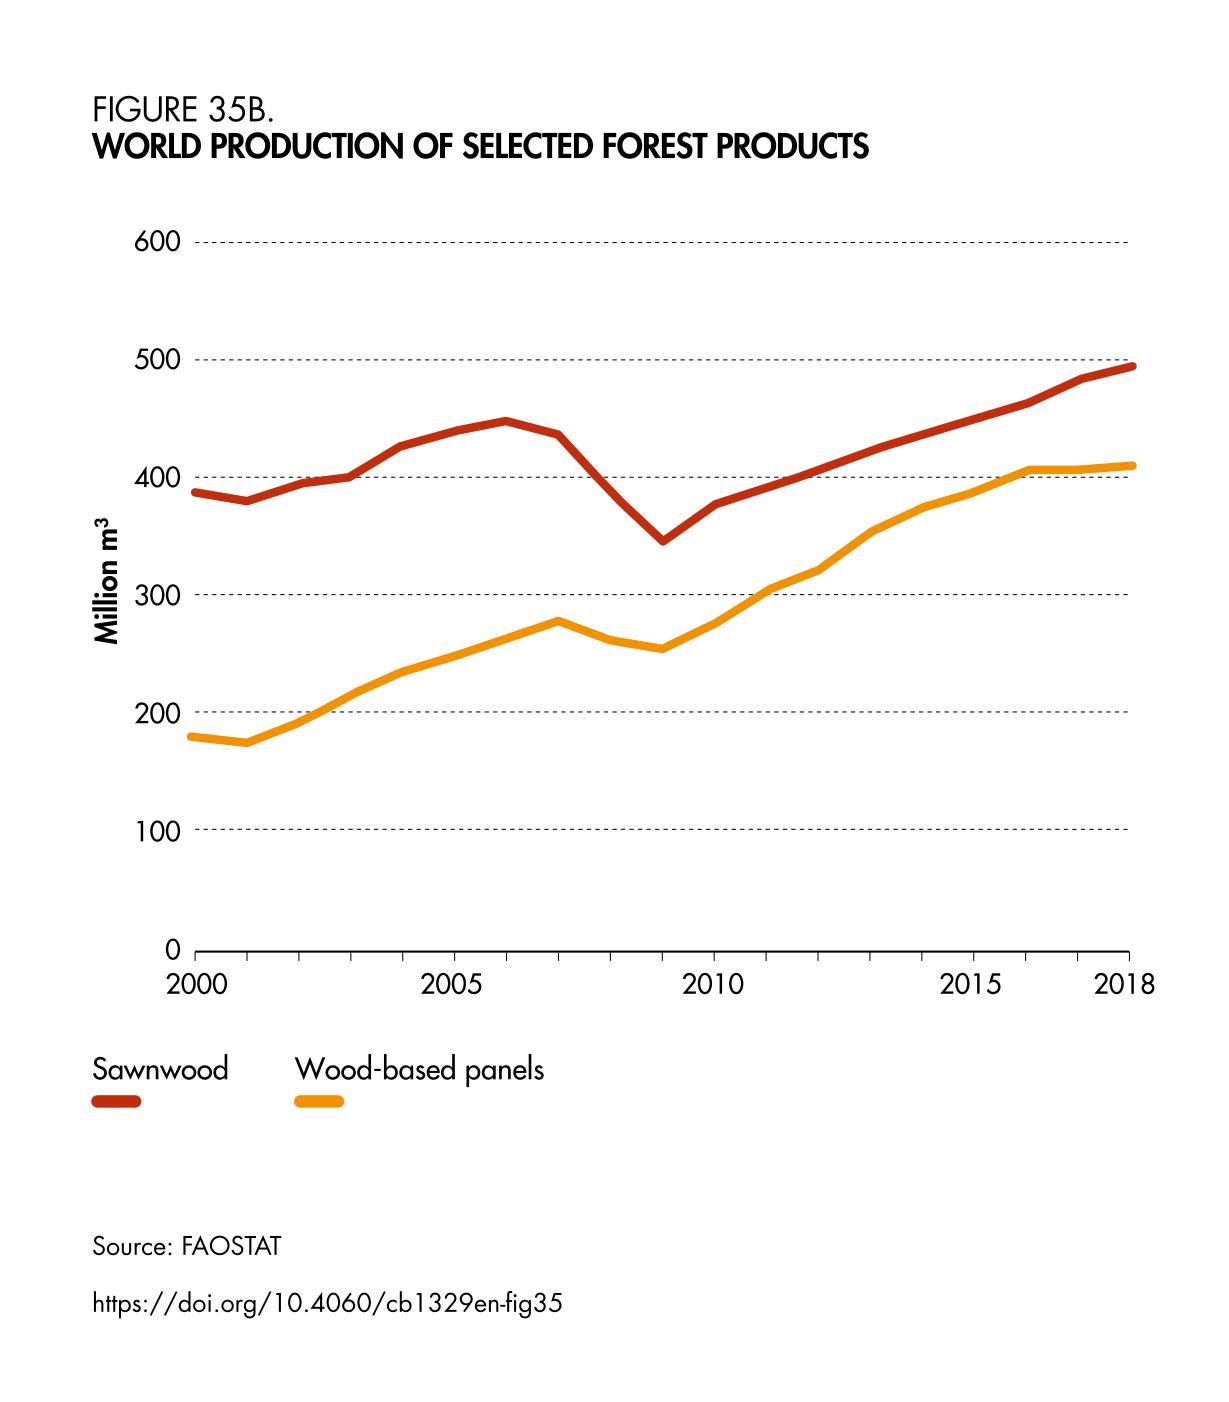
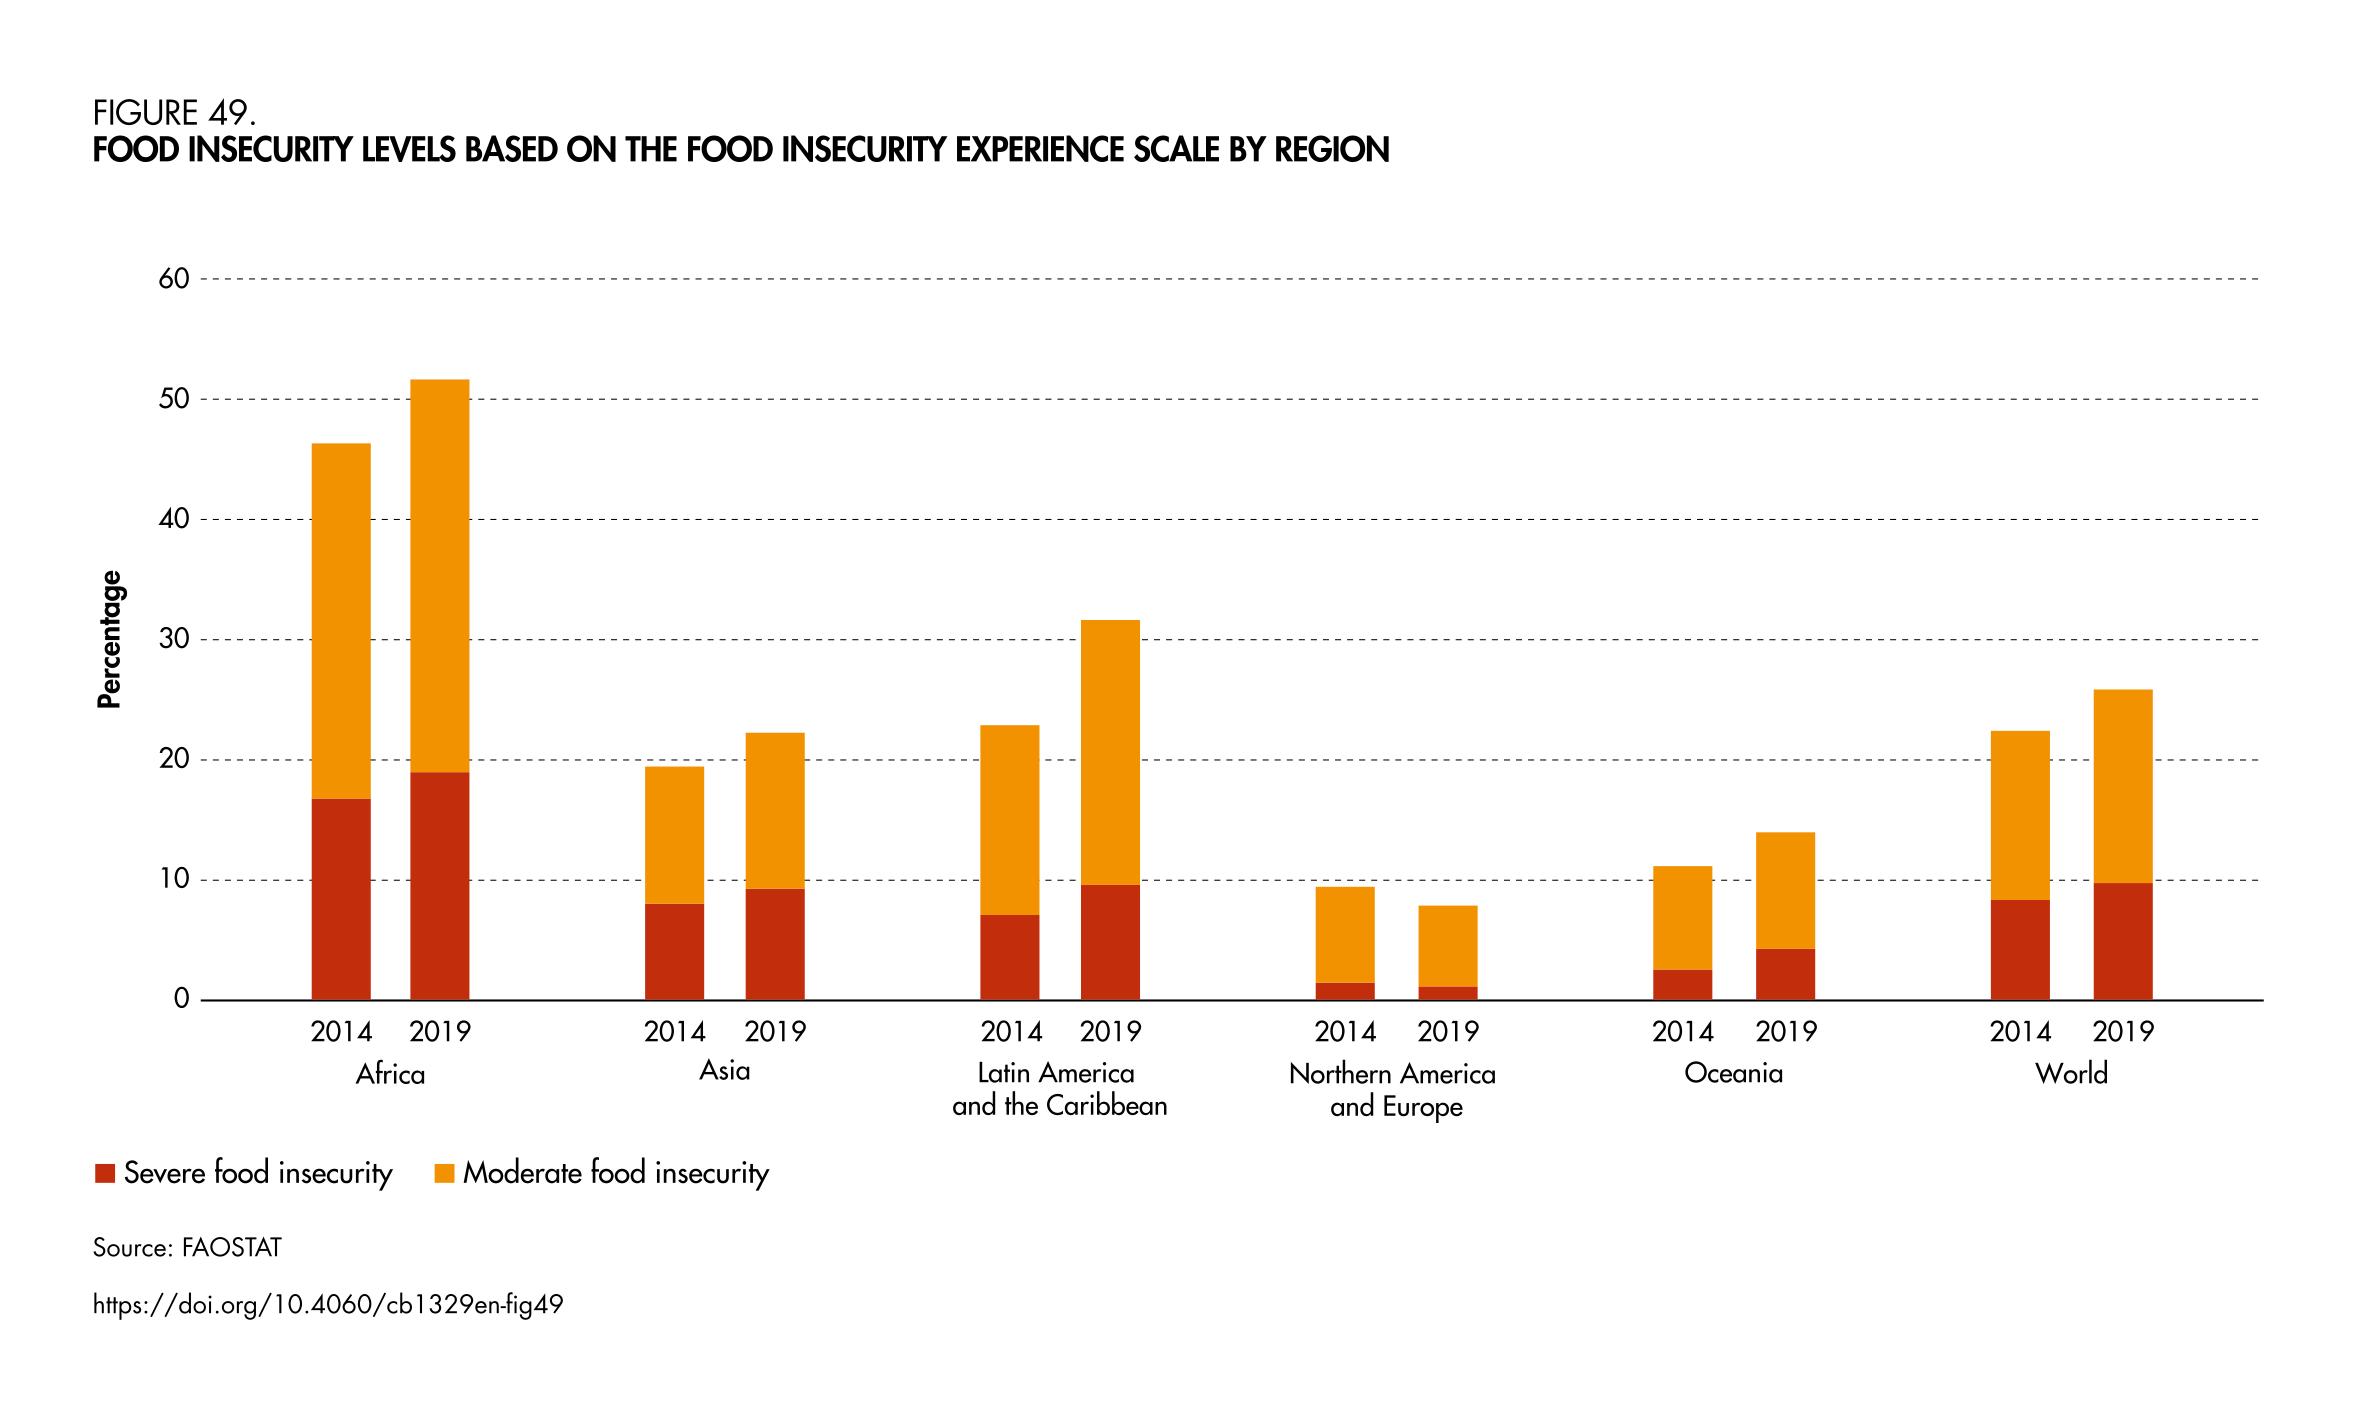
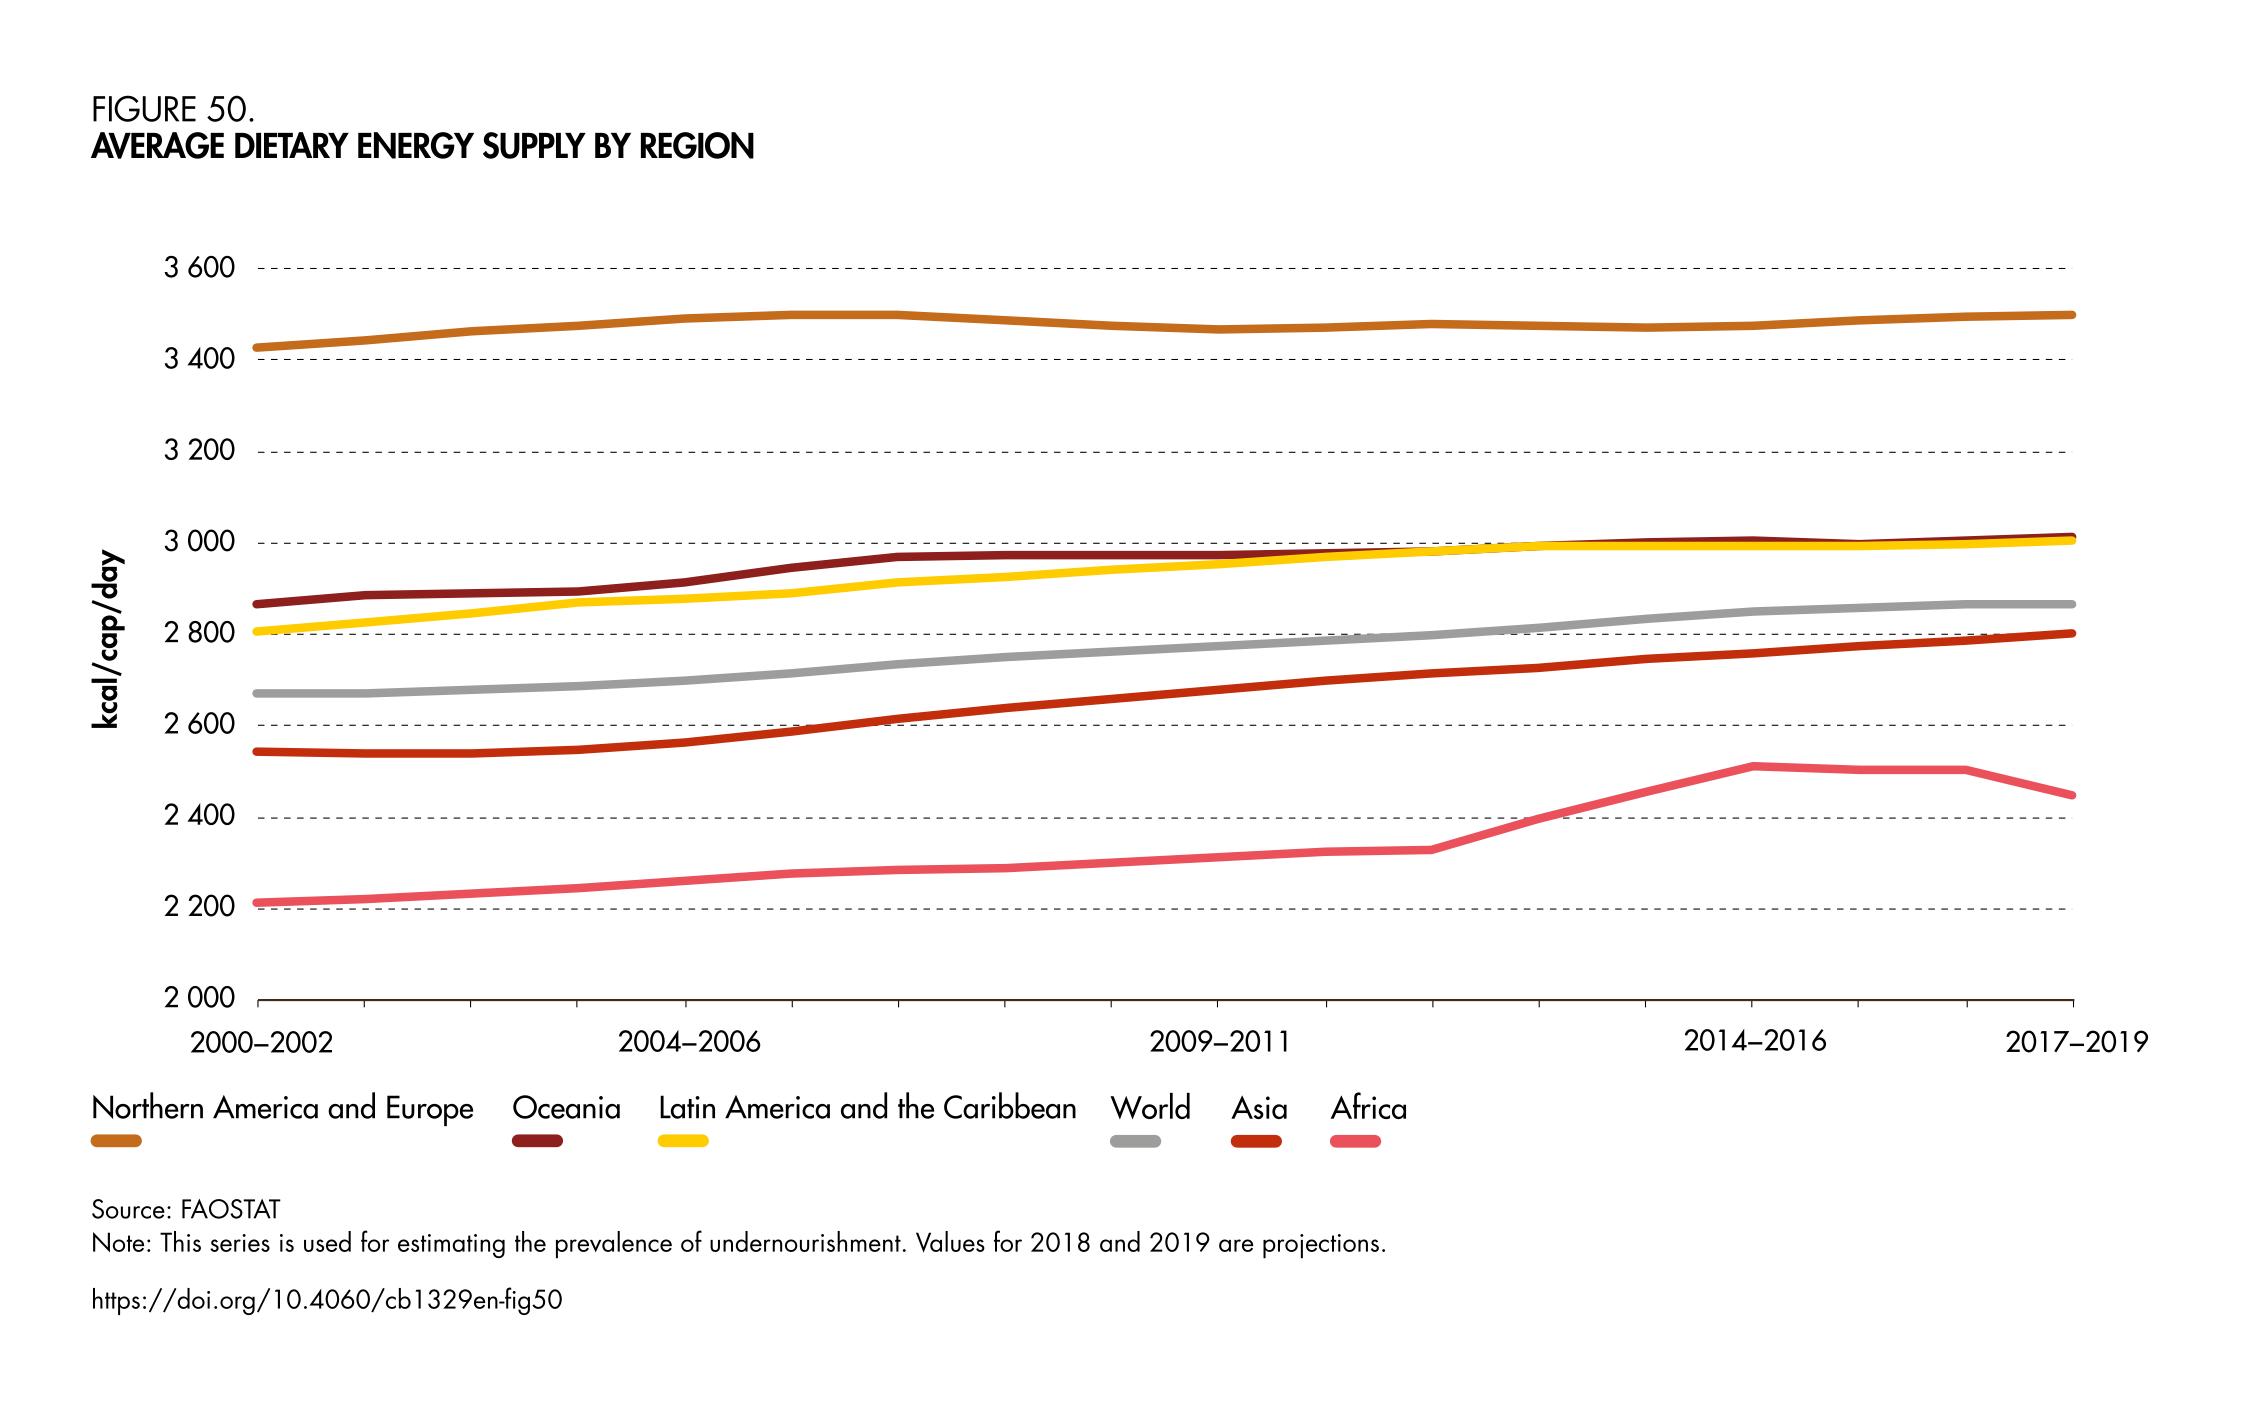
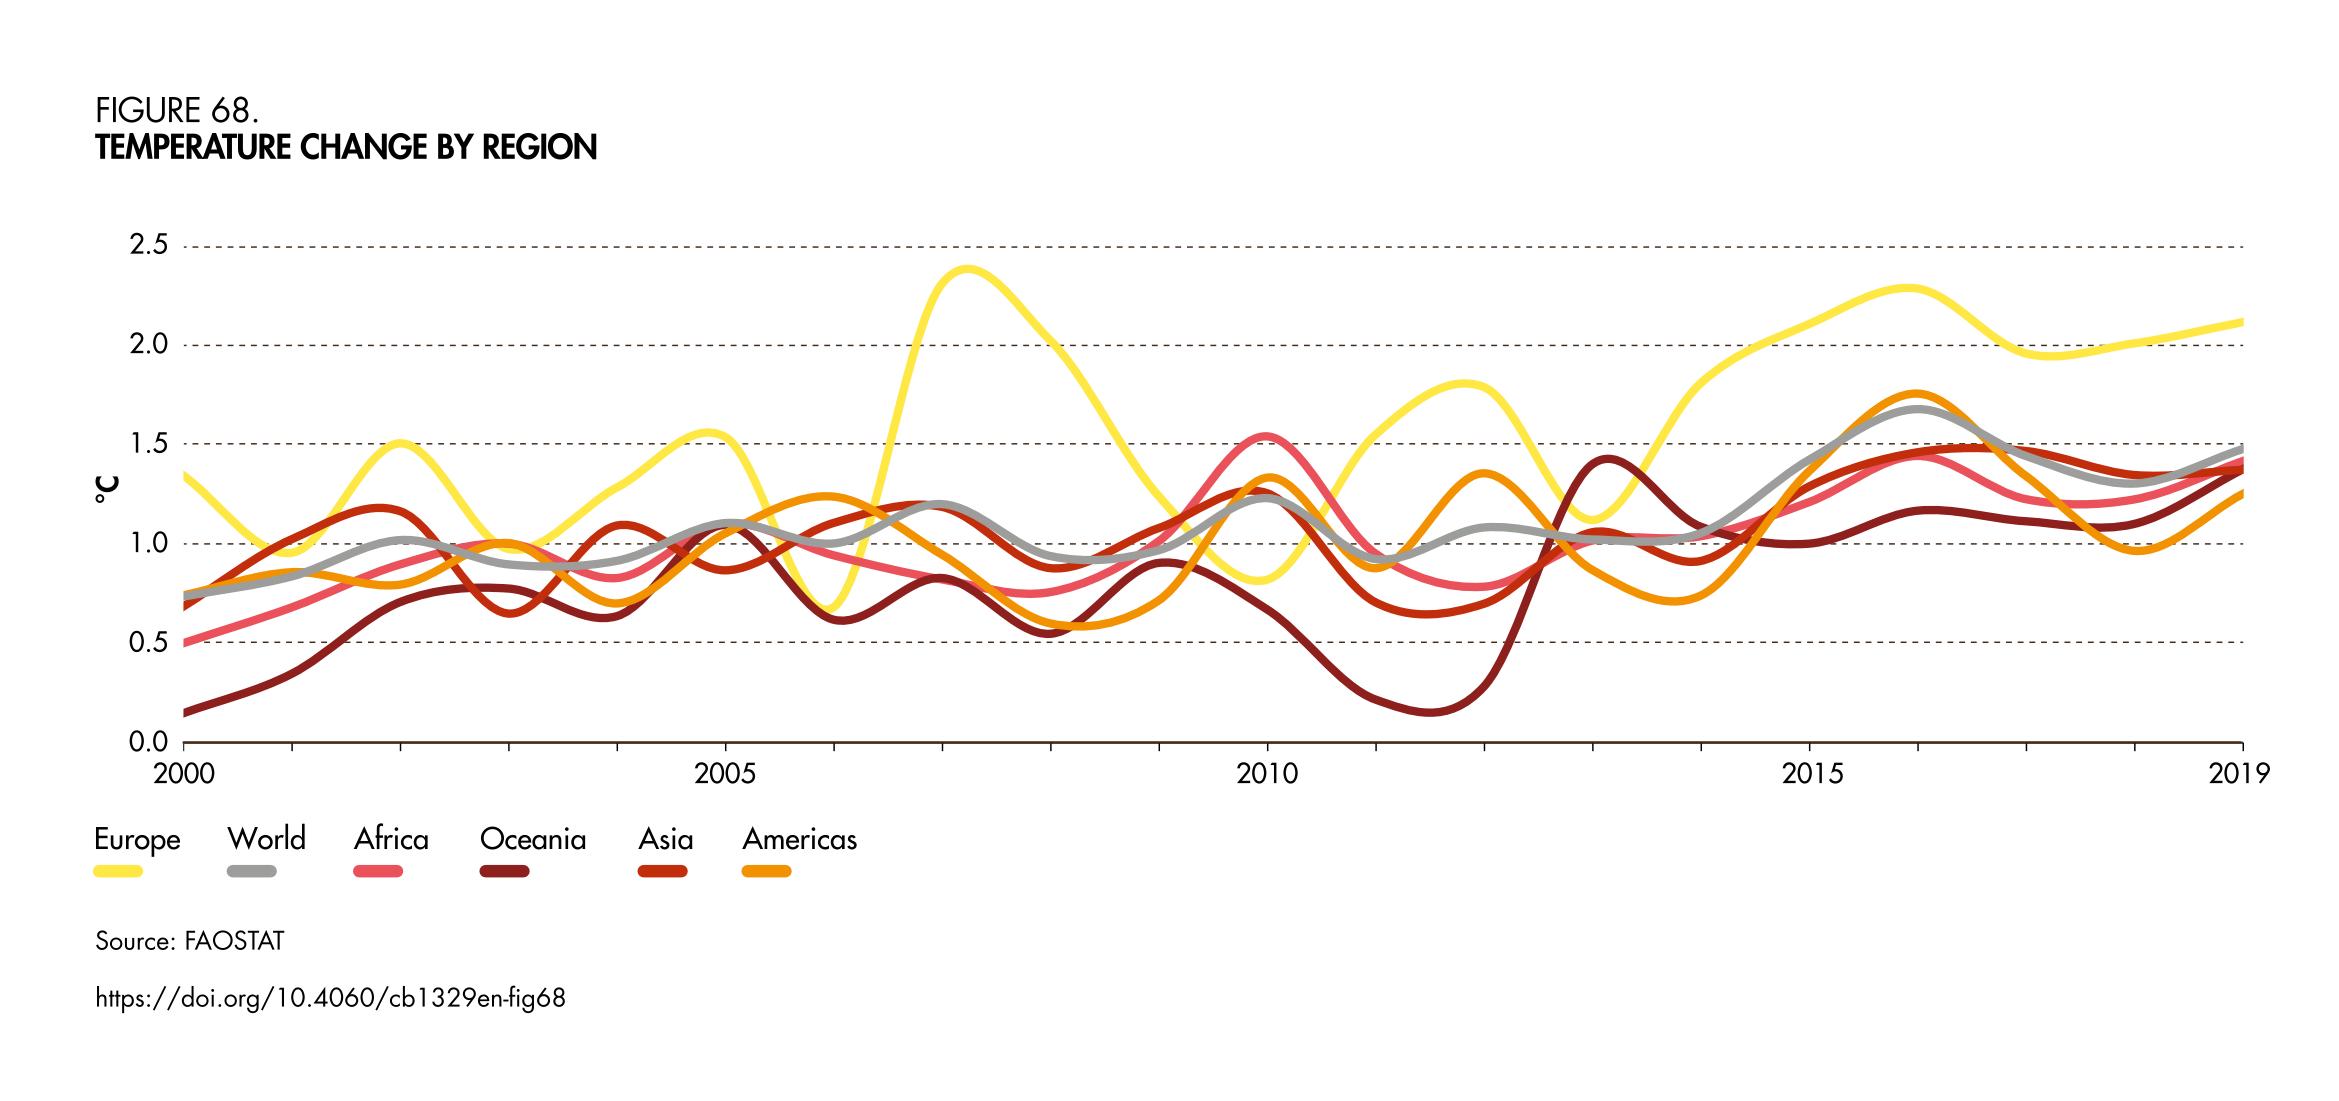