Table 2-8
Constituents of meat from some free living animals |
||||||||||||||
| Species | Composition of meat |
|||||||||||||
| Ash | Fat | Solid nutrient | Calories /100g | |||||||||||
(g/100 g fresh weight) |
||||||||||||||
| Eland | 1.1 | 1.9 | 23 | 125 | ||||||||||
| Hartebeest | 1.2 | 2.1 | 24 | 130 | ||||||||||
| Topi | 1.3 | 2.3 | 23 | 126 | ||||||||||
| Giraffe | 1.4 | 2.2 | 22 | 123 | ||||||||||
| Buffalo | 1.1 | 1.8 | 22 | 120 | ||||||||||
| Warthog | 1.2 | 2.3 | 25 | 132 | ||||||||||
| Free range cattle | 1.1 | 2.0 | 22 | 120 | ||||||||||
| Intensive fat stock | 0.9 | 15.0 | 18 | 230 | ||||||||||
A comparison of the fatty acids in muscle total lipids, triglycerides and ethanolamine phosphoglycerides1 |
||||||||||||||
| Fatty acid designation | Bos taurus2 (Beef) | Taurotragus oryx (Eland) | Syncerus caffer (Buffalo) | Bos Indicus3 (African beef) | ||||||||||
| Total | Trigly ceride | EPG | Total | EPG | Total | EPG | Total | Triglyceride | EPG | |||||
| 16:0 | 29.0 | 33.0 | 12.0 | 19.0 | 9.0 | 16.0 | 11.0 | 17.0 | 29.0 | 15.0 | ||||
| 18:0 | 18.0 | 16.0 | 36.0 | 20.0 | 33.0 | 22.0 | 32.0 | 18.0 | 16.0 | 33.0 | ||||
| 18:1 | 47.0 | 45.0 | 16.0 | 17.0 | 9.0 | 23.0 | 14.0 | 28.0 | 48.0 | 18.0 | ||||
| 18:2,n-6 | 1.2 | 1.0 | 1.6 | 22.0 | 8.5 | 16.0 | 4.5 | 14.0 | 3.6 | 3.7 | ||||
| 18:3,n-3 | 0.9 | 0.5 | 0.8 | 4.1 | 3.8 | 5.0 | 3.0 | 3.5 | 2.1 | 2.0 | ||||
| 20:3,n-6 | 0.3 | 0.1 | 3.0 | 0.8 | 0.4 | 0.3 | 0.9 | 1.1 | 0.1 | 1.1 | ||||
| 20:4,n-6 | 1.2 | 0.2 | 12.0 | 6.4 | 15.0 | 7.1 | 12.0 | 7.0 | - | 13.0 | ||||
| 20:5,n-3 | 0.2 | - | 2.9 | 1.0 | 1.9 | 1.1 | 2.5 | 1.8 | - | 1.9 | ||||
| 22:5,n-3 | 0.5 | - | 8.0 | 3.8 | 9.3 | 3.0 | 9.0 | 4.0 | - | 11.0 | ||||
| 22:6,n-3 | 0.2 | - | 1.4 | 0.8 | 3.4 | 0.2 | 0.9 | 0.8 | - | 1.2 | ||||
| 1The results are expressed as the
percentage (by weight) of the total fatty acids. These
results illustrate that whole tissue fatty-acid analyses
need not reflect the fatty-acid composition of cell
structural lipids. 2Intensive reared for the London market 3Non-intensive obtained from the Siroti market, Uganda |
||||||||||||||
(Crawford. 1975)
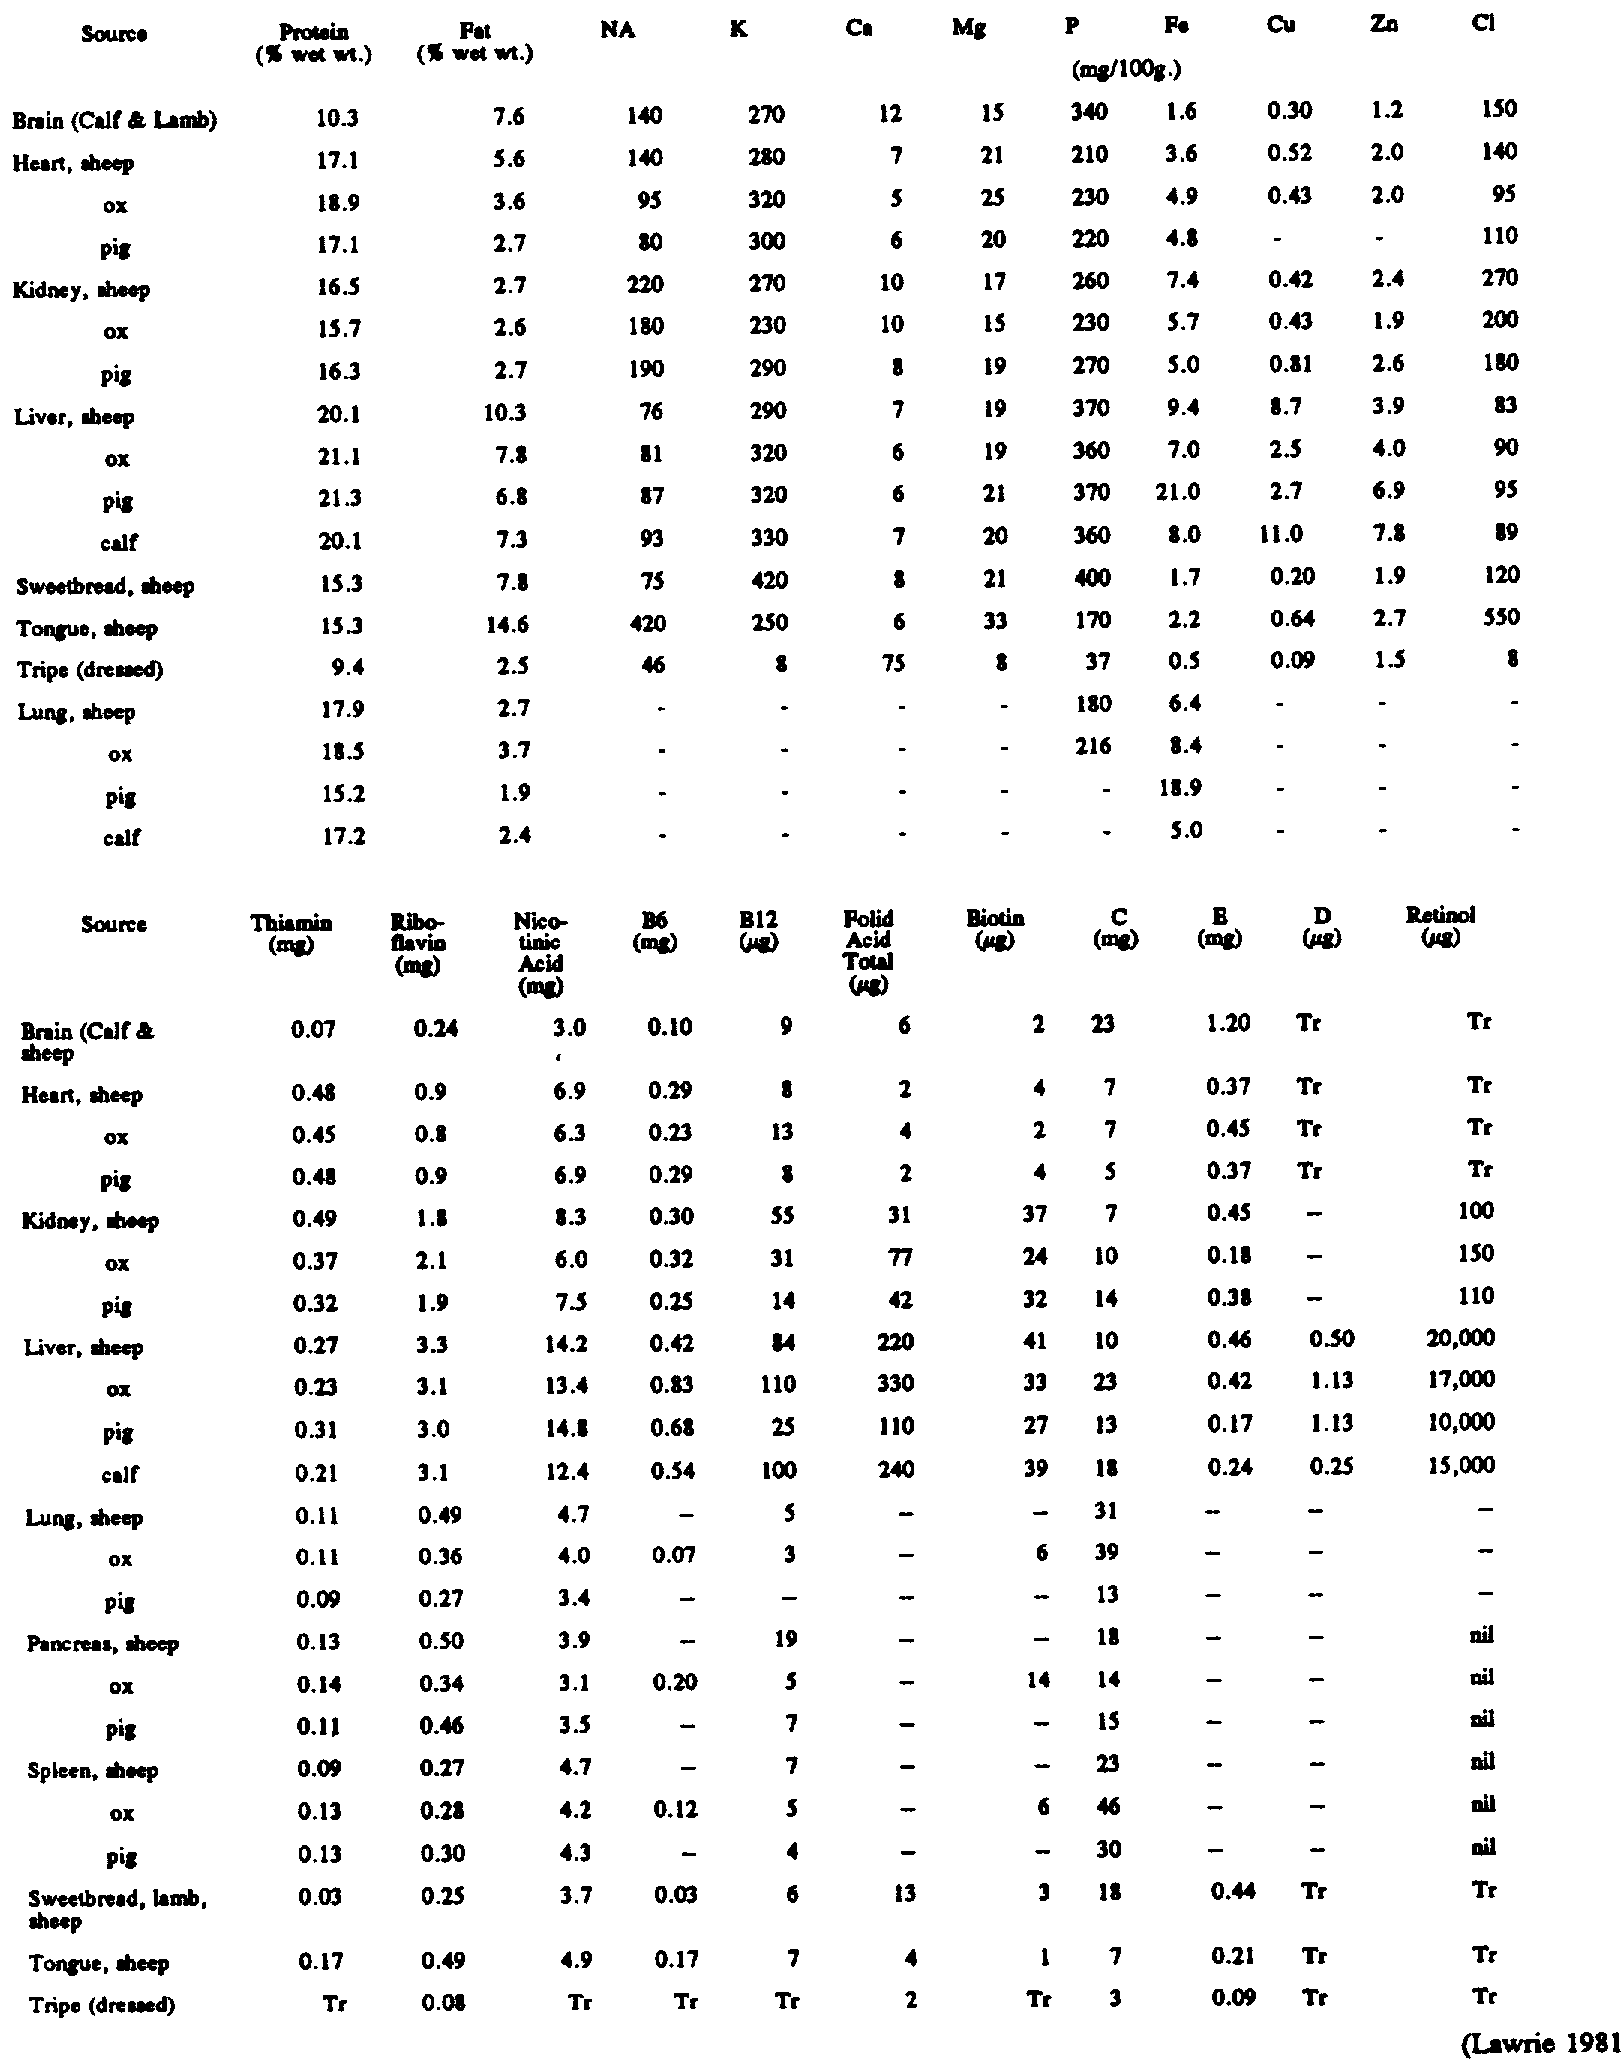
Table 2-9 - Composition of offals (per 100 g raw)
Table 2-10A - PROPORTIONAL VALUE DERIVED FROM CARCASS MEAT AND DIFFERENT BY-PRODUCTS FROM CATTLE, HOGS AND LAMBS
| Cattle | Pig | Lamb | |
| (%) | (%) | (%) | |
| Carcass meat | 34 | 52 | 32 |
| Bones | 16 | 17 | 18 |
| Organs | 16 | 7 | 10 |
| Skin and attached fat | 6 | 6 | 15 |
| Blood | 3 | 3 | 4 |
| Fatty tissues | 4 | 3 | 3 |
| Horns, hoofs, feet and skull | 5 | 6 | 7 |
| Abdominal and intestinal contents | 16 | 6 | 11 |
(Goldstrand 1988)
Table 2-10B - NOMENCLATURE OF OFFAL (VARIETY MEATS, SIDE MEATS, ORGAN MEATS)
| Tissue | |
| Stomach | Pork- maw |
| Sheep - paunch | |
| Cow - tripe | |
| Rumen | Blanket tripe |
| Reticulum | Honeycomb tripe |
| Omasum | Bible |
| Abomasum | Reed |
| Weasand | Gullet meat surrounding oesophagus; throat meat in lamb and veal |
| Giblets | Neck, gizzard, heart and liver of poultry |
| Small intestines of pigs | Chitterlings |
| Fat | (1) Lard - surrounding stomach and
kidneys mainly of pigs (2) Tallow (hard fat or dripping) beef and mutton fat from parts other than kidney |
| Suet | From kidneys of oxen and sheep |
Table 2-11 - Change in composition from cooking meat and meat products (per 100 g)
| Water | Protein | Fat | Energy |
Thiamin | Niacin | ||
| (%) | (%) | (%) | kcal | MJ | (mg) | (mg) | |
| Bacon, collar joint lean & fat, raw | 51 | 15 | 29 | 320 | 1.3 | 0.4 | 2.7 |
| boiled | 49 | 20 | 27 | 325 | 1.3 | 0.3 | 2.6 |
| Beef brisket, raw | 62 | 17 | 21 | 250 | 1.4 | 0.05 | 3.7 |
| boiled | 48 | 28 | 24 | 290 | 1.2 | 0.04 | 4.3 |
| Rump steak, raw | 67 | 19 | 14 | 200 | 0.8 | 0.08 | 4.2 |
| fried | 56 | 29 | 15 | 250 | 1.0 | 0.08 | 5.5 |
| grilled | 59 | 27 | 12 | 220 | 0.9 | 0.08 | 5.7 |
| Lamb cutlets, raw | 49 | 15 | 36 | 390 | 1.6 | 0.09 | 4 |
| grilled | 45 | 23 | 31 | 370 | 1.5 | 0.10 | 5 |
| Veal fillet, raw | 75 | 21 | 3 | 110 | 0.5 | 0.1 | 7 |
| roast | 55 | 32 | 12 | 230 | 1.0 | 0.06 | 7 |
| Chicken meat, raw | 74 | 21 | 4 | 120 | 0.5 | 0.1 | 8 |
| boiled | 63 | 29 | 7 | 180 | 0.8 | 0.06 | 7 |
| roast | 68 | 25 | 5 | 150 | 0.6 | 0.08 | 8 |
| Rabbit meat, raw | 75 | 22 | 4 | 120 | 0.5 | 0.1 | 8.4 |
| stewed | 64 | 27 | 8 | 180 | 0.7 | 0.07 | 8.5 |
| Ox liver, raw | 69 | 21 | 8 | 160 | 0.7 | 0.25 | 13 |
| stewed | 63 | 25 | 10 | 200 | 0.8 | 0.2 | 10 |
| Beefburgers, raw, frozen | 56 | 15 | 21 | 265 | 1.1 | 0.04 | 3.7 |
| fried | 53 | 20 | 17 | 265 | 1.1 | 0.02 | 4.2 |
| Beef sausage, raw | 50 | 10 | 24 | 300 | 1.2 | 0.03 | 5 |
| fried | 48 | 13 | 18 | 270 | 1.1 | 0 | 7 |
| grilled | 48 | 13 | 17 | 270 | 1.1 | 0 | 5 |
(McCance and Widdowson, 1991)
Table 2-12 - Per Cent Composition Raw and Cooked Meats
(Coefficient of Variation)
(From Massachusetts Nutrient Data Bank)
| Product | Protein | Fat | |
| Beef steak (with bone) | Raw | 18.7 (15) | 19.4 (65) |
| Cooked | 26.4 (16) | 21.4 (63) | |
| without bone | Raw | 19.2 (14) | 16.9 (74) |
| Cooked | 27.4 (15) | 17.6 (75) | |
| Pork chops | Raw | 19.3 (11) | 15.1(61) |
| Cooked | 27.0 (14) | 20.9 (36) | |
| Bacon | Raw | 6.3 (58) | 69.7 (30) |
| Cooked | 18.0 (59) | 52.9 (59) | |
| Lamb | Raw | 17.1 (13) | 18.5 (60) |
| Cooked | 24.7 (14) | 19.2 (62) |
(Pellett and Young, 1990)
Table 2-13 - Macronutrients in Chicken (in %)
| Product | Water | Protein | as % DM* | Fat | as % DM* |
| Light | 74.4 | 21.8 | 3.2 | ||
| Dark | 74.5 | 19.1 | 5.5 | ||
| Total with skin | 64.4 | 17.6 | 17.7 | ||
| Total meat raw | 74.4 | 20.5 | 82.7% | 4.3 | 17.3% |
| Boiled | 63.4 | 29.2 | 80% | 7.3 | 20% |
| Roast | 68.4 | 24.8 | 82.1% | 5.4 | 17.9% |
*DM = Protein + Fat
(McCance and Widdowson, 1991)
Table 2-14 - Retention of vitamins B1 and B2 in different cuts of braised meat
| Weight | Time of cooking | Vitamin B1 | Vitamin B2 | |
| (lb) | (min/lb) | (% retention) | (% retention) | |
| BEEF | ||||
| Short ribs | 4.5 | 30 | 25 | 58 |
| Chuck | 6 | 35 | 23 | 74 |
| Flank steak | 1.75 | 28 | 30 | 72 |
| Round (roast) | 27 | 40 | 73 | |
| Round (steak) | 18 | 40 | 65 | |
| VEAL | ||||
| Chops | 1.75 | 28 | 38 | 73 |
| Round steak | 1.75 | 27 | 48 | 76 |
| PORK | Total time of cooking | |||
| Chops | 50 min | 44 | 64 | |
| Spare ribs | 2 h | 26 | 72 | |
| Tenderloin | 40 min | 57 | 83 |
(Noble, 1965)