
| World trade: Why is it important? |
| PREVIOUS FILE |
|
Trade creates the wealth necessary for economic development, creation of employment opportunities and the alleviation of suffering. |

Marco Polo opened the trade routes from Europe to China in the
Middle Ages. The Silk Road existed long before and was very
active in Roman times.
Some US$ 3 800 000 million worth of goods were traded among the world's countries in 1993. Ideally, trade consists of one country selling what it is best able to produce, and buying what others produce better. It creates wealth which can be used to reduce poverty, generate income, create employment and develop the economy.
Trade is generally more effective than aid as an engine of development. If all things were equal, international trade would represent developing countries' best means of raising the funds necessary to meet their peoples' needs. But in reality the balance of trade is tilted against them.
Some developing countries are becoming more industrialized, but most of them still bring raw materials, or materials that have been little processed, such as minerals, timber and agricultural products, to the world marketplace. Raw materials provide nearly 90 percent of the export earnings of sub-Saharan African countries.
FAO lists 47 developing countries, 24 of them in Africa, which depend on agricultural exports. Many of these rely on exporting a single crop such as coffee, sugar, cotton or, in the case of Madagascar, vanilla. This can be dangerous, as Madagascar found when it was challenged by cheaper vanilla coming onto the market from Indonesia. For such countries, a bad harvest at home can wipe out a year's export earnings, while a good harvest elsewhere may flood the market.
Many countries have set out to diversify their production. But most of the foreign exchange earned by over half of all developing countries still comes from just one or two commodities.
Since 1970, sub-Saharan Africa and Latin America and the Caribbean have all seen their share of global trade fall, while the proportion enjoyed by East and Southeast Asia has grown.
Share of agriculture in world exports
Click here to see the
statistics![]()


Share of agricultural production and merchandise exports
Share of agricultural production in GDP and
percentage share of merchandise exports
Click here to see the map![]()

Boundary of Eritrea shown in grey.
On this map primary commodities include fuels, minerals, metals,
oils, textile fibres, foods and live animals. Manufactured goods
include machinery and plant, transport equipment, textiles and
clothing and the full range of finished manufactured goods.
Source: World Bank, 1995
Agricultural commodities are a major source of income for most developing countries other than those that have oil reserves, but prices have tended to fall over recent decades while those of manufactured goods have risen steadily. During the 1980s, recession and slow growth in the developed countries kept demand and prices low.
Between 1960 and 1987, the prices of 33 commodities monitored by the World Bank halved. The value of a 60 kilogram sack of coffee worth US$ 310 in 1977, had fallen to US$ 143 in 1989 and was worth only US$ 79 in March 1993. Between 1982 and 1992 the real cost of a kilogram of cocoa fell by about 60 percent, a kilogram of cotton by 40 percent and a kilogram of rubber by 45 percent. Although prices improved in 1994, they still stood below their 1980 level.
Meanwhile the prices of manufactured products imported by developing countries were rising - by 25 percent between 1980 and 1988. Overall, in the 1980s, the raw materials exported by developing countries lost 40 percent of their value in relation to the manufactured goods they imported.
Agricultural commodity prices are highly unstable because of fluctuations in supply and demand. Competition aggravates the situation - 62 developing countries, for example, vie for a share of the world's coffee market. Between 1972 and 1983, coffee prices fluctuated wildly each year by an average of 36 percent above or below the trend. Furthermore, most commodities are processed after leaving their country of origin, which therefore does not benefit from the added value that this brings. Sri Lanka keeps less than a quarter of the price of each packet of its tea that is sold in the United Kingdom - and even less reaches the farmer.
Monitoring world trade in agriculture, fisheries and forest products is one of the prime tasks for which FAO was established. FAO monitors closely policy developments in commodity markets and provides fore for discussions of emerging commodity problems through its various intergovernmental groups.

Price indices
Click here to see the
statistics![]()

|
|
Several major wheat producing countries do not rely on it as their main staple, but many wheat importing countries do. |
Indices |
The cultivation of wheat dates back about 7 000 years. It originated in the western part of Asia, gradually spreading to nearly all other regions in the world. It is not surprising, therefore, that wheat, together with rice, are the two most important and common food staples in the world.
Wheat production has grown considerably over the past two decades and in recent years its global production has reached around 550 million tonnes. The total wheat output of the developing countries accounts for over 40 percent of global wheat production, with China the world's largest producer.
Wheat is the most important cereal traded on international markets. The total world trade in wheat and wheat flour (in grain equivalent) is close to 95 million tonnes, with the developing countries accounting for some 80 percent of imports. This is mainly because, despite a relatively large wheat output in the developing world, overall consumption outpaces production. As populations move from countryside to town, there is increasing demand for convenient foods such as bread. The United States ranks as the world's largest wheat exporter, normally contributing around one-third of world export volume.
Wheat is the major commodity provided as food aid. In 1992/93, for example, wheat accounted for just over half of the 15 200 tonnes of the cereal shipped as food aid to developing countries.
|
|
Rice is the staple food of almost half the world's population, but very little of the total production is traded on world markets. |
Indices |
Developing countries account for about 95 percent of production and about 80 percent of trade in rice. Most of the rice, a staple food for almost half the people in the world, is consumed in the countries where it is produced. Only about 3-5 percent of rice produced is traded on the world market.
Different countries and regions have specific preferences for particular kinds of rice. Australia, the northern part of China, the Republic of Korea, Japan and Italy, for example, eat short/medium grain rice of the Japonica type. The preference in most parts of Asia and Africa is for the long grain or Indica type.
Further preferences exist within these broad categories. The varieties of Japonica rice consumed in Italy, for example, are not acceptable to consumers in Japan or the Republic of Korea.
Different countries also prefer different kinds of processing: in Bangladesh, people like parboiled rice (rice that is dehusked after being steamed); in Jordan, the preference is for camolino rice (rice treated with paraffin oil), and the Senegalese like milled white rice with a high proportion of broken grains.
Rice is one of the most difficult food commodities in which to trade because of rigid consumer preferences, the small quantities involved and the dependence of production on local climatic conditions. Fluctuations in prices on international markets can be large, adding to the uncertainties or providing this essential food.
|
|
Outside of the major jute producing countries, the spread of synthetic products has reduced demand so that international trade in jute is declining. |
Indices |
Jute is a fibre crop which is used mainly for sacking, but efforts are being made to diversify into other end-uses. The principal producers of jute are Bangladesh, China, India, Myanmar, Nepal and Thailand. Despite the significant role played by jute in these Asian economies, the increasing use of synthetic substitutes such as plastics has made serious inroads into the global trade.
Being a natural fibre, jute is biodegradable and as such "environmentally friendly". The principal products such as sacks, can be re-used and, as a result, may have a secondary value for other users. Despite such positive features, the world market for jute has remained depressed.
In recent years, world production of jute has been about 3 million tonnes per year, of which 300 000 tonnes are traded internationally in the form of raw fibre and 900 000 tonnes in the form of products. The world trade in jute products is dominated by the following, in order of importance: sacking, yarn, hessian and carpet backing.
In the mid-1960s about 20 percent of world jute was processed in developed regions. This share has now fallen to around 5 percent. This decline results from the increased concentration of jute processing industries in the major producing and consuming countries of Asia coupled with a decline in overall consumption elsewhere because of the spread of synthetic products.
|
|
Shrimp cultivation is a growing industry in several developing countries and a major source of export earnings. |
Indices |
Fish products are an important source of foreign exchange earnings in many developing countries. One success story is the trade in shrimp, a particularly high-value product.
In 1995, Thailand's harvest of the black tiger shrimp (Penaeus monodon), which accounts for more than one-quarter of world production of warm-water shrimps, exceeded 250 000 tonnes, confirming the country's position as the top farmed-shrimp producer. Almost half of the United States' shrimp imports consist of this species. Production of black tiger shrimps, found throughout Asia, is growing by an estimated 20 percent a year.
Trade in shrimp products has doubled in the past decade to reach 1 million tonnes but increases in aquaculture production have led to instances of market saturation, accompanied by dramatic falls in prices.
Shrimp prices also reflect fluctuations in consumption: traditionally, demand is high at Chinese New Year in Asian countries with large Chinese communities, while in Japan (the world's largest importer) demand generally slackens in February, the coldest month.
As shrimp cultivation has expanded, disease, water pollution and inadequate quality control have all had a major impact on production and trade. Thailand, China, India, Cambodia and Bangladesh have experienced severe financial losses, mainly as a result of diseased stock. The most serious decline was reported by China in 1993, when production fell from 220 000 to 35 000 tonnes. Income loss was estimated at US$ 9 770 million.
GATT and the World Trade Organization

Policies designed to protect industry and agriculture in the developed countries make it hard for developing countries to compete in the world market. Some major developed countries sell their products at less than the cost of production, doing serious damage to non-subsidizing countries, particularly the developing country farmers.
In 1993, total support provided to agricultural producers in OECD countries amounted to US$ 163 000 million. This gives their farmers an advantage in world markets, and has led to overproduction. In 1993, one-fifth of the European Community Common Agricultural Policy budget was spent on storing its food surpluses. Producers in developed countries are also protected by tariff barriers. These tend to rise with the degree of processing involved -the tariffs for metal products and clothes, for instance, are double those for metal and cloth and four times those for metal ores and cotton. Quotas and quality controls also deter imports into their markets.
Such obstacles discourage developing countries from exporting processed agricultural products. Agricultural protectionism alone is thought to cost them US$ 100 000 million a year in lost revenues.
The General Agreement on Tariffs and Trade (GATT), signed in 1948, and the United Nations Conference on Trade and Development (UNCTAD), set up in 1964, have provided fore for negotiations on trade liberalization with some success. When GATT was established, tariffs accounted for 40 percent of the price of imported goods, on average. Today this has fallen to 5 percent.
FAO provided technical support for the latest set of GATT negotiations, the Uruguay Round, which was successfully completed in April 1994 and was the first to include agriculture significantly. As a result of the negotiations, GATT has now become the World Trade Organization (WTO), set up to monitor and regulate international trade, and to oversee the implementation of the Uruguay Round agreements. Although the reductions in subsidies and trade barriers in agriculture are small, they are expected to add over US$ 9 000 million to the value of developing countries' agricultural exports by the year 2000.
Regional trade agreements are increasingly important. The European Union (KU) has just been expanded to 15 members. The North American Free Trade Agreement (NAFTA), signed by Canada, Mexico and the United States in 1992, will abolish most trade barriers between its members and is expected to attract new members from Latin America. Other regional agreements include MERCOSUR in Latin America, CARICOM in the Caribbean, ASEAN in Asia and COMESA in Africa, among others.
Effect of the Uruguay Round on future
international food prices
Click here to see the statistics![]()
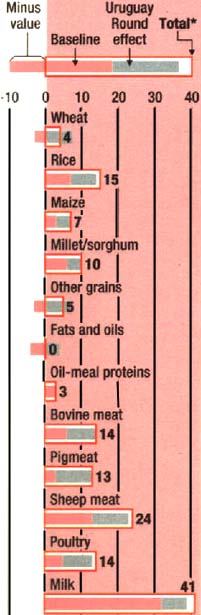
*Total does not necessarily equal the sum of the
two effects
Agricultural trade of developing countries

The actual values shown include tariffs and other policy effects and forms of protection. The baseline is a projection for the year 2000 on the same basis. The Uruguay Round effect demonstrates how an adjustment in tariffs will increase trade.
| PREVIOUS FILE |


