
 FAO works to promote coherent approaches to sustainable land and water management.
FAO's work in land and water is relevant to several dimensions of sustainable development, such as the governance and management of food production systems; the provision of essential ecosystem services; food security; human health; biodiversity conservation; and the mitigation of, and adaptation to, climate change.
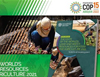
Key publication: The state of the world’s land and water resources for food and agriculture: Systems at breaking point (SOLAW 2021) Synthesis Report
This Report highlights the status, major risks and trends related to land, soil and water resources, and presents the means for resolving competition among users and generating the desirable benefits for people and the environment. It provides solutions away from the business-as-usual approach, injecting a sense of urgency in making the necessary transformation at the roots of the global food systems - water, land and soils – and inspiring uptake by decision-makers at the global, regional and national levels [Read more...]


Contact us
For more info please contact: [email protected]