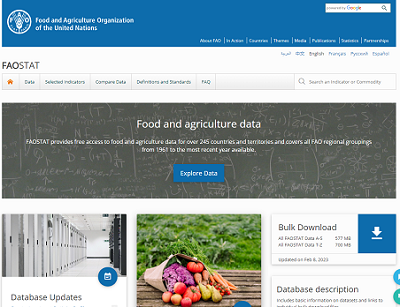
FAO food and agriculture statistics collects and disseminates timely and reliable food and agricultural statistics globally. We develop statistical methodologies and standards, and support member countries develop statistical systems through technical assistance and capacity development activities. We disseminate statistics through our dissemination platforms (FAOSTAT and RuLIS) and produce publications, working papers and statistical yearbooks that cover food security and nutrition, crop and livestock, economic, social and environmental statistics.
New Data Releases
Structural data from agricultural censuses
Structural data from agricultural censuses March 2024 update
22/03/2024

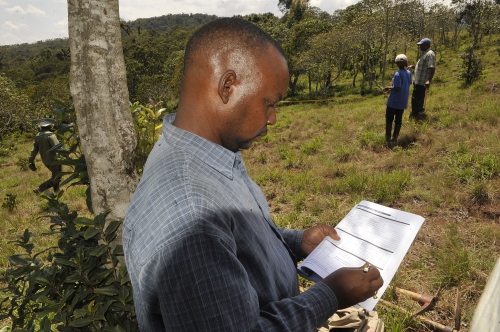
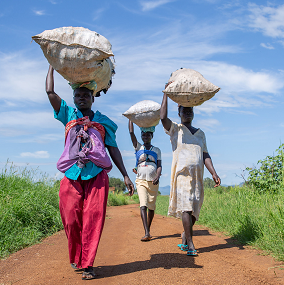
Data Collection
FAO’s work on the collection of statistical information on food and agriculture represents a core element of the Organization’s mandate. As an inter-governmental organization, FAO collects data mainly through questionnaires submitted to countries members on a regular basis. From its inception, FAO has strived to maintain the best possible capacity to collect, process, validate, harmonize and analyze incoming data and generate accurate and timely information. Improving the quality, transparency, and access to FAO’s statistical data is an important priority.
Flagship products

PUBLICATION
STATISTICAL YEARBOOK
INITIATIVE
50x2030 INITIATIVE

Related Website
World Programme for the census of agriculture
FAO, through the World Programme for the Census of Agriculture (WCA) has been supporting countries to carry out their national agricultural census since 1950.

Related Website
Voices of the Hungry
The Voices of the Hungry project developed the Food Insecurity Experience Scale (FIES) to provide timely information on the adequacy of people's access to food by asking them directly about their experience.

Related Website
Agricultural integrated survey programme - AGRISurvey
AGRISurvey provides support to countries for strengthening their agricultural survey system with the aim of producing and disseminating sound and comprehensive statistics on a regular basis to allow evidence based policymaking.