1. Proper management consists of monitoring your fish ponds regularly, keeping good records and planning ahead for the operation of your farm. On this basis, you can for example decide when to fertilize your ponds (see Chapter 6) and how much to feed your fish (see Chapter 10). You can also judge how well supplementary feeds are being utilized and how fast your fish are growing, and you can plan the stocking, transfer and harvesting of your fish. Above all, you can be well informed on how much you spend for or gain from fish farming.
2. The extent of monitoring and record keeping required depends on several factors such as:
3. It is important to define the best approach for your circumstances. Generally, the larger and more commercial the farm and the more technically qualified the staff, the more detailed the management system will be. However, it is most important that the management system is appropriate for your farm and is properly carried out. There is no point in setting up an elaborate system if it is not completely or properly used.
4. As you have already learned in a previous manual (see Section 1.8, Construction, 20), farm size, level of production and culture system may greatly vary. Small-scale fish farming, the main subject of this manual, may be undertaken by:
5. Subsistence farmers typically produce fish part-time as part of several other part-time agricultural activities. Their main objective is to produce protein food for their families. Any surplus fish may be bartered with neighbours or sold on the local market to obtain cash.
6. Commercial farmers consider their fish farm as a small business enterprise. Their main objective is to earn money by selling fish at a profit.
7. Other farmers have a fish farm to provide protein food for their family and cash to buy other commodities. Producing fish at a profit usually remains their main objective, but on a reduced scale compared to fully commercial farmers. For the purpose of this manual, they will be referred to as semi-commercial farmers.
8. The typical characteristics of these three broad categories of small-scale farmers and their fish farming activities are summarized in Table 41. Select the category of particular interest to you and refer to the following sections:
9. As a commercial farmer, you will want to monitor your fish stocks closely. For this you have first to learn about the various indices or parameters which are commonly used to measure and compare the performances of various stocks in fish farms such as their growth, production and survival.
10. The following terms are used to describe the size of a fish stock.
(a) Initial fish stock: a certain number and weight of fish are stocked into the pond at the beginning of the production cycle. Two parameters then are:
(b) Fish stock during production cycle: a certain number and weight of fish are present in the pond. They are growing, although some of them may disappear, either escaping from the pond or dying. An important parameter is then:
(c) Final fish stock: at the end of the production cycle, similarly:
11. Concerning the changes in a fish stock at harvest or over a period of time:
(a) Output or crop weight is the total weight of fish harvested from the pond.
(b) Production is the increase in total weight that has taken place during a specified period. It is the difference between the biomass at the end and the biomass at the beginning of the period. For example: 75 kg - 55 kg = 20 kg for the period from 4 June to 4 July 1989 (30 days).
(c) Yield is production expressed per unit area. For example if 20 kg were produced in a 500-m2 pond, the yield during the period was 20 kg � 500 m2 = 0.040 kg/m2 = 4 kg/100 m2 or 400 kg/ha.
(d) Production rate is the production expressed per unit of time (day, month, year, etc). For example,. if 20 kg were produced in 30 days, the daily production rate would be 20 kg � 30 days = 0.66 kg/day.
(e) Equivalent production rate is the yield expressed per
unit of time, usually per day or per year = 365 days. It enables you to compare
productions obtained in various periods. For example 400 kg/ha produced in 30
days are equivalent to (400 x 365) � 30 = 4 866.7 kg/ha/year. It may be also
useful to indicate the average daily production rate, which
in this case is
4 866.7 � 365 = 13.3 kg/ha/day or
1.33 g/m2 /day.
(f) Survival rate is the percentage of fish still present in the pond at the end of a period of time; it should be as close as possible to 100 percent; for example, if there were 1200 fish at the beginning of the period and 1 175 fish at the end, the survival rate during that period was [(1 175 x 100) � 1200] = 97.9 percent; mortality rate was 100 - 97.9 = 2.1 percent.
Note: in pond farming it is usually not possible to calculate survival rate for a fish stock during the production cycle. You will therefore have to estimate it and select a suitable value based on past experience, taking into account species, water quality and losses from predation or poaching.
Example
Your pond (312 m2 ) has been stocked with 680 fish, and an initial biomass = 5.6 kg. By the end of the production cycle (149 days) output is 43.8 kg = 450 fish. You may then calculate the following data:
12. A fish stock is made of individual fish for which the following parameters are usually estimated:
(a) Average weight (in g) is obtained by dividing the biomass (in g) by the total number of fish present.
(b) Average growth (in g) is the increase in the average weight over a given period of time. It is the difference between average weight at the beginning and end of a period.
(c) Average growth rate is the growth expressed per unit of time, usually one day. It is then called the daily growth rate obtained by dividing growth during a period by duration of this period in days. It is calculated either for a given period during the production cycle or for the whole cycle.
Example
From the example above, initial average weight was 5600 g � 680 fish = 8.2 g, and final average weight was 43 800 g � 450 fish = 97.3 g, therefore:
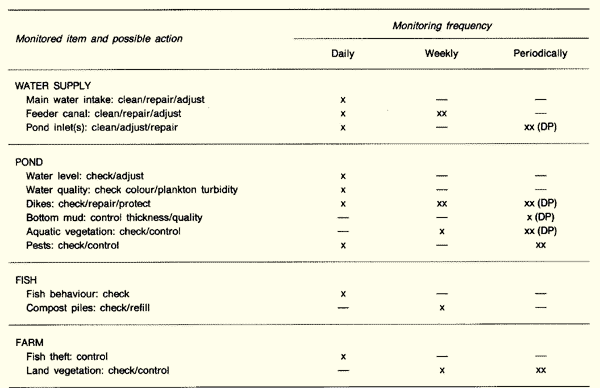
1. At least once a day, the farmer should visit the ponds and check that:
2. The best time for such a daily visit is early in the morning, when dissolved oxygen conditions may become critical (see Section 2.5), and the farmer can help the fish to remain in good health. See Table 42 for a list of useful items to check.
3. It possible, a second visit should be made to the ponds in the late afternoon, especially during critical periods, when measures can be taken to ensure that the fish remain in good health during night time.
4. More complete checks should be made once a week and periodically (Table 42):
5. Whenever the ponds are drained, carefully check and repair all water control structures. Control the pond vegetation and, as far as possible, various animal pests. Clean the ponds of excessive mud and use it to fertilize your garden.
6. At all times, try to keep the land vegetation properly controlled and use it for composting (see Section 6.4); protect your pond against poaching (see Section 4.8).
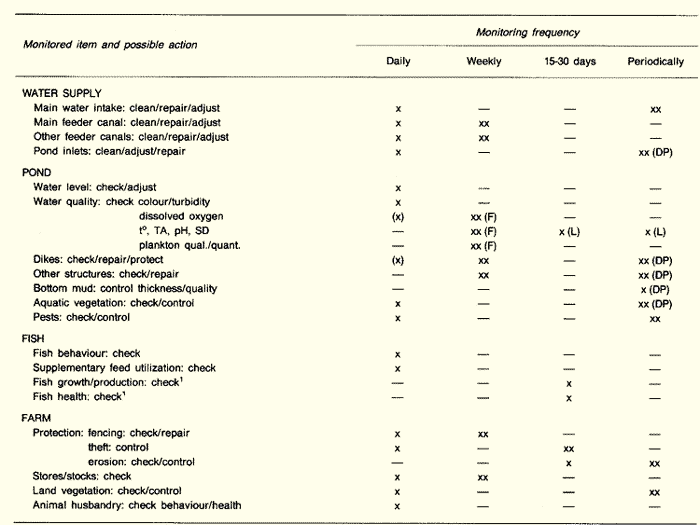
1. At this level, monitoring becomes more important. As the culture system becomes more and more complex and the management level intensifies, monitoring becomes also more difficult. See Table 43 for a list of useful items to check. However, the table may have to be adapted to your own needs.
2. Make sure to tour your fish farm at least once a day and carefully check the following areas.
(a) Main water intake, feeder canals and pond inlets should provide an adequate water supply to all your fish, particularly in storage ponds and in the hatchery.
(b) All pond structures are functioning well.
(c) Water quality in all ponds is good. Judge this by experience:
(d) Utilization of supplementary feeds is good. Adjust the feeding ration accordingly (see Section 10.3). Watch the fish if feeding directly.
(e) All vegetation (both in the ponds and around them), all animal pests (including roaming cattle) and poachers remain well under control.
3. Plan this visit of your fish farm early in the morning, especially during periods when dissolved oxygen may become critical (see Section 2.5).In such periods, a second visit in late afternoon should also be made to prepare the ponds for the night.
4. Once a week, preferably always on the same day of the week, make more complete checks on the water control structures and organize major repairs. If you are fertilizing and liming your ponds regularly, take additional care to check the water quality for temperature, Secchi disc transparency and, if possible, dissolved oxygen, pH and total alkalinity. Measure plankton and check on its general composition. This is particularly important in nursery ponds. If you have feeds, fertilizers, liming materials, etc., in store, regularly check quantities available and prepare orders for items in short supply.
5. After complete draining of a pond or before refilling it with water, carefully check its dikes and other structures for leaks and damages and repair them properly. Fully control bottom mud, aquatic vegetation and animal pests as necessary. If your property includes hilly grounds, protect their slopes against erosion (see Section 4.1).
6. You should regularly check on the growth and health of your fish. If you use low cost and/or occasional inputs such as fertilizers or supplementary feeds, this can be done at monthly intervals. But if you spend much money on feeding your fish, it is best to check them more often, every two weeks for example.
7. There are several reasons why you should monitor your fish regularly:
8. To check on the fish stock present in a pond, a reliable sample of it should first be obtained by fishing in one of several ways such as seining or using a cast net, a lift net or a trap net (see Sections 8.2 and 8.3). Generally fishing is best done at a feeding place, 15 to 30 minutes after distributing some food to attract and concentrate the fish in a relatively shallow part of the pond.
9. Remember that a good sample should contain:
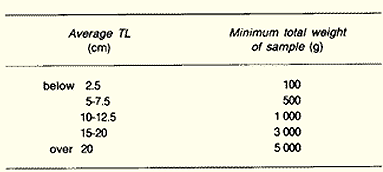
10. In practice, it means that you should fish at least 1 to 2 percent of the total number of fish present. For guidance, you may also use the chart below giving average total length (TL) of fish and minimum total weight of the sample to be obtained.
 |
 |
11. Once you have obtained a good fish sample, proceed as follows.
(a) Determine and note total weight of sample (see Section 8.6).
(b) Count all fish and note total number of fish.
(c) Carefully examine 10 to 15 fish for signs of diseases or parasites. If necessary, take some of them back to your work area for closer examination under a microscope (see Section 15.3).
(d) Stock the live fish back into the pond as soon as possible.
12. If you have a mixed fish population in the pond you not only need to collect a larger sample but must also proceed in steps.
(a) If you have several groups of sizes such as fry, fingerlings and food fish, first grade your sample by sizes (see Chapter 12). Then measure each group separately.
(b) If you have several fish species such as common carp and tilapia, first sort out your sample by species (see Section 121). Then measure each species separately.
13. Later, enter these data into your pond records (for example see Section 16.6). You may then easily calculate various parameters (see Section 16.0) to assist you in evaluating the performance of management since the last check such as:
14. Based on past experience, either at your own farm or at a neighbouring fish farm, these parameters should then enable you, if possible:
1. The main motivation for a commercial or semi-commercial farmer is to earn an income from producing and selling fish. How much money is earned, namely the profit, can be related to two basic kinds of factors of production.
(a) The fixed factors of production are the main capital or investment items that do not change in size from day to day and last several times longer than each production cycle. These are for example land and water (or access to their use), fish ponds and their structures, service buildings, items of equipment such as vehicles, pumps, a food mixer, an oxygen meter, tools and seine nets.
(b) The variable factors of production are the main running or operation items that are required in varying quantities according to the fish production level. These are for example fish juveniles to be stocked, fertilizers, feeds, fuel, spare parts for vehicles and other equipment. Labour, either the farmer's own or others' labour, is also a variable factor of production.
2. To earn money, a commercial fish farmer must first pay for these factors of production. Everything spent to run the fish farm is part of these costs, typically referred to as operating costs. These are described accordingly as:
3. The fixed operating costs remain the same whatever the amount of fish produced in a given farm. They are related to the fixed factors of production. The most important of these are the depreciation and interest costs associated with the investment and the costs of annual water rights, lease on land, licences and other fixed payments such as interest on loans.
4. The variable operating costs or running costs are those costs that are directly related to the production of the farm and correspond to expenditure on the variable factors of production described above.
Note: an additional category is also sometimes used - semi-variable operating costs - which are those which vary to some extent with production level, but may not be directly linked. These could include management costs, smaller equipment whose life span depends mainly on its usage, office expenses.
5. The relative importance of these costs varies according to the culture system and the farmer's category.
(a) Apart from the fixed cost of pond construction (often built through the farmer's own labour), costs are very low and almost negligible for subsistence farmers.
(b) They are slightly higher for semi-commercial farmers.
(c) They rapidly increase for commercial farmers, as the culture system intensifies and production level increases. They must then be routinely taken into account and managed.
6. In all cases, however, it is important to identify the costs as realistically as possible, to avoid wasting time, money or other resources on inefficient or unprofitable operations.
7. As time goes on, long-lasting factors of production such as ponds, buildings, equipment and vehicles wear out.
8. In the short term, they are kept in serviceable condition through maintenance, including the purchase of materials and spares, and labour required for repairs.
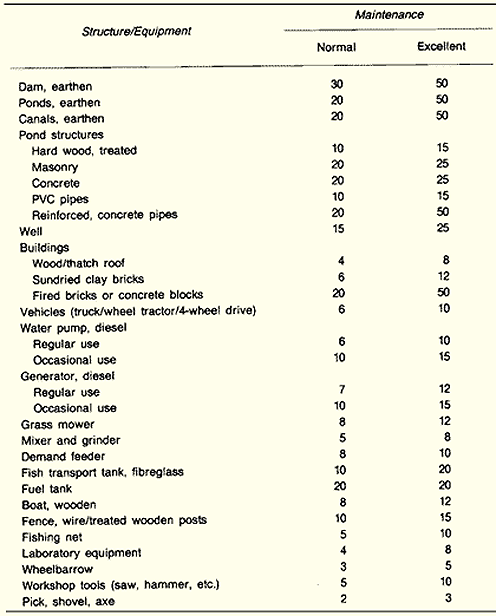
9. After a certain number of years they have to be replaced or renovated. This period is called the useful life. Useful life varies, as shown in Table 44. Some factors such as buildings and ponds have a very long useful life, while other factors such as wheelbarrows or nets may wear out within only a few years.
10. Remember that careful use and very good maintenance can increase the useful life of most of these factors of production by at least 50 percent. On the contrary, negligence and inadequate maintenance can greatly reduce useful life.
11. When long-lasting factors of production reach the end of their useful life, they are normally replaced. If the item can be sold or still has some value at this stage, it will have a residual value. To replace the item, the farmer will need an amount equal to the replacement cost less the residual value.
12. The amount of money that should be set aside each year by the farmer for the replacement of a particular item is called its depreciation cost. When this amount is set aside in equal sums each year of useful life it is known as: the annual depreciation cost. Such costs are particularly important for a commercial farmer who has spent a lot of money on constructing ponds and buying various equipment that lasts a long time.
13. As each item gradually wears out, its value depreciates. Each year the cost of replacing a particular item with a new one decreases by its annual depreciation cost, a fact which you will learn to use later when taking stock of your fish farm (see Section 167).
14. To calculate the simple annual depreciation cost for any item, simply divide the replacement cost, minus the residual value (if any), by its useful life. For example, if a replacement building would cost US$5000 and the old one provides US$1 000 worth of materials, scrap, etc., and if its useful life is expected to be 20 years:
15. If savings are used to pay for the fixed factors of production (the investment costs), the farmer loses the potential interest on this money, interest which would have been available from the bank if the money had been placed there instead. Alternatively, if the money was borrowed from the bank or elsewhere, interest has to be paid for the use of the money. This is called the interest on capital investment.
16. If the farmer has to use or borrow money to cover operating costs before income arrives from sales (this money is known as working capital), interest costs would also be involved.
17. Interest costs are usually insignificant for small-scale farmers, but should be taken into account when calculating operating costs for semi-commercial or commercial farms of some importance.
18. The money a fish farmer obtains through selling fish constitutes an income. Assuming prices are similar, this income increases as the quantity of fish sold - the farm output - increases (see Diagram 1, end of section 16.7).
19. However, to produce fish, a commercial farmer must have access to, and use the factors of production, which in turn cost money. Total costs of production therefore also increase with output.
20. The profit made by a fish farmer is the difference between sales income and total costs of production (see Diagram 2, end of section 16.7).
(a) For semi-commercial farmers with relatively small investments in fixed factors of production and with limited working capital needs, depreciation and interest costs may be neglected. However if you do not include a cost for you or your family's time, the profit will be equivalent to your earnings.
(b) For commercial farmers with a higher investment in fixed factors of production, two kinds of profits should be considered:
21. Whenever income is greater than total costs, there is a real profit from fish farming. If this is not the case, there is a loss, and measures will have to be taken to change this situation (see Section 16.7).
22. In Sections 16.5 and 16.6, you will learn how to keep good records on your fish farm to be able to know, at regular intervals, your total income from fish sales, your related operating costs and, if necessary, your depreciation costs. From these data, commercial farmers will obtain an estimate of gross and net profits. They will then be able to assess in a more precise way their performance as a commercial fish farmer and to improve this performance through management practices (see Section 16.7).
1. Subsistence fish farmers need only keep simple records, which should enable them to know, month by month:
2. At the end of the year, the above records will provide information on:
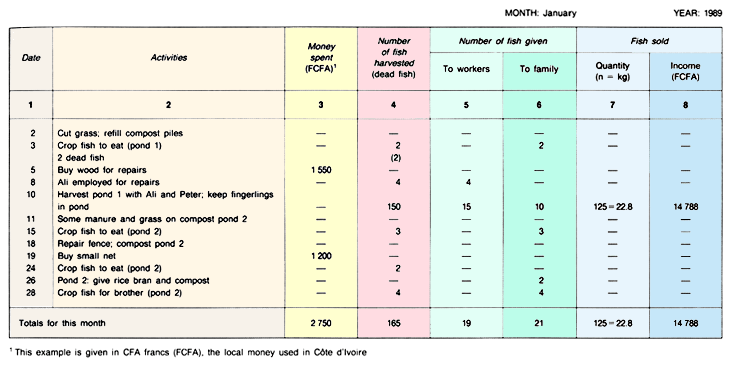
3. A simple form can be used day by day to record for one month all activities around the fish farm, every amount of money spent and all the details of fish production. This is called the daily record form (Form A). You may prepare a form similar to the example below in a small school copybook, using two facing pages per form. Prefer squared paper. You will need 12 forms for one year of records.
4. Any activity, such as work done on the fish farm and items of equipment purchased for it, should be immediately noted down together with such relevant data as money spent, number of fish harvested, and number of fish given or sold. It is important to note these details as soon as they are available. Do not leave it for the next day (or even later), because delay will result in errors and bad records.
5. It is best to always carry with you a small pocket notebook and a pencil or pen to be able to note at any time and on the spot whatever you wish to record. At home, preferably on the same day, transfer these draft notes on to your daily record form. Then cross out from your pocket notebook the transferred data thereby avoiding any duplicate transfer that would also result in errors and bad records.
6. Each form is used for one month. At the end of the month sum up the various columns to obtain the totals for the month.
Example
You have two small fish ponds (150 m2 and 195 m2) where you produce Nile tilapia for your family needs and sometimes for bartering or selling locally. Your fish feed mostly on natural food produced through in-pond composting of your farm wastes. You use casual labour only for major jobs and pay it in kind, mostly with fish from the ponds. For the month of January 1989, your daily records (8 columns) are as shown in Form A.
Remark on the following points.
(a) Column 2: be short but precise in recording activities. For example, on 3 January, you crop some fish to eat and remove some dead fish - mention from which pond you take them. On 8 January, note the name of the labourer employed. On 28 January, note to whom you give some fish. If possible, note how much time you and your family spend.
(b) Column 3: note how much you pay in cash in local money for items you have to buy.
(c) Column 4: note the numbers of fish harvested and in brackets the dead fish.
(d) Column 7: when selling fish on 10 January, note the number (n) of fish but also, as far as possible, the total weight (in kg). This will help you to obtain the average weight of each fish later.
(e) Column 8: note for how much local money you sell your fish. This is called your income, in cash.
(f ) At the end of the month, add up the numbers in columns (3) to (8). In January 1989, you spent FCFA 2 750. You harvested 165 fish, of which you gave 19 to casual workers and kept 21 for your family. You sold the rest (125 fish weighing 22.8 kg) to your neighbours for a total cash of FCFA 14 788.
(g) Check your calculations: add the total number of fish from columns (5), (6) and (7). This should equal the total from column (4). Here you have: 19 + 21 + 125 = 165 fish.
7. Prepare one simple form, in which you transfer at the end of each month the totals obtained at the bottom of the above daily record form. It then becomes very easy at the end of the year to sum up these totals to see how well (or how badly) you managed your fish farm. This simple form is called an annual balance sheet (Form B). It provides a summary for a whole year of all costs and incomes related to fish farming.
8. It is best is to prepare such an annual balance sheet (see the example below) at the back of the same school copybook as suggested above for your 12 daily record forms. By doing so, you group all your fish farm records for each year in a single book.
Example
Following the above example for January 1989, transfer these totals in early February on to your annual balance sheet for 1989 (Form B). Every month, make a similar transfer. Complete column (6), adding (4) and (5) to obtain the total number of fish given each month. Then at the beginning of 1990 proceed as follows.
(a) Sum up the data in each column from (2) to (8) separately to obtain the totals for 1989.
(b) Calculate the average weight of the fish harvested from column (7) as total weight divided by total number. Remember that 1 kg = 1000 g.
(c) Calculate the average price of one kilogram of fish during 1989. Divide total income from fish sold (column 8) by their total weight (column 7).
(d) To obtain the total weight of fish given away, multiply their average weight, as shown in (b), by total number of fish given (column 6).
(e) Obtain the total value of fish given away. Multiply the average price, as shown in (c), by total weight given as shown in (d);
(f Determine the total value of the fish harvested in 1989. Add this last total value of fish given, as shown in (e), to the total income from fish sold (column 8).
(g) Evaluate how well (or how badly) you have managed your fish farm during the year. Subtract from the total value of fish harvested, as described in (f), the total money spent (column 2).
(h) If the result is positive, you have gained from fish farming. Estimate if possible (making a note in your records) how much time you and your family have spent for the money earned.
(i) If the result is too small or negative, you should carefully review your daily records to determine for example:
|
Average weight of fish harvested = (column
7) = 222.8 kg or 222 800 g � 906 = 246 g |
1. Semi-commercial fish farmers should keep similar but more detailed records of expenditures and production, for example:
2. If fish farming earns a major income for the farmer, he or she should try to adopt at least some of the suggestions made later for commercial farmers (see Section 16.6).
3. A simple form (Form C) is suggested in the example below to be used to record each month all activities, expenditures and fish production around the fish farm. This is a daily record form with the following characteristics, as shown in the example:
4. Remember to adapt your daily record form to your own needs. You may for example have a different number of ponds, or wish to keep a count of the number of hours spent at work. Prepare such forms preferably in a school copybook with squared paper, using two facing pages per form. You will need 12 forms per year.
5. Note immediately any activity and related data on the spot if possible. Leaving it for later will cause errors and result in bad records. Carry a small pocket book and pencil/pen with you to be able to make notes in draft form. At home, transfer as soon as possible these notes to the daily record form. Then cross out the transferred notes from your pocket book to avoid duplicate records and additional errors.
6. At the end of the month, sum up the various columns (3) to (13) to obtain the totals for this particular month.
Example
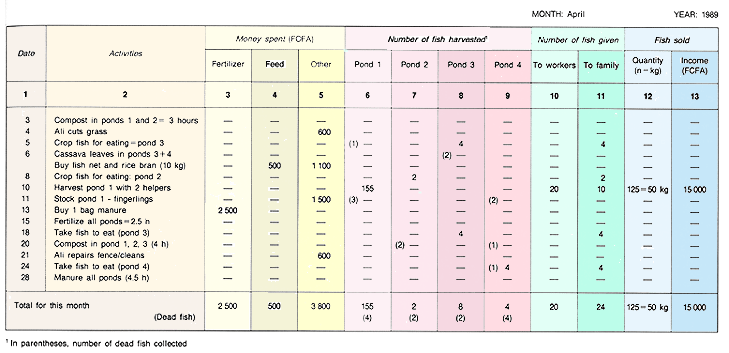
Your fish farm is made of four small ponds (about 200 m2 each) where you produce common carp. Part of the harvested fish is kept for the family or given to casual labourers. Most of the fish is sold locally, to neighbours or to a market nearby. Composting and manuring are used to increase natural food production. Some cheap supplementary feeding is distributed from time to time. Casual labour is used for major activities but paid in kind with harvested fish. For the month of April 1989 your daily records (13 columns) are as shown in Form C.
Remark on the following points.
(a) Column 2: be concise but precise in recording activities. On some days you may carry on several activities (6 April). Some activities do not result in an expenditure or a harvest (fertilization on 3, 15, 20 and 28 April) but it is then useful to note how much time you have spent on them (in hours).
(b) Columns (3) to (5): note down how much you pay in local money (here FCFA), in cash, for items you have to buy.
(c) Columns (6) to (9): note also (in brackets) the number of dead fish found.
(d) Column (12): when selling fish (April 10) note the total number (n) and the total weight (in kg).
(e) Column (13): note how much local money you receive when selling your fish. This is your income in cash.
(f ) At the end of the month, add up the numbers in columns (3) to (13) to obtain the totals for April 1989.
(g) Check your calculations:
7. Prepare an annual balance sheet (Form D) similar to the one shown in the example below but adapted to the data recorded on the above daily record forms. It is best to do this at the back of the school copybook containing the latter, so that all records for one year are grouped under one cover.
8. At the beginning of each month, transfer the totals obtained for the previous month at the bottom of the daily record form. Complete columns (5), (10) and (13) providing totals of money spent, fish harvested and fish given away during the month.
9. At the end of the year, add up all columns (except 11 and 12) to obtain data on total expenditure, total production and total income during the year under review. From these data, estimate what was the net gain (or net loss) obtained from fish farming. This gives you a measure of how well (or how badly) you managed your fish farm during that year.
(a) The higher the gain the better the management. Try to increase this gain, or profit, every year by improving your management.
(b) If the gain is too small or if there is a loss, carefully study your daily records to find out possible reasons such as:
Example
Following on the above example for April 1989, a completed annual balance sheet (Form D) is obtained in early 1990, after transferring each month the daily record totals. Columns (5), (10) and (13) have been completed each month. Then proceed as follows.
(a) Add up the data in each column (2) to (15), leaving out columns (11) and (12), to obtain the totals for 1989.
(b) Calculate successively as shown:
(c) Estimate net gain (or loss) from fish farming in 1989 by subtracting the total expenditure (column 5) from this total value of fish harvested; it amounts to FCFA 162 324.
(d) Compare this gain with those obtained in previous years and with those observed under similar conditions in neighbouring farms.
(e) Draw conclusions about the quality of your management during 1989. Try to identify ways and means of doing better in 1990 by studying all your records.
|
Average weight of fish harvested (column 14) = 226.9
kg or 226 900 g � 1013 = 224 g |
1. As small-scale fish farming becomes a more fully commercial venture, maintaining detailed and accurate records becomes an important task to be carried out regularly by the farm manager for several reasons.
(a) Pond management records will be used for analysing the production in each pond as well as for determining the reasons for good or poor results.
(b) Financial records of all transactions, both in kind and in cash, will keep the manager well informed on expenditures and incomes. These records will enable the manager to check how well the farm is doing as a commercial enterprise.
(c) Good records will provide a sound basis for future management practices and their accurate planning and financing well in advance.
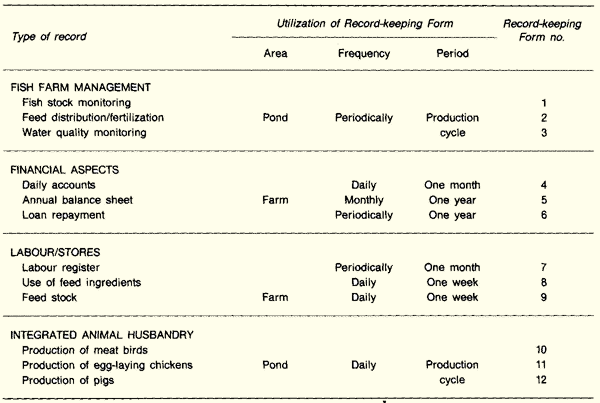
2. There are several types of records which may be used in managing such an enterprise, covering the following components:
3. Table 45 provides an outline of possible records which may be used and which are discussed in the following paragraphs. You can select those which are of most interest to your own enterprise. It is best for you to buy a small pocket calculator or a calculating machine to ensure the accuracy of your calculations. Closer checks are easier if your machine provides a printed record of these calculations.
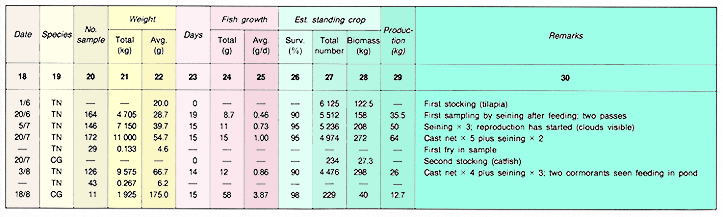
4. The separate form which should be maintained for each pond is subdivided into three parts (Record-keeping Form 1).
5. The stocking data section (columns 1 to 6) includes date, species (abbreviated such as TN for Tilapia nilotica and CG for Clarias gariepinus), number of fish, their total weight (in kg) and average individual weight (in g). The origin of fish, their price, their condition, etc. may be noted under Remarks. Total stocking weight (initial biomass) appears at the bottom of column 4.
6. The harvesting data section (columns 7 to 11) includes date, species (abbreviated as above), number of fish, their total weight (in kg) and average weight (in g). From these, the following parameters are calculated for the monitoring section (see also Section 16.0).
(a) Fish production (in kg, column 12) for each species and weight class (if some species have reproduced in the pond, such as here T. nilotica). Production is equal to output, except at final harvest for the fish which have been stocked originally, when production is equal to output minus stocking weight. For example, 368.9 kg of large-sized TN are harvested on 15 November. Their production equals 368.9 kg - 122.5 kg = 246.4 kg.
(b) Duration of production cycle (in days, columns 13).
(c) Average production rates (in kg/100 m2 /year, column 14) are estimated for each species and weight class as [(total production kg x 365) � (pond area in 100 m2 x n days)]; for example, for large-sized tilapias, the production rate over 166 days was [(246.4 kg x 365) � (31.21 x 166 days) = 17.36 kg/100 m2/year.
(d) Average pond production rate for the total stocks during the period (in kg/100 m2/year) is obtained in a similar way on the bottom line of column 14 from total production = total yield - total stocking weight; for example, 601.5 kg - 149.8 kg = 451.7 kg and (451.7 kg x 365) � (31.21 x 166 days) = 31.8 kg/100 m2/year.
(e) Average daily growth rates of fish (in g/day, column 15) are estimated as [(average weight at harvest - average weight at stocking) � n days]. For example for tilapias it was [(122.7 g - 20 g) � 166 days] = 0.62 g/day.
(f) Survival rates (in percent, column 16) are obtained by comparing for each species, number of fish stocked (NS) to total number of fish harvested (NH), as: [(NH x 100) � NS]; for example, for tilapias where NH = 150 + 3 007 = 3 157, survival rate was [(3157 x 100) � 6125] = 51.5 percent; you could check this against mortalities actually noted.
(g) Under Remarks (column 17) note further information such as sale price of fish, destination after harvest, fish condition, etc.
7. The section for periodical checks on fish stocks (columns 18 to 30) includes all data obtained from fish samples such as date of sampling, species, number of fish in sample, their total weight (in kg) and average weight (in g). From these, the following parameters are calculated (see also end of Section 16.0).
(a) Duration of period under study (n days since last sampling, column 23).
(b) Average growth of individual fish during the period (in g, column 24), obtained from column 22 as the difference between actual and previous average weights.
(c) Average daily growth rate of individual fish (in g/day, column 25). Divide average growth (column 24) by number of days (column 23).
(d) Estimated survival (in percent, column 26). Arbitrary value based on previous experience and records, and on the past history of this particular fish batch stocked in the pond.
(e) Estimated total number of fish present In the pond (column 27). Multiply number of fish present at the start of this period (column 27, one line above) by percent survival (column 26). For example, for June 19, this estimate is (6 125 fish x 0.90) = 5 512 fish.
(f ) Estimated biomass of fish present (in kg, column 28). Multiply average weight (column 22) by number of fish present (column 27).
(g) Estimated fish production during period (in kg, column 29). Subtract fish biomass present at start of period (column 28, one line above) from biomass present today.
(h) Under Remarks (column 30) note any observation or information useful to aid understanding of the pond conditions, such as details of sampling procedure, appearance of new weight class attributable to in-pond reproduction of certain species, etc.
Note: to avoid errors, introduce in this table some of the data on stocking, as shown in Record-keeping Form 1 for June 1 (tilapia stocking) and July 20 (Clarias stocking).
|
Periodical checks on fish stocks
 |
8. A simple record suitable for each pond to be used, together with theprevious Record-keeping Form 1, is shown in Record-keeping Form 2. It consists of two collections of data on:
9. Data on feed distribution (columns 31 to 40) include:
(a) Period during which feeding characteristics were unchanged. This usually corresponds to the period elapsing between two successive samplings of the fish stocks for monitoring purposes (see above).
(b) Duration of this period (in days, column 32).
(c) Estimated biomass of fish present in the pond (in kg, column 33). Obtain this value for the first day of the period from Record-keeping Form 1, column 28.
(d) Feed type (column 34) abbreviated such as BW brewery waste, RB rice bran, CC cottonseed cake. It may also be a more elaborate mix of various ingredients which could be referred to by a code number such as 154, 823, etc., described separately.
(e) Daily feeding rate (DFR, in percent of fish biomass per day, column 35). Value is selected according to local conditions (see Section 10.3).
(f) Feed ration to be distributed regularly during the period (in kg/day, column 36). Multiply fish biomass (column 33) by DFR percent (column 35). For example for the period from 19/6 to 3/7/89, distribute 158 kg x 0.33 = 52 kg of brewery waste per day.
(g) Number of feeding days (column 37). As fish are usually not fed every day of the week, at the end of the period indicate how many days feed was distributed in the pond.
(h) Total weight of feed distributed during the period (in kg, column 38). Multiply the daily ration (column 36) by number of feeding days (column 37).
(i) Food conversion ratio (FCR, column 39) or weight of feed distributed per kg of fish produced (see this manual, Section 10.3). Divide the total weight of feed given (column 38) by the fish production during the period (Record-keeping Form 1, column 29). For example for period 4/7 to 18/7, FCR = 372 kg � 64 kg = 5.8.
(j) At the bottom of the form, obtain the overall FCR for the production cycle in a similar way, after adding up columns 37 and 38.
(k) Under Remarks (column 40) add any information useful to the interpretation of results such as feed quality, type of mix, feed cost, fish behaviour, water quality, etc.
10. Data on pond fertilization (columns 41 to 44) include:
(a) Date on which fertilizer is distributed to the pond.
(b) Organic fertilization (column 42), type (abbreviated for example as HM for horse manure, CM chicken manure, CS compost) and total amount distributed (in kg).
(c) Mineral fertilization (column 43): type (abbreviated for example as SP superphosphate, AS ammonium sulphate, SN sodium nitrate or N:P:K ratio such as 12:24:12) and total amount distributed (in kg).
(d) At the bottom of these two previous columns, you may easily obtain the total amounts of fertilizers used during the production cycle.
(e) Under Remarks (column 44), note further information such as method of distribution, quality of fertilizer, price, etc.
(f) If you are liming the pond, either before filling it or later, record the information either in one additional column or in column 43, for example in parentheses, with further information under Remarks.
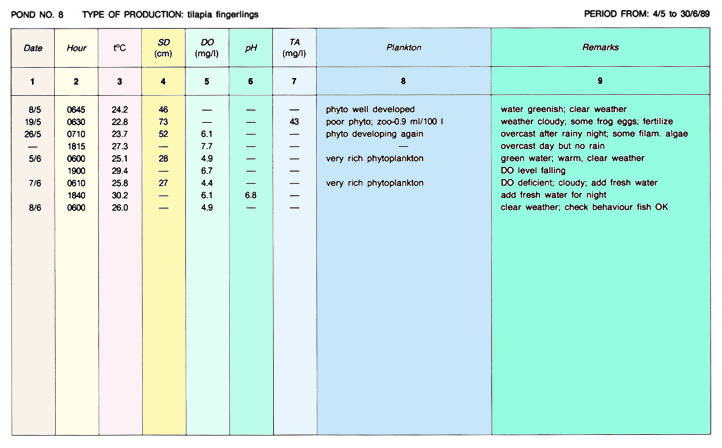
11. A simple record which can be completed separately for each pond is proposed in Record-keeping Form 3. It makes it possible to keep track of the following:
12. You may need several such forms to record the water quality parameters in a pond during one production cycle only. As for the previous records, use a small pocket notebook to note various data on the spot. Transfer these on to the record form later to maintain good records.
13. Good records of all income from fish sales and various expenditures in cash (costs) are essential to determine at regular intervals whether the enterprise is profitable or running at a loss (see Section 16.7). Good farm management should ensure not only that fish farming is profitable but that its profits remain as high as possible.
14. Daily accounts for the fish farm, set out in a monthly report system as shown in Record-keeping Form 4, include the following.
(a) Fish sales record total quantity (in kg, column 3) and related income (in local currency, column 4).
(b) Variable costs (in local currency, columns 5 to 9) include expenditures for farm inputs such as:
(c) Fixed costs (in local currency, columns 10 to 12) include expenditures regularly incurred such as:
(d) Amount of loan, if any, repaid during the month (in local currency, column 13) (see also below).
15. At the end of the month add up each column and note these total incomes and costs on the bottom line.
16. From these accounts, an annual balance sheet may easily be prepared for the complete year, as shown in Record-keeping Form 5.
17. At the end of each month, transfer the totals for the month from the daily account record (see bottom line in Record-keeping Form 4)) to your annual balance sheet, as follows:
18. Now you may readily calculate monthly values for:
(a) Total costs (column 6): add variable costs (column 4) to fixed costs (column 5).
(b) Gross profit (column 7): subtract total costs (column 6) from monthly income (column 3). If for the month your total costs are higher than your income, the gross profit is negative (figure written in parentheses), which means that during that particular month you have lost money. This is usual when, during the month, you do not harvest and sell fish to generate sufficient income.
Note: it is best to have several ponds and to plan their management so that you may obtain enough cash money from fish sales regularly throughout the year. Alternatively you will need to have sufficient cash on hand or working capital available from borrowing, or from earlier profits, to cover the periods when there is a loss.
19. At the end of the year prepare the annual balance by summing up all the columns, as shown in Record-keeping Form 5. This will clearly show you the following information.
(a) How many fish you have sold and what income you have made from this. Obtain average fish price per kilogram by dividing total income by total weight sold.
(b) How high your variable costs and fixed costs have been in comparison to previous years.
(c) What are the main periods for earning, and the main loss-making periods.
(d) How profitable has fish farming been. Remember that gross profit is only a rough guide to judge this. Later you will learn about a better estimate, net profit (see Section 16.7).
(e) How much of the borrowed money you have repaid.
20. If you have borrowed money from friends or from a bank, you should keep a record of loan repayment, for example as shown in Record-keeping Form 6. Banks are often interested in knowing if you can keep good records before agreeing to lend money.
21. For each loan, carefully note the following:
22. From this information you can determine the following points.
(a) How much you have to repay each year. Divide the total amount of loan by the duration of the loan. For example if you have borrowed US$10 000 over five years, you should repay US$10 000 � 5 = US$2 000 per year, maybe in two instalments of US$1 000 each.
(b) How much interest do you have to pay regularly. Multiply the amount of loan still to be repaid by the interest rate in percent. For example, if you have paid back US$4 000 of this loan and the interest rate is 7.5 percent/year, you will have to pay US$6 000 x 0.075 = US$450 per year. If you pay interest monthly, you will have to pay US$450 � 12 = US$37.50 each month.
Note: as soon as you repay part of the loan, for example after six months, the interest to be paid will be reduced accordingly (see Record-keeping Form 6).
23. Each time you pay either interest or part of the loan, note down in Record- keeping Form 6 the date and amount of payment. These figures can be easily transferred into the daily accounts (Record-keeping Form 4) as necessary.
24. At the end of the year, add up the two columns to obtain the total amounts of interest and loan repayment. Obtain the balance outstanding at 31 December of that year, by subtracting the total amount repaid from the balance which was outstanding on 1 January. Transfer this balance to the form for the next year.
25. If you have several workers and pay them irregularly on a daily basis, or by piece-work, you can use a labour register as suggested in Record-keeping Form 7. During the month, record each payment made to each worker, either in cash or in kind. At the end of the month add up the payments made to obtain total expenditure for labour during the month.
26. If you pay the workers a monthly wage and give no advances, you can use a simpler form for each month as follows:
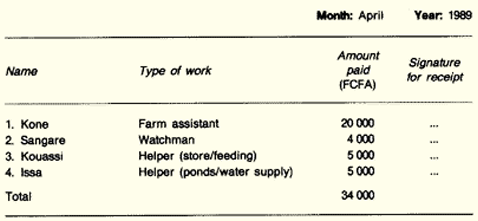 |
27. If you do give advances, it may be simpler to use the labour register described previously. If these are to be set against a monthly wage, make sure each worker signs a receipt for the advances given.
28. These forms can be especially useful if there is a dispute with one of the workers over salary payment.
Note: also do not forget to enter all data on wages into your daily accounts (see Record-keeping Form 4).
29. For good management of your farm, you need to store certain quantities of feed for your fish and, if necessary, for other animals, so that you can feed them regularly (see Chapter 10). At least once a week, you should check exactly how much feed you have remaining in stock. This should enable you to replenish your stocks in time, before they become exhausted. Good records will help you with such advance planning.
30. Two types of daily record forms are proposed to record over each week the amounts of feed ingredients:
31. The use of feed ingredients either for direct feeding of fish and other animals or for the preparation of particular feed mixes can be recorded as suggested in Record-keeping Form 8. Complete the top line of the form. A reference number can be based for example on year/month/ week as shown for year 89, month 05, week 2. List the type of feed ingredient in store in the first column. For each type of production, list the amounts of ingredients taken out of store on a particular date in one of the following columns. At the bottom, note total weight (in kg) and type of production (abbreviated). At the end of the week, add up each line horizontally to obtain the total weight of each ingredient used during the week.
32. Data on feed stocks in store can be registered as shown in Record-keeping Form 9.
(a) List the type of feed ingredient in store (column 1).
(b) Enter the stock weight of each ingredient held at the beginning of the week (column 2), transferring this from the previous week's form, column 13.
(c) Each time feed ingredient arrives, use one of the following columns 3 to 9 to note date and amount (in kg).
(d) At the end of the week, add up for each ingredient the amounts taken in stock during the week (column 10) and note their cost (column 11).
(e) Transfer from the previous form (Record-keeping Form 8) completed for the same week (note its reference number at the bottom of this form), the total quantities of each ingredient taken out of store during this week (column 12).
(f) Obtain stock in store at the end of this week for each ingredient (column 13) by adding to initial stock (column 2) the total weight taken in store if any (column 10), and subtracting the total weight taken out of store (column 12). In Record-keeping Form 9, for example, stock in store is calculated as follows:
33. You can manage your stocks of other materials, such as mineral fertilizers and liming materials, in a similar way. As movements for such items are usually less frequent than for feed ingredients, it may be possible to use forms similar to Record-keeping Forms 8 and 9 above, but on a monthly rather than a weekly basis. You may also be able to combine information on a single form, recording initial stocks, daily usage, amounts taken in store, cost and final stocks.
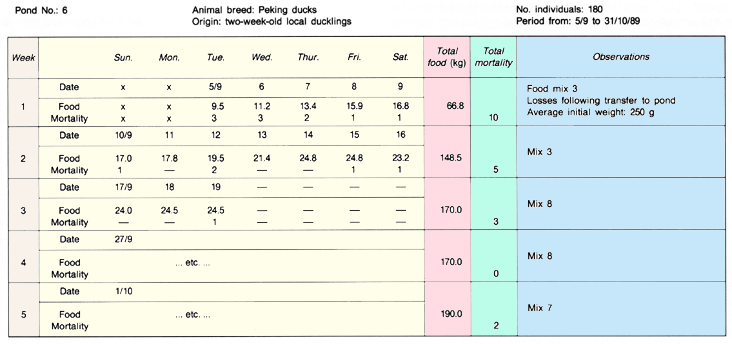
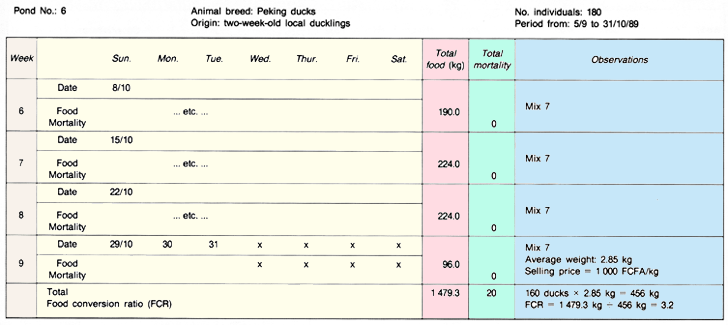
34. Data concerning the rearing of batches of broiler chickens or meat ducks on the fish farm can be registered on forms such as Record-keeping Form 10.
(a) Use one form per batch of birds.
(b) Each day, note how much feed is distributed and how many birds die.
(c) At the end of the week, obtain total feed given and total mortality.
(d) Under Observations, note data on feed quality, reasons for mortality, health problems, average weight of birds, selling price, etc.
(e) At the bottom of the sheet, note total feed given and total mortality over the rearing period. If the rearing period is longer than 9 weeks, use a second sheet to reach the end of the rearing period and number your sheets consecutively.
(f) At the end of the rearing period, use the total feed given and total weight of meat produced, to obtain the food conversion ratio and check your feeding efficiency.
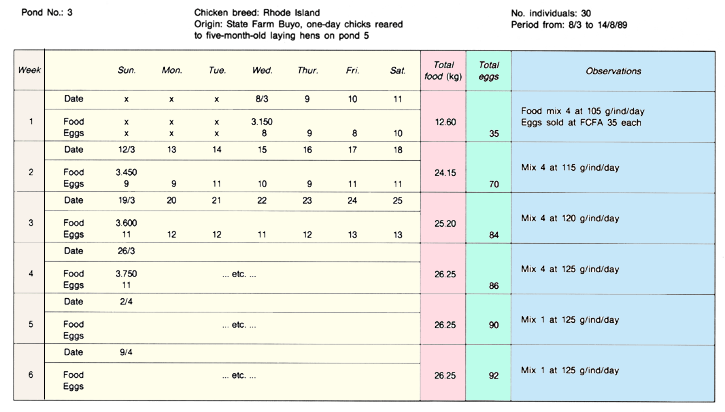
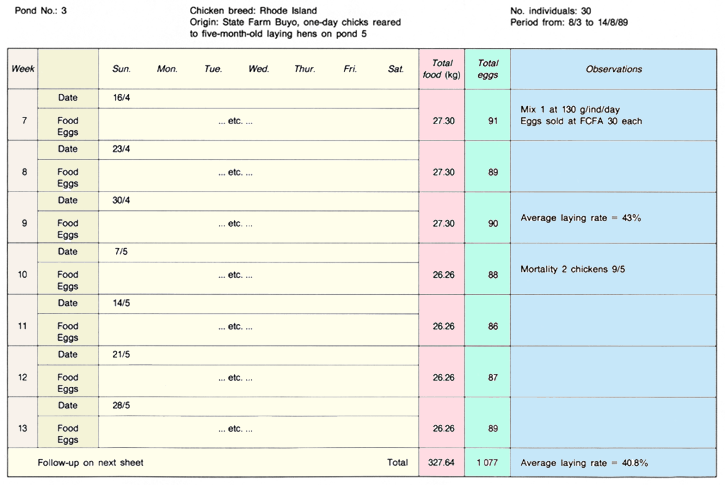
35. When egg-laying chickens are raised on the fish farm, their production data may be registered on forms such as Record-keeping Form 11.
(a) Use one form per batch of layers and number each sheet consecutively.
(b) Each day, note how much feed is given and how many eggs are harvested.
(c) At the end of each week, calculate the total feed given and the total number of eggs produced.
(d) Under Observations, note data on feed quality, daily ration, mortality, health problems, selling price of eggs, etc. From time to time check on the average laying rate (in percent), equal to [(number of eggs produced per week x 100) � (7 days x number of laying hens)]. For example, for week 9, average laying rate = [(90 eggs x 100) � (7 x 30)] = about 43 percent.
(e) At the bottom of the sheet, note total feed given and total number of eggs produced during the period. Use a second sheet to reach the end of the production cycle for this particular batch of hens.
 |
36. Data on integrated pig production, particularly on food distribution,can be recorded for example on Record-keeping Form 12.
(a) Use one form for each batch of pigs, reared next to a specific pond.
(b) Each day, note how much feed is given.
(c) At the end of the week, obtain total quantity of feed given.
(d) Under Observations, note feed quality, daily ration, health problems, etc. Include data on pig growth and feed conversion (FCR).
(e) At the bottom of the sheet, obtain total feed distribution over the period. Use additional sheets as necessary to reach the end of the production cycle.
 |
1. There are several ways by which you can evaluate your performance as a fish farmer. Together with the more detailed knowledge obtained for each pond and for each type of production, these should confirm how well you are managing your fish farm. They can also point out to you the need for some improvement or even changes which could result in increased incomes. The first approach is to calculate your net profit, after depreciation.
2. You have learned earlier (see Section 16.3) how to calculate the annual depreciation of an item. To calculate total depreciation costs at the end of a particular year, you may use a form similar to Table 46.
(a) List all your long-lasting structures and equipment (column 1).
(b) For each of them, note their effective replacement cost, the actual replacement cost minus the residual value (column 2, in local currency).
(c) Note their useful life, see Table 44 (see Section 16.3; column 3, in years).
(d) Calculate annual depreciation (column 4) as effective replacement cost (column 2) divided by useful life (column 3).
(e) Add up column 4 to obtain the total depreciation costs for the year. In the example, these are equal to FCFA 433 750.
Note: if the inflation rate is significant, you may have to adjust these figures to allow for inflation. Consult an experienced bookkeeper or accountant for advice on local practice.
3. In Section 16.6 you have learned how to calculate the gross profit of your fish farm (see Record-keeping Form 5). However, if you have invested considerably in construction and equipment, you should deduct the depreciation costs for these items (see Table 46) to obtain net profit, as mentioned earlier (see Section 16.3).
4. For example, if gross profit for 1989 was FCFA 2 352 325 (Recordkeeping Form 5) and depreciation costs amounted to FCFA 433 750, the net profit for that year was FCFA 1 918 575.
5. At the end of a particular year, the value of all the fixed factors of production - your fixed assets - can readily be obtained from Table 46, on the basis of the annual depreciation for each item listed in it.
(a) List the age (in years) of each item at the end of this year (column 5).
(b) List the value of each asset as calculated at the end of the previous year (column 6, in local currency). Simply transfer the values listed in the last column of the similar table prepared for last year.
(c) Obtain the value of each asset at the end of this year (column 7) by subtracting annual depreciation (column 4) from value at the end of the previous year (column 6).
(d) Add up column 7 to obtain the total value of all fixed assets at the end of this year. Check on your calculations. This total (7) plus total (6) should be equal to total (4). In the example, total fixed assets at the end of 1989 amounted to FCFA 1 566 750.
6. When the age of an asset becomes equal to Its useful life, its replacement value is considered to be amortized. If the asset continues to be used as a factor of production, both its depreciation and its value can be considered as zero. The asset is written off.
7. However, depending on inflation rates and local accounting practice, it may be useful to amend the values to continue to record depreciation and a specific asset value. Consult a local specialist if necessary.
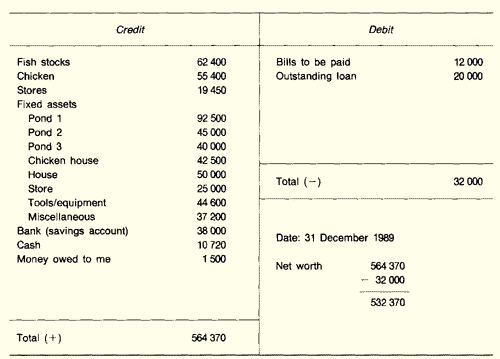
8. At least once a year, usually at the end of the year, you should take stock of all you own. The value of this is called the net worth of the fish farm. It shows you how much money your farm would be worth if you were to sell it tomorrow. If you are doing well, your net worth should keep increasing every year. The higher the increase in net worth, the better you are doing financially.
9. There are two measures commonly used:
10. While the total net worth gives a more complete picture of the state of your farm, the net worth exclusive of stocks is often used, for example by banks, as a safer measure of the recoverable value of your farm (seeing that stock can die). In some cases, banks will allow you to include a percentage of the value of your fish and animal stocks.
11. Calculate your total net worth at the end of a particular year as follows.
(a) From your records of fish stocks (see Record-keeping Form 1 for each pond), estimate the total fish standing crop (in kg) present in your ponds. Multiply it by the current price per kilogram of fish to obtain the total value of your fish stocks.
(b) Do the same for other animal stocks, if any (for example, Recordkeeping Forms 10 to 12), to obtain the total value of your other animal stocks.
(c) From your records of stores (for example, Record-keeping Forms 8 and 9) estimate the values of all supplies in stock. Add up these values to obtain the total value of your stocks in store.
(d) Obtain the total value of your fixed assets:
(e) If you have a bank savings account to hold your farm's proceeds,list the total in the account. Similarly assess the cash currently on hand at the farm.
(g) Add the debts of your clients and all the other money owed to your farm. You may need to reduce this amount if you think some of this may not be paid (bad debt).
(h) Introduce the above values in the left column of Table 47. Add them up to obtain the credit or positive part of your not worth.
(i ) Introduce the values of all your debts such as unpaid bills and outstanding loans (Record-keeping Form 6) into the right column of Table 47. Add them up to obtain the bebit or negative part of your net worth.
(j ) Calculate your net worth as equal to the difference between these active and passive parts.
Example
A small-scale commercial fish farmer has three ponds, one chicken house, a house and a small store. She stocks chicken feed, cottonseed cake, veterinary medications/vaccines and some disinfectants. She owns some tools, small equipment and miscellaneous effects used around the farm (bicycle, radio, furniture, kitchenware, clothes, etc.). Some friends owe her fish worth FCFA 1 500. Her own debts include invoices for a total of FCFA 12 000 and an outstanding loan of FCFA 20 000. The not worth of this farmer on 31 December 1986 is calculated from Table 47 as follows:
12. In some cases it may be convenient to include the complete household in the calculation, also its possessions and personal savings. More strictly the net worth of the fish farm business should be separated from that of the household. Whichever method you choose should be continued in successive years otherwise you may get misleading results.
13. If your farm produces several production lines such as different fish species, pigs, hens, ducks, etc., you may want to know the costs and profit levels for each of these items. The difference between the selling price and the cost of production gives you the profit margin for each item. If you know profit margins for various types of production, you can compare them and select those which give you most profit, subject to the resources available.
14. To calculate the cost of production, you should use your most recent data as shown in your daily records. The method to follow for a single production item is illustrated in the example below.
Note: for a multiple-product farm, items such as feeding, labour and depreciation will have to be shared according to their relative contribution to each production line.
Example
A small-scale farmer produces Nile tilapias in a 400 m2 pond. After six months, he harvests 100 kg of fish; calculate the cost of production of one kilogram of tilapia as follows:
| (a) Cost of juveniles: 8 kg at 600
FCFA/kg
(b) Cost of feeding:
|
= FCFA | 4 800 |
|
= FCFA = FCFA |
10 000 2 000 |
| (c) Depreciation cost of pond: | ||
|
= FCFA | 2 500 |
| (d) Depreciation of tools/small equipment: | = FCFA | 2 000 |
(e) Labour (over 6 months, at FCFA
600/day):
|
= FCFA | 12 000 |
| (f) Cost of production: | ||
|
= FCFA = FCFA |
33 300 333 |
If this farmer ran sell his fish at an average price of FCFA 600/kg, his profit will be FCFA 600 - FCFA 333 = FCFA 267/kg or FCFA 26 700 per production cycle of six months in a 400 m2 pond.
15. In a similar but simpler way, you can judge the performance of your fish farming by calculating the following average values for one financial year.
(a) Average cost of fish production: add up total production costs (Record-keeping Form 5, column 6) and total depreciation costs, if any (Table 46, column 4), to obtain total costs. Divide this value by total weight of fish produced (Record-keeping Form 5, column 2), including weight of fish given away, if any, to obtain average cost of one kilogram of fish during this year.
(b) Average selling price of fish: divide total income from sales (Record-keeping Form 5, column 3) by total weight of fish sold (Record-keeping Form 5, column 2) to obtain average selling price of one kilogram of fish during this year.
(c) Average profit: subtract average cost of production from average selling price to obtain average profit gained per kilogram of fish during this year. This profit should be positive and as high as possible.
Example
From previous example shown in Record-keeping Form 5 and Table 46, obtain the following averages for year 1989:
(a) Average cost of production:
|
= FCFA = FCFA = FCFA = kg = FCFA/kg |
2 148 375 433 750 2 582 125 6 418 402 |
| (b) Average selling price: | ||
|
= FCFA = kg = FCFA/kg |
4 500 700 6 418 701 |
| (c) Average profit per kilogram of fish: | ||
|
= FCFA | 299 |
16. The average annual production rate (in kg/ha/year) provides a means of comparing average fish production on your farm with that obtained on other farms under similar conditions. If you are not doing as well as your neighbours, you should try to find out why and improve management accordingly.
Example
17. The average food conversion ratio FCR (in kg per kilogram fish produced) measures the efficiency with which the feed distributed to the fish is utilized. It should be as low as possible, depending on the feed ingredients you have been using (see Section 10.3). Again, its value can be compared with similar values from other farms and management practices changed accordingly, if necessary.
Example
18. You have learned earlier (see Section 16.3) that both total costs of production and sales income increase as the annual output of the fish farm increases. Bear in mind the following reservations.
(a) At low levels of production on a given farm, fixed costs per kilogram produced are very high. As production increases, fixed costs decrease, and the overall cost of production per kilogram decreases.
(b) As long as income remains lower than costs, there is no profit and the farm loses money.
(c) As soon as income becomes greater than costs, there is profit. Within the capacity of the farm, this profit keeps increasing as the output increases, as long as the price of fish does not drop.
19. The output for which total costs equal sales income is called the breakeven output. At this point, there is neither loss nor profit at the end of the year.
20. To estimate the breakeven output for your particular conditions of fish farming, proceed as follows (see also example).
(a) For a series of increasing outputs (in kg of fish), estimate how much the total costs of production would amount to (fixed costs and variable costs); in a two-way graph draw line AB, where B represents total costs for the potential maximum output of your farm.
(b) For this same series of outputs, estimate the equivalent sales incomes. Draw line OC.
(c) Determine point P at the intersection of these two lines, at which costs equal sales revenue. This point corresponds to an output which is the breakeven output of your farm.
Note: if the business is being run by the farmer, and the family is being supported from the profits, it is useful to include in the total costs a minimum amount for salary or family support. This gives a more accurate idea of the minimum output necessary to run the farm successfully (line A'B' and point P').
21. The value of the breakeven output compared to the maximum output of the farm shows you two important features:
22. The closer the breakeven output is to the maximum production possible, the riskier the farm's operation will be.
A Central African fish farmer owns 1.5 ha of ponds and intends to produce Nile tilapia commercially. Before adopting any type of management, she determines the breakeven output as follows:
|
Determining the breakeven point for a theoretical
fish farm in Central Africa
 |
1. As the production on the farm starts to exceed the immediate local demand for fresh fish, various ways have to be found to sell additional quantities of fish and still obtain a fair price. Good marketing then becomes essential for the commercial fish farmer to remain economically successful. If this is of special interest to you, obtain and study carefully the simple manual written by S.A. Shaw, entitled Marketing the products of aquaculture (FAO, Fisheries Technical Paper 276, 106 pp., 1986).
2. To sell more table fish at better prices, check on the following possibilities:
(a) Where can you sell your table fish:
(b) Which kind of fish do the consumers prefer:
(c) To whom to sell your fish:
(d) How to sell your fish:
(e) When to sell your fish:
(f) At which price to sell your fish:
3. When analysing these various marketing possibilities, keep in mind the aspects of fish farm management. If necessary, adapt them to your marketing needs, if the resulting net profits are worthwhile (see Section 16.7).
4. Raising more than one type -of fish may help contribute to the economic viability of your fish farm. So, in addition to raising fish only for table consumption, you may choose to raise other types of fish as well. The following are some examples:
5. Local sale of fresh farmed table fish is the simplest and cheapest way of marketing. Usually people prefer fresh to processed fish. But to ensure good quality and a good price, your fish should be handled properly.
(a) Before harvest: remember to stop feeding them at least one day beforehand. Stop applying chemicals for prevention or treatment of diseases at least one month earlier. Plan your harvest properly.
(b) During harvest (see Chapter 11): handle the live fish carefully. If necessary transfer them quickly to a storage facility, for example, to remove any unwanted muddy flavour or to simplify or make more attractive selling arrangements.
(c) After harvest: if muddy, rinse them well in clean water. It is best to kill the fish quickly with minimum stress, for example by chilling them in very cold water (about 40�C) or crushed ice. Prepare your fish, if needed, according to customers' preferences, which may include operations such as sorting/grading (see Chapter 12), gutting, decapitating, splitting, scaling and filleting.
6. As soon as a fish dies, it starts to decompose. This process is mainly caused by the increased activity of bacteria (see Section 15.3), which rapidly multiply within the fish under favourable conditions of food, temperature and humidity. Bacteria are especially numerous in pond. water as well as on the gills and in the digestive tract of live fish. It is from there that decomposition will quickly spread to the whole body as soon as a fish dies, unless good handling prevents it.
7. As soon as the fish are harvested you can reduce bacterial activity and thus prevent deterioration of fish quality:
8. Thus, to ensure that your harvested fish will remain fresh and in good condition until they are sold, make sure of the following.
(a) Sell them as soon as possible. Harvest only the quantity of fish that you expect to sell on the same day.
(b) Keep them cool, in the shade and under a wet cover of sisal bags, banana leaves, grass, etc. If at all possible, use ice (see paragraphs 9 to 11).
(c) Keep them clean. Wash them with clear water. Keep them off the ground and protect them well, for example in wooden boxes or plastic/sisal bags, from mud, dust, insects, etc.
(d) Never keep dead fish in water. They will spoil rapidly.
(e) To transport them avoid the warmest hours of the day, travel early in the morning or even at night. If at all possible, use crushed ice and an insulated container (see paragraph 10).
9. Fish can be simply preserved with ice, whenever it is readily available in sufficient quantities and at a reasonable cost. Iced fish should also be acceptable to the consumer at a price covering the extra costs involved. The use of ice will also allow you to reach more distant markets with good quality fish.
10. For best results, apply these simple rules.
(a) Use clean ice, made from good water, and not contaminated by handling, crushing, etc.
(b) Ice clean fish while it is fresh, as soon as possible after harvest and preferably within one hour of death.
(c) Use an insulated container. A simple one can be made from a beer crate lined on the outside with sheets of styrofoam, at least 3 cm thick. Cover this with plywood and add an insulated lid.
(d) Wash these containers well between use, for example with a chlorine bleach solution or another non-toxic kitchen disinfectant. Rinse thoroughly with clean water.
(e) Use plenty of ice: in hot weather at least as much ice by weight as fish. In cooler weather a ratio of one part ice to two to three parts fish may be feasible. This depends also on the length of icing desirable and on the insulation quality of the boxes.
(f ) Use the ice properly so that it is in close contact with all fish:
(g) For best results gut the fish, remove their gills and wash them well before icing.
11. In the tropics, well-iced fish can last for many days. If your fish is tobe kept for such long periods, you should add extra ice to each containerfrom time to time, depending on the conditions of transport and storage.
12. Although your first choice should be to sell your fish fresh (or iced fresh if feasible), there may be instances when processed fish might be preferable. Generally, fish processing itself is done by specialized traders. You should think carefully before deciding to process fish yourself.
13. If you decide to do so, for example as an additional source of profit, get the practical assistance of some knowledgeable person such as a fishery extension agent. Obtain and study also the numerous training materials produced by the FAO Fisheries Industries Division, for example the filmstrips and commentaries about fish preservation: (1) salting (2) smoke-drying and (3) drying.
14. Before processing, the fish is usually prepared as follows.
(a) Gutting: cut the belly open from anal vent to throat with a sharp knife. Remove the internal organs. Cut the head off or cut the throat open to remove gills and blood vessels.
(b) Cleaning: carefully remove in clean water all traces of blood and mucus. In tilapia, brush off the black membrane from the inside of fish.
(c) Splitting: open fish with a deeper cut along the backbone, being careful not to cut through the outside skin.
(d) Scoring fish longer than 25 cm or thicker than about 2 cm by making cuts along the length of the fish at intervals of 2 to 4 cm.
(e) Salt the fish directly, or to prepare for further processing, especially if fish are large and/or fatty, soak them for 60 minutes in a salt solution, called brine, made by diluting 1 to 2 kg salt per 10 l water. Drain/dry the fish in a cool place for about one hour before further processing (see paragraph 15).
Note: to avoid breeding of flies and bacterial contamination of your fresh fish, keep the fish offal, together with spoiled fish and trash fish, in a well-covered container to be processed later (see paragraph 20).
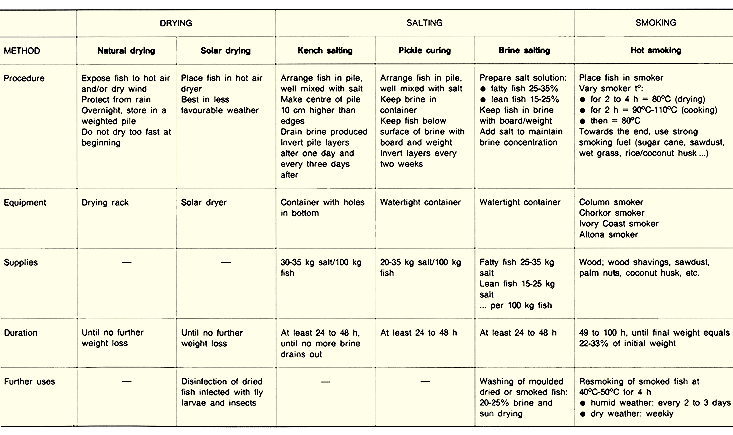
15. There are three main processing methods:
16. A brief overview of useful methods is given in Table 48. Simple equipment is illustrated on the following pages. When selecting a processing method, remember to take into account the type of fish to be preserved. Lean fish such as tilapias are much easier to process than oily/greasy fish such as catfish. Large, deep-bodied fish are more difficult to process than small, slender fish.
|
TABLE 48
Fish processing methods 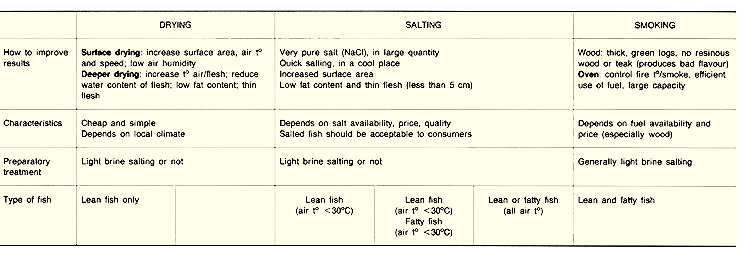 |
 |
 |
 |
 |
 |
|
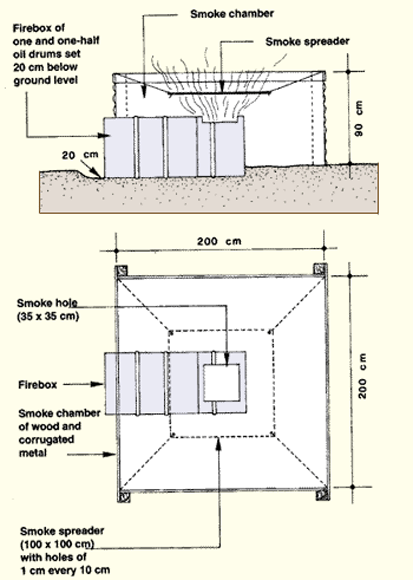
A smoker made from sections cut from an oil drum
 |
|
Note: four or five smoke chambers can be used, but move the topmost chamber to the bottom position from time to time during smoking 
|
|
A smoker with a masonry firebox and a sheet metal
smoke chamber (Altona smoker)  |
 Note: walls can also be built of clay or bricks |
|
A smoker with a wood and metal smoke chamber
and an oil-drum firebox (Ivory Coast smoker) 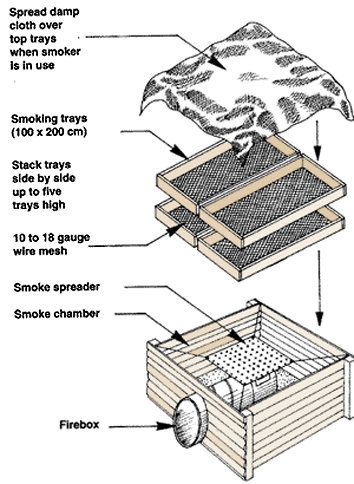 Note: move the topmost tray to the bottom position from time to time during smoking |
 |
Note: move the topmost tray to the bottom position from time to time during smoking
Notes for storing fish after smoking:
17. Store your dried or smoked fish properly:
18. Store your salted fish either in dry salt (kenching) or in a clean brine (pickling/brining).
19. Check regularly on the quality of your stored fish and reprocess itas necessary.
(a) If dried or smoked fish gets mouldy, wash it in a 20 to 25 percent brine and dry it well in the sun.
(b) To preserve the quality of your hot-smoked fish, resmoke it regularly at low temperature (40 �C to 50 �C) for about four hours; do this every two or three days in humid tropical climates. In drier climates, a weekly treatment should be sufficient.
(c) Dried or smoked fish infested with insects can be cleaned and well disinfected in a solar dryer where the air temperature is maintained high enough (above 40 �C) for a few hours (see end of Section 10.6).
(d) Check on the salt concentration in which your salted fish are being preserved. Readjust it and renew old brine as necessary.
20. Fish wastes available from your farm such as trash fish, spoiled fish and fish offal can be used efficiently in several simple ways.
(a) You may add wastes to your compost plies as an additional source of nitrogen (see Section 6.4).
(b) You may chop the wastes into small pieces and feed them raw to your animals, especially poultry.
(c) You may produce highly nutritional cooking oil together with excellent feed for your fish (especially juveniles) and other animals. Simply proceed as follows:
1. From what you have learned above, you may aim to increase profits by, for example, considering the following.
2. Reduce your fixed costs:
3. Reduce your variable costs:
4. Saving can be important, especially if the cost of the item saved makes up a large proportion of the total variable costs. The relative importance of the variable factors of production varies with the culture system as shown in the chart below. In general, supplementary feeds, stocking material, and labour are the items that represent most of the variable costs.
5. You can easily define this relative importance in your own fish farm from the data recorded in your daily accounts (Record-keeping Form 5). Sum up the various variable costs by category for one year and calculate the percentage cost of each category. Try to save on those categories on which you spend most of your money.
|
Examples of the relative importance of variable
factors of production
(as a percentage of total variable costs)  |
6. Increase your sales income
(a) Increase average production rate (monosex tilapia, polyculture, etc.).
(b) Increase fish price through improved marketing planning (seasonal sales, spread of production, wider market, etc.).
(c) Diversify production: juveniles/food fish, fish/other animals, animal/other products, sport fishing, etc.
(d) Improve quality of fish produced according to market demand (larger size, other species, processed fish, etc.).
7. You should build up knowledge from experience. Until you have acquired enough of it, do not hesitate to consult more advanced fish farmers and local extension staff to help you evaluate your performance and advise how to improve it.