|
Where water comes from and where water
goes
 |
1. Water is essential for the life of fish. It is the medium that must supply or support all their needs, including breathing, eating, reproducing and growing.
2. In a previous manual (Water, FAO Training Series, 4) you learned:
3. Here you will learn a bit more about water itself, and about the main physical and chemical characteristics that are important for the production of fish in earthen ponds (see Sections 2.2 to 2.5).
4. Once you know your water well, you will understand more easily how to control its quality and, if necessary, improve it through good pond management practices (see Sections 2.6 to 2.9).
|
Where water comes from and where water
goes
|
Pond water composition |
||||||
|
5. Pond water contains two major groups of substances as shown in the attached chart:
6. The composition of pond water changes continuously, depending on climatic and seasonal changes, and on how a pond is used. It is the aim of good management to control the composition to yield the best conditions for the fish. |
General composition of water
|
|||||
7. Some of these substances are of particular importance for
successful fish farming. You will therefore learn more about:
|
Pond water changes with climate and season
 |
|||||
Changing water composition |
||||||
|
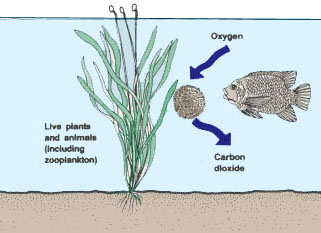
8. The characteristics of pond water depend both on the water that has been used to fill the pond and on the characteristics of the soil. However, within the pond water, some major chemical processes take place:
|
Respiration
 |
|||||
|
Photosynthesis
 |
Decomposition
 |
|||||
9. These processes constantly change the water composition, for example:
10. The greater the quantity of plants, animals and bacteria in the water, the more these processes change the water composition. In heavily stocked ponds, therefore, these changes are greater and need more careful management.
11. All of these chemical processes are influenced by the water temperature: the warmer the water, the more these processes increase, and the more quickly the water composition can change.
12. To manage and control the water composition ,you need to sample and measure the composition particularly of the more important characteristics. In the next sections you will also learn more about the four water characteristics that are of particular importance for fish pond management:
First we will look at how to sample the water so these factors can be measured.
 |
1. As we will see later, the composition of the water can vary according to:
2. There are three ways in which water is usually sampled.
(a) Directly, with test materials or with an instrument. This method is best for getting immediate information and often lets you measure the water exactly where it lies in the pond.
(b) Indirectly, by using a bottle, bucket or other container, and testing the water at the side of the pond. This method may be necessary if you have to add chemicals to the water to test it. It is more difficult to get water from a precise location this way.
(c) Indirectly, as above, but taking the water to a laboratory to test it. Although the methods and the equipment used can give more precise results, the water may have to be specially preserved to make sure it does not change during transport to the laboratory.
3. Whichever method is used, you should:
4. This procedure is the best for testing for dissolved oxygen using chemical methods (see Section 2.5). It may also be used for other analyses. Use a narrow-mouthed glass bottle of known volume, for example 100 ml or 250 ml. This sample bottle should first be washed out and rinsed with the pond water, then carefully filled, avoiding splashing or bubbling. Then with the bottle held below the water surface, push the stopper in. Take care to avoid trapping air bubbles in the neck of the bottle.
5. This method is good for surface and shallow waters. To obtain a sample from deeper water, however, you need to transform the sample bottle into a water sampler.
6. You can build a simple water sampler in the following way.
(a) Obtain a narrow-mouthed bottle, preferably made of glass and containing not more than 500 ml of water.
(b) Obtain a good stopper that fits tight into the mouth of the bottle.
(c) Firmly attach a weight, such as a stone or a heavy piece of metal, to the lower part of the bottle so that the bottle will easily sink.
(d) Attach a piece of string to the neck of the bottle, slightly longer than the maximum depth of the water to be sampled.
Note: instead of only one piece of string, you can also use two, one attached to the bottle and the other attached to the top of the stopper.
(e) Attach the stopper securely to the same piece of string, just above the opening of the bottle, at a distance equal to at least twice the length of the stopper.
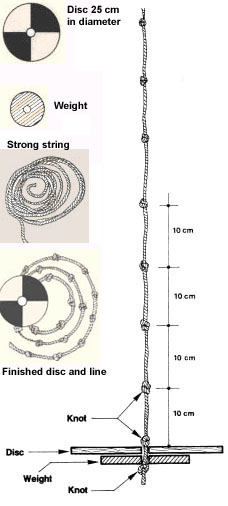
(f) Mark the string with knots spaced at fixed intervals, such as 20 or 50 cm apart, so that you will know at which depth the bottle mouth opens to obtain the water sample.
|
A simple water sampler made from a 250-ml bottle
with a tight stopper and a weight attached to the bottom of the bottle
 |
| 7. You may also secure the sampling bottle to a piece of wood with a rubber strap, for example, attaching a string to the top of the stopper, as shown in the drawing. |
You can build a wooden frame with a
handle to lower the bottle into the water 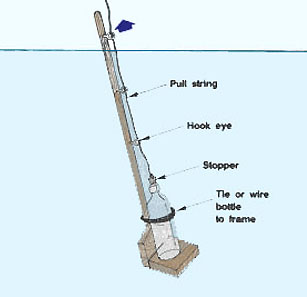 |
8. To obtain a water sample from a certain depth, proceed as follows.
(a) Put the stopper firmly in place to close the water sampler.
(b) Lower the sampler into the water to the desired depth.
(c) Jerk the string sharply to pull the stopper out and open the sampler. It should now start filling with water, while air bubbles appear on the surface of the pond.
(d) When air bubbles no longer appear, carefully pull the full water sampler out of the pond.
(e) Immediately measure the water temperature (see Section 2.4) and the chemical characteristics.
1. Water may be acid, alkaline or neutral. Depending on this, water will react in different ways with the substances dissolved in it. It will also affect in different ways the plants and animals living in the water. The measure of the alkalinity or acidity of water is expressed by its pH value. The pH value ranges from 0 to 14, with pH 7 indicating that the water is neutral. Values smaller than 7 indicate acidity and values greater than 7 indicate alkalinity.
2. Obtain a water sample, using one of the methods described in the previous section. You can use methods and tools to measure the pH of water similar to those you used to measure the pH of soil (Soil, 6, Section 4.1).
(a) pH indicator paper: a thin strip of paper (such as chemically treated litmus paper) is partly dipped into the water to be tested. The colour of the paper changes, and this new colour is compared to a colour chart, which gives the pH value according to the colour obtained. You can buy litmus paper cheaply from some chemists.
| (b) Colour comparator: cheap water-testing kits can be bought from special chemical suppliers. They usually include a number of liquid indicators. A few drops of one of these colour indicators are added to a small water sample, and the new colour of the solution is compared with a set of standard colours supplied with the testing kit. |
Colour comparator
 |
|
|
(c) pH meter: such equipment provides the easiest way for determining the water pH, even in the field, but it is relatively expensive. The pH value is directly read from the meter after placing the glass electrodes in a water sample. Such electrodes are very fragile and should be well protected when being transported. They should be accurately calibrated in buffer solutions of known pH, at regular intervals. Note: because of the variation of the pH in fish ponds during the day (see below), you should measure pH at a regular time, preferably at sunrise. It is even better to measure the pH at regular intervals of two to three hours from sunrise to sunset, which will give you a good idea of the pH variations during daytime. |
pH meter
 |
3. Fish production can be greatly affected by excessively low or high pH. Extreme pH values can even kill your fish. The growth of natural food organisms may also be greatly reduced. The critical pH values vary according to the fish species, the size of individual fish and other environmental conditions. For example, fish are more susceptible to extreme pH during their reproductive seasons, and eggs and young fish are more sensitive than adults.
4. Waters ranging in pH from 6.5 to 8.5 (at sunrise) are generally the most suitable for pond fish production. Most cultured fish will die in waters with:
5. Fish reproduction can be greatly affected even at pH below 5.5, while a pH greater than 9 can already be detrimental to fish eggs and juveniles.
 |
|
| D = Decreasing fish production - correction needed
X = Reproduction questionable Y = Eggs/fry questionable |
|
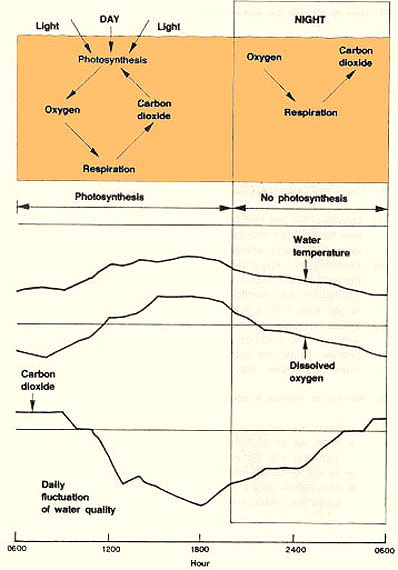
6. The original pH of the water may be affected by the pH of the soil (see Sections 4.1 and 4.2, Soil, 6). However, the pH of pond water varies throughout the day mostly as a result of photosynthesis, and through the night through respiration.
(a) At sunrise, the pH is lowest.
(b) Photosynthesis increases as the light intensity increases. More and more carbon dioxide is removed from the water by the plants causing the pH to increase.
(c) A peak pH value is reached in late afternoon.
|
(d) Light intensity then starts decreasing, which reduces photosynthesis. Less and less carbon dioxide is removed from the water; as respiration adds more carbon dioxide to the water, pH starts to decrease. (e) At sunset, photosynthesis stops, but respiration continues for the rest of the night. More and more carbon dioxide is produced, and pH keeps decreasing until sunrise, when it reaches its minimum. (f) The next day, this cyclic fluctuation of pH starts again. |
 |
7. This pH fluctuation varies in intensity. The more productive the pond, the richer its water will be in minute plant organisms (phytoplankton), the plant and animal respiration will be greater, and the daily fluctuation in pH will be stronger. The pH values of 9.5 will be quite common in late afternoon.
8. As you will learn later in this manual, pond water with a pH unfavourable for good fish production can be corrected.
(a) If the pH is below 6.5 at sunrise, you can use liming (see Chapter 5) and alkaline fertilizers (see Section 6.1).
(b) If the pH is above 8.5 at sunrise, you can use acid fertilizers (see Section 6.1).
2.3 Water turbidity and transparency |
||
|
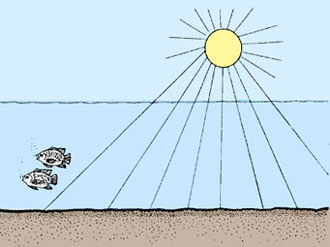
1. As you learned earlier, pond water contains suspended particles of different kinds. Water turbidity is caused by the presence of these suspended particles in varying quantities: (a) Mineral turbidity is caused by a high content of silt and/or clay particles, which turn the water a light brown, sometimes reddish colour. It may occur when the water supply is turbid or a bottom feeding fish, such as the common carp, stirs up the bottom mud. (b) Plankton turbidity is caused by a high content of minute plants and animals which colour the water in various shades of brown, green, blue-green or yellow-green, depending on which plankton species is dominant. (c) Humic turbidity is caused by the presence of humus (see Section 1.6, Soil, 6), which turns the water a dark brownish colour. Its origin is usually the water supply, although it can also be caused by an excess of organic matter entering the pond. |
With 10% turbidity, light will reach the bottom
of a pond
 |
|
The effects of turbidity in fish ponds |
||
|
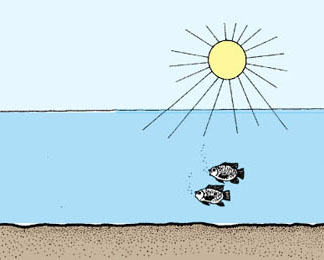
2. Mineral and humic turbidity reduce the amount of light that penetrates the water. In highly turbid waters, light penetrates only a short distance, and photosynthesis is reduced. Oxygen production during the daytime is relatively small. Both the growth of the fish and of their natural food organisms can be badly affected. 3. In addition, a high mineral turbidity can affect fish directly by injuring their breathing organs, reducing their growth rate or preventing their reproduction. In the same way, it can harm the minute animals called cladoceres and copepods (zooplankton), which are very important food for young fish (see Section 10.1). |
With 40% turbidity, light will not reach the bottom
of a pond
 |
|
Measuring turbidity |
||||||||||
|
4. Turbidity of pond water varies from almost zero to highly turbid, depending on the amount of suspended particles. The method used for its measurement varies according to the kind of turbidity present. 5. If it is a mineral turbidity (brownish water), you will need the help of a laboratory to determine the weight of material suspended in a given volume of water. This figure is called the total suspended solids (TSS), which is usually expressed in milligrams per litre (mg/l). When taking samples, be careful not to disturb the water too much, as you can increase the TSS very easily. Also, do not take the water only from the surface, as it is often much less turbid. Amount of total suspended solids (TSS)
present in pond water
6. If it is a plankton turbidity (greenish water), you can estimate the level yourself using the two simple methods described below. They will also give you an estimate of the potential fertility of your pond, from which you can decide on the kind of management practice to be applied (see also Section 6.0). |
(a) Slowly wade into the shallow part of your pond, trying not to disturb the pond bottom too much. Wade into the pond without disturbing the bottom
 b) Stretch one arm, and immerse it vertically into the water until your hand disappears from sight. (c) Note the water level along your arm:
|
|||||||||
Measuring plankton turbidity with your arm |
||||||||||
|
7. This is a very simple method which does not require any special equipment. Proceed as follows. |
Immerse your arm in the water until your hand disappears
 |
|||||||||
10. To measure the Secchi disc transparency, proceed as follows.
(a) Slowly lower the disc into the water.
(b) Stop when it just disappears from sight.
(c) Note at which point the line breaks the water surface. Mark this point A.
(d) After noting at which point along the line the disc just disappears, lower the disc a little and then raise it until it just reappears. Mark this point B.
(e) Mark point C, midway between points A and B.
(f) Measure the transparency of the water as equal to the distance from the top of the disc to this point C, counting the knots along the line. This figure is the Secchi disc transparency.
 |
11. To obtain the best measurement, take note of the following points:
(a) Measure transparency between 09.00 hours and 15.00 hours on calm days.
(b) Whenever possible, make the readings when the sun is out, not behind a cloud.
(c) Look at the sinking disc from directly above, if possible with the sun behind you.
(d) Keep the disc clean, particularly the two white quadrants. If necessary, repaint the disc black and white.
Example
If the Secchi disc transparency is:
12. There are several ways to control water turbidity, at least partly, depending on the kind of turbidity present.
(a) To control mineral turbidity, you may use:
(b) To control plankton turbidity, you may use:
1. The growth and activity of the fish depend on its body temperature. The body temperature of fish is about the same as the water temperature and varies with it. A relatively low water temperature can adversely affect fish by:
2. Each fish species is adapted to grow and reproduce within well-defined ranges of water temperatures, but optimum growth and reproduction take place within narrower ranges of temperature. It is important, therefore, to know the water temperatures available at your fish farm well in order to select the right species of fish and to plan its management accordingly.
3. There are two main groups of fish (see Table 1):
4. Because the fish require sufficient dissolved oxygen in the pond water, the water temperature also affects the breathing, or respiration, of the fish. As you will learn in the next section, the maximum quantity of dissolved oxygen present in water depends on its temperature: the warmer the water, the less dissolved oxygen it can contain. For this reason, if the pond becomes too warm, the fish can run out of oxygen.
5. Fish have adapted to this situation by living in waters that provide them with sufficient oxygen, and so:
6. Water temperature also affects other aquatic organisms in the pond such as plankton, plants and animals. The pond fish may depend on them for food or for the production of oxygen through photosynthesis.
7. Temperature also affects the density* of water. The density of fresh water is at its maximum at 4�C and decreases at higher or lower temperatures, as shown in the graph. This variation has several important consequences for fish ponds.
|
Effect of temperature on pure water density
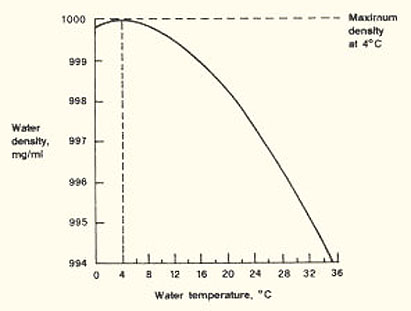 |
(a) Water becomes lighter as it cools down below 4� C, therefore ice which forms at 0� C will float on the surface of the pond, and water below it will be warmer.
(b) Water also becomes lighter as it warms up above 4� C, therefore the warmest water is always at the top of a pond and the coolest water at the bottom.
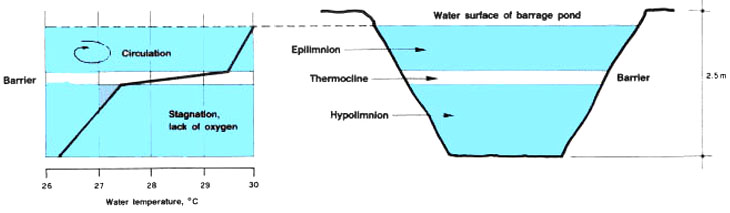
(c) Over longer periods of warm weather, the warmer and lighter surface waters tend to form a separate layer from the colder and heavier bottom waters: the pond water stratifies into distinct layers.
(d) In deeper ponds, such as barrage ponds, such stratification may establish itself for a long period.
8. The pond water then forms three different layers:
9. In cooler weather, heavy cool rains or strong winds can cause this water stratification to break up. The whole water mass then turns over, bringing the cooler, oxygen-poor bottom waters to the surface of the pond and sometimes killing the fish. In some cases, the nutrients and feed materials brought up from the bottom water can also cause excessive plankton growth.
|
Thermal stratification of the water
in deeper ponds
 |
Measuring water temperature |
||
|
10. To measure water temperature, you need a simple thermometer, graduated in degrees Celsius (�C) or centigrades. Such a thermometer is very fragile. To carry it around, you should keep it in a protective case. You can easily make one from a piece of bamboo in which you place some cotton wool. 11. To measure the temperature of surface waters, for example in the feeding canal at the pond water inlet or in the pond itself next to the outlet structure, proceed as follows. (a) Place the bulb of the thermometer under water,
at a depth of about 15 to 20 cm. Note: you can use the same method with a bucket full of water, but be careful to measure the temperature immediately after the water is collected. 12. It you have to measure water temperatures often, it may be best to tie a sampling bottle to a pole with the bulb of the thermometer permanently attached just inside the bottle as shown in the illustration. Read the temperature as soon as you have filled the sampler with surface water. 13. To measure the temperature of water from a greater depth, for example bottom water in a pond near the outlet structure, you need a better water sampler such as the one described earlier (see Section 2.1). Then proceed as follows. (a) Insert the thermometer into the sampler. |
 |
|
14. Whenever you need to closely follow temperature changes in your pond for management purposes, such as fish propagation (see Section 9.0), supplementary feeding (see Section 10.3) or protection of fish stocks against cold, it is best to measure the water temperature twice a day. The best time to do this is shortly after sunrise, when the air temperature is near its minimum value, and again shortly after midday, when the air temperature is near its maximum value, see graph below.
15. You can calculate the average daily temperature of the water and list thermal fluctuations in a table (para. 20).
|
Daily fluctuation of air temperature
 |
|
Example
Surface water temperatures recorded from Pond 8 (�C)
|
Minimum-maximum thermometer
 |
16. If you have a maximum-minimum thermometer, you will need to read the pond water temperature only once a day to obtain both the minimum and maximum temperatures.
17. First, secure the thermometer in the pond, within easy reach by:
18. To record the extreme daily water temperatures, proceed as follows.
(a) Each morning, some time between 08.00 and 10.00 hours, pull the string up and lift the thermometer out of the water.
(b) At the bottom of the minimum metal index, read the minimum temperature of the water, recorded since before sunrise that same morning. Note this down as the minimum temperature for that day.
(c) At the bottom of the maximum metal index, read the maximum temperature of the water, recorded since midday of the previous day. Note this down as the maximum temperature for the previous day.
(d) Using the magnet provided with the maximum-minimum thermometer, slide the two metal indexes down until they touch each of the mercury columns.
(e) Hang the thermometer back in the water.
Note: you can also measure the temperature each evening. In this case, the minimum and maximum temperatures will both be for that day. If you have several ponds of about the same size and depth, fed with a common water supply, it is sufficient to obtain the minimum and maximum temperatures in one of these ponds only.
19. You can then calculate the average daily temperature of the water and show thermal fluctuations on a graph, as explained below.
Note: in a shallow pond not much more than 1 m deep, it is sufficient to measure the water surface temperature. In a pond deeper than 1.5 m, it is best to also measure the water temperature near the pond bottom.
Calculating the average daily temperature of pond water |
||||||||||||||||||||||||||||||||||
|
20. This is a very simple calculation: (a) For each day, add the minimum temperature to the maximum temperature. (b) Divide this result by two to obtain the average temperature of each particular day. |
Average surface water temperatures recorded from
Pond 8 (�C)
(see also previous example)
1 The daily average is calculated as the sum of the minimum and maximum temperatures divided by 2 |
|||||||||||||||||||||||||||||||||
21. This method gives you a good estimate of the temperatures in which your fish live.
Note: if, for a deeper pond, you have also measured one water temperature near the bottom, you should calculate two average temperatures:
22. The overall average of the pond water is then estimated by dividing by two the sum of the surface and bottom water average temperatures.
23. To guide your management practices, you can show on a graph the variations of daily water temperature over a period of time. Proceed as follows.
(a) Obtain some square millimetric paper.
(b) On the horizontal axis, show the time scale, adjusted according to the length of the period. Mark it with exact dates to avoid any error.
(c) On the vertical axis, show the water temperature scale, adjusted according to the expected range of temperatures and mark it with the temperature values (�C).
(d) Enter regularly on the graph the temperature values recorded in your notebook. For example, you may be interested in showing the fluctuations of:
24. When this information is plotted on a graph, you can easily follow the changes in water temperature that are affecting your fish stocks.
|
Variations of daily water temperature
 |
25. It is possible to take some action to improve, within certain limits, the water temperature in fish ponds. But remember that:
26. If you wish to increase the average water temperature of your pond, for example for early spawning of warmwater fish or for prolonged growth or survival over winter months, you can do so in the following way.
(a) Plant wind-breaks across the direction of seasonal cooling winds (see Section 4.2).
(b) To take advantage of sunny weather, build shallower ponds which warm up faster.
(c) If you have a cold water supply, warm it up using a shallow warming pond placed before the main pond.
(d) For overwintering during a cold season, build deeper ponds, which are less affected by sudden weather changes. If ice forms on the pond surface, bottom waters will remain warmer, at about 4� C when density is the greatest (see paragraph 7).
(e) If a warmer supply of water is available, discharge cooler bottom water using the monk outlet in the way described in a previous manual (see Section 10.10, Pond construction, 20).
27, If you wish to decrease the average water temperature of your pond, for example to increase the overall dissolved oxygen content or to avoid the effects of high temperatures, it is better to increase the inflow of cooler water while:
|
The larger the pond, the more stable
its average water temperature  |
In smaller ponds water temperature conditions
can change rapidly  |
1. The most important gas dissolved in water is oxygen (O2). As you have already learned, dissolved oxygen (DO) is essential to most living organisms for their respiration. Oxygen is also necessary for dead organic matter to be broken down during the process called decomposition.
2. The oxygen dissolved in water has two sources:
3. The atmospheric oxygen in contact with the water surface is an unlimited source of oxygen; unfortunately, its passage into water, its diffusion and its subsequent dissolving into water is a very slow process. You will learn how to improve this process by using aerators later in this section.
4. The major source of dissolved oxygen in ponds is photosynthesis (see Section 2.0). Remember that this process depends on the amount of light available to the plants and therefore:
5. You can measure how much oxygen is dissolved in water either by chemical methods or by electrical methods.
|
Dissolved oxygen test kit (chemical)
 |
6. Chemical methods usually rely on the use of simple kits, which can be bought from specialized suppliers. They contain all the chemicals and small equipment necessary to determine the DO content with sufficient accuracy for pond management purposes. Instructions should be closely followed. The measurement is taken on a small water sample obtained with the water sampler described above (see Section 2.1).
7. Electrical methods are based on the use of an oxygen meter, a rather expensive device which can be bought from specialized suppliers. It has the advantage that the DO content can be measured directly from the water, at any depth. The DO content is read from a scale. Instructions should be accurately followed. You should take particular care to calibrate (i.e. adjust) the meter regularly to make sure it remains accurate.
Remember: when measuring DO content, you should always measure the water temperature simultaneously, so that you will be able to relate the DO measurement to this temperature.
8. When to measure DO depends on the purpose of the measurements.
(a) If you plan to measure DO routinely as part of the regular monitoring of the fish farm (see Chapter 16), it is best to measure it twice on a specific day:
(b) In seasons when DO might be insufficient, if you want to predict low night-time DO content, you should also measure it twice:
Apply the method described below.
(c) If you suspect from observation that there might be a lack of DO, you could measure the DO content immediately to confirm and then take remedial action.
9. To estimate the average DO content of the water in a shallow pond at a certain time, you should obtain a series of water samples.
10. The simplest (but less accurate) way is to obtain water samples from one station only but at different depths , as follows.
(a) Select the sampling station at the deep end of the pond and a little away from the dikes, for example in front of the monk outlet structure.
(b) Take a first sample from about 30 cm below the water surface and measure its DO content = A.
(c) Take a second water sample from a depth 0.50 x total depth and measure its DO content = B.
(d) Take another water sample from a depth 0.80 x total depth and measure its DO content = C.
(e) Calculate the average DO content of the water in the pond as: X = (A + B + C) � 3.
11. For more accurate results, proceed as just described,
but use two stations:
|
For more accurate results measure DO
content using two stations  |
12. Do not take water samples near growing aquatic plants or beneath a heavy cover of algae blown against the shore, as these samples would not be typical of the conditions in the rest of the pond.
|
Do not sample water near aquatic plants or
beneath heavy algae  |
13. If your pond is large and deep, such as a barrage pond, you may need more water samples to obtain a better estimate of the average DO content of water in the pond. You should, if needed:
14. In some cases (see below), you may wish to obtain the DO content of the upper layers of the pond only. For this you should take samples in this upper layer only, and calculate the averages as before.
15. The concentration of DO in water may be expressed in several ways:
(a) As the weight of oxygen per volume of water, for example:
(b) As the volume of oxygen per volume of water, most generally in millilitres per litre (ml/l), where 1 ml/l = 0.7 mg/l.
(c) As the oxygen saturation value, the percentage of the maximum amount of oxygen that the water can hold at that particular temperature, see paragraph 19.
Example
A water sample at 30�C has a DO content = 6 mg/l. You can express this DO content in other units such as:
16. For semi-intensive fish farming, the DO content of water is generally expressed either in mg/l or in percent saturation.
17. As for all other gases, the maximum quantity of oxygen that water can hold, the oxygen solubility in water, depends on three factors.
(a) Temperature: the warmer the water, the less oxygen it can hold.
(b) Atmospheric pressure: the lower the pressure, the less oxygen can be held and therefore:
(c) Salinity: the more saline the water, the less oxygen it can hold.
18. The maximum quantity of oxygen which a particular body of water can normally hold is called the 100 percent saturation value. Under certain circumstances, it may happen that the pond water contains more than this 100-percent saturation value. It is then said that there is supersaturation of the water with oxygen, a phenomenon which may happen, for example, in the afternoon when photosynthesis has been very active.
19. Some 100 percent saturation values (mg/l) for oxygen in water for various temperatures, altitudes, water depths and salinities are given in the following charts to show you the expected variations of the DO content under various circumstances.
|
Variation of oxygen saturation with altitude1
1 100-percent saturation values for fresh water,
in mg/l
|
Variation of oxygen saturation with water depth1
1 100-percent saturation values for fresh
water, in mg/l
|
||||||||||||||||||||||||||||||||||||||||||||||||
|
Variation of oxygen saturation with water salinity
1 100-percent saturation values, at
sea level, in mg/l
|
||||||||||||||||||||
Example
If the DO content of surface water is measured equal to 8.2 mg/l
in a freshwater pond located at 300 m altitude and if the water temperature
is 30�C, you find from the chart (Variation of oxygen saturation with
altitude) that the 100-percent saturation value is 7.27 mg/l. The
oxygen saturation value of the water is therefore equal to
(8.2 mg/l � 7.27 mg/l) x 100 = 112.8 percent, which means that this
water is supersaturated in oxygen.
Using a graph to determine oxygen saturation values |
||||||||||||||||||||||||||||||||||||||||||||
|
20. It is often easier to use the following graphical method, which gives you a quick estimate of the oxygen saturation value good enough for freshwater pond management purposes. Proceed as follows. (a) Measure the DO content of the water, in mg/l. (b) Correct this value for altitude by multiplying it by the appropriate correction factor to obtain the DO content at sea level, as follows. (c) Introduce this sea-level DO value on the bottom horizontal line using graph 1 to obtain point A. (d) On the top horizontal line of the nomograph, determine point B at the water temperature (�C) value. (e) Using a ruler, join point A to point B to determine point C on the oblique central line. (f) At point C, read the DO saturation value in percent. Note: if you can, make a copy of the blank graph so that you can use it again.
|
|
|||||||||||||||||||||||||||||||||||||||||||
21. Remember: if the DO saturation value is higher than 100 percent, there is oxygen supersaturation in the water.
Example
You have measured a DO content = 5.4 mg/l in a shallow pond located at an attitude of 275 m above sea level, and the water temperature was 28.3�C. Determine the DO saturation value as follows:
 |
|
GRAPH 1
Graph for the determination of oxygen saturation values in fresh water at sea level 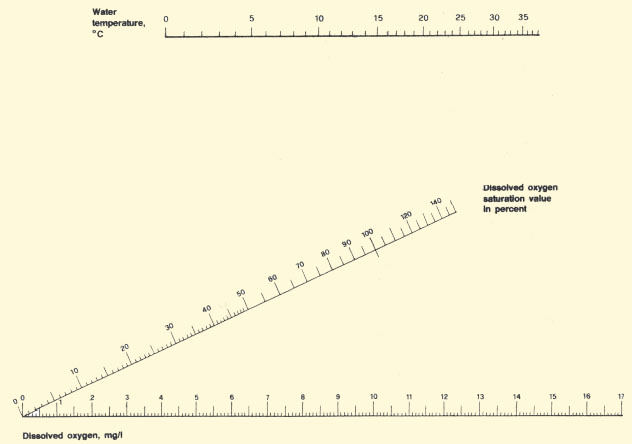 |
22. The oxygen requirements of fish are determined by three basic factors:
23. In addition, there may be some variation due to physiological factors such as activity, feeding and digestion, sexual maturation and spawning.
|
DO
requirements at various stages of life
(in mg/l or percent saturation values)
|
||||||||||||||||||||||
24. As you have already learned (see Section 2.4 and Table 1), coldwater fish require higher oxygen levels than warmwater fish. Fish such as catfish, which are used to slow-moving water bodies, can tolerate lower levels than fish used to fast-moving water. For a particular species, younger fish require higher oxygen levels than adults. At higher water temperatures, the fish will consume more oxygen for their respiration. This factor can be very important, because when temperature rises, water holds less oxygen (see the first chart on page 2.7). When actively feeding and later, when digesting their food, fish will require much more oxygen than usual. You will learn more about DO requirements of fish in Section 14.0.
|
Oxygen requirements are determined by three factors
Species (Tilapia nilotica, etc.)  |
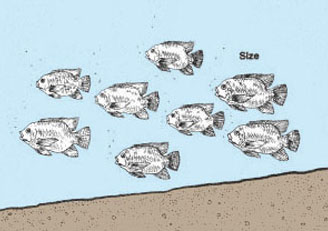
Size
 |
25. Two types of fluctuation in oxygen level can be found in fish ponds:
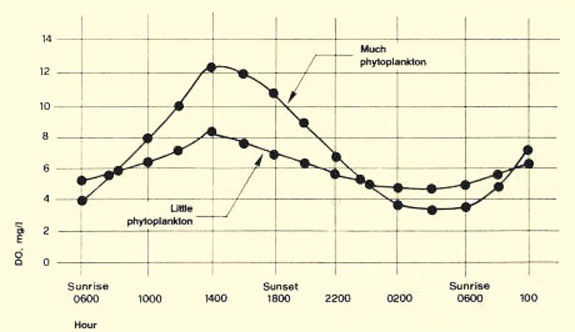
26. In surface water, the daily fluctuation of the DO content is related to the 24-hour cycle of day and night.
(a) From sunrise to sunset, photosynthesis increases the DO level. On clear days, DO production is higher than on cloudy days. The higher the phytoplankton population, the higher the DO production.
(b) At night, photosynthesis does not take place, and therefore respiration reduces the DO content until sunrise. The higher the plankton population, the faster the DO will fall.
|
DO content in the surface water of a shallow pond
during a 24-hour cycle (water temperatures from 28 to 33�C)
 |
 |
27. In very rich ponds, surface water may become supersaturated by midday. However as respiration is also high, there may be very little oxygen left by the end of the night. Your fish may die if you do not correct these conditions.
28. In deeper water, the daily fluctuation of the DO content is related to the plankton turbidity: the higher the turbidity, the smaller the amount of light penetrating deeper in the water, and the less the production of DO through photosynthesis in deeper water. The DO content therefore decreases as depth increases.
29. In very rich ponds, where there is a dense plankton population and high turbidity, the DO content of the lower depths of the water may become very low even during the day. The fish may have to concentrate at the surface of the pond to survive. Greater problems are to be expected after sunset.
30. The seasonal fluctuation of the DO content is essentially related to the thermal stratification of the water(see Section 2.4). As the thermocline establishes itself and restricts exchanges between the upper and lower layers, the DO content of the bottom water decreases, mainly because of the decomposing organic matter. It is only after the pond water has turned over that DO is brought back from the pond surface to the bottom through the general mixing of the water.
31. In deep ponds rich in organic bottom mud, the bottom water may become totally devoid of oxygen (anoxic) within a few weeks, and fish will not be able to live there. Later, when the pond water turns over, this anoxic water may reach the surface, together with decomposed organic material; many fish may die if you do not help them.
|
Daily fluctuations of DO content with
water depth in a shallow pond
with de presence of a high plankton turbidity (water temperatures from 26 to 33�C)  |
32. Apart from the fluctuations of the DO content described above which take place regularly, every day or seasonally, the DO content of pond water may also decrease suddenly for several other reasons. If this should happen, check on the following possible causes one by one:
|
(a) The water supply:
(b) The weather:
(c) The fish pond:
(d) Fish stock management:
|
33. Generally, several factors combine to cause a sudden drop in the DO content. In most cases, good management can prevent this.
34. In the absence of a suitable chemical kit or oxygen meter, you can observe signs which tell you that there is not enough oxygen in your pond, for example:
35. In Section 2.3, you learned how to measure the Secchi disc transparency. If phytoplankton is the main source of turbidity in your pond, you can use this measurement together with other observations to predict low DO content. Proceed as follows.
(a) Measure Secchi disc transparency (SD).
(b) If SD is smaller than 25 cm, the risk of oxygen depletion is great, especially if:
(c) If SD is between 25 cm and 60 cm, there is still a risk, although decreasing as SD increases, that oxygen depletion may take place. Check on the weather and look regularly for signs at the pond.
(d) If SD is greater than 60 cm, the risk that oxygen depletion may suddenly take place is minimal, unless overcast weather persists for more than a week.
Note: when applying this method, you should remain aware of the other reasons that may cause a sudden DO drop.
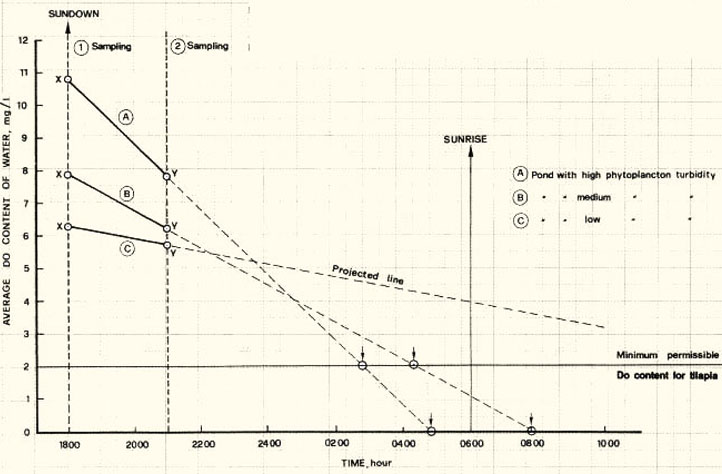
36. If you have a kit or a meter to measure DO content, you may apply the projection method developed by Prof. C.E. Boyd and colleagues at Auburn University, USA (Transactions of the American Fisheries Society, 107: 484-92, 1978). It can be used in any pond but it is particularly useful when most of the water turbidity does not come from phytoplankton and when the Secchi disc method cannot be used reliably. Proceed as follows, referring to the graph below:
(a) Measure the average DO content of the pond at sunset, for example at 18.00 hr, to determine X mg/l.
(b) Measure the DO content again two to three hours later, for example at 21.00 hr to determine Y mg/l. This value should be smaller than the first one.
(c) Using millimetric graph paper, plot X and Y values as DO contents (vertical scale) against time (horizontal scale).
(d) Join the two points X and Y by a straight line.
(e) Continue this straight line down to the bottom scale. This will predict the average DO content of the water in the pond later during the night.
37. You can now use this graph according to the kind of fish (species, size) in the pond and their minimum acceptable oxygen level (see the chart in paragraph 2.3). Draw a horizontal line showing on the graph the minimum DO level acceptable in the pond. The following outcomes may thus be predicted.
(a) If the projected line (such as line C in the example) intersects this horizontal line after sunrise, there should be sufficient DO for the fish throughout the night.
(b) If the projected line (such as line B in the example) intersects this horizontal line just before or at sunrise but also intersects the zero-DO line just after sunrise, there will most probably be sufficient DO for the fish until sunrise. However, it might be advisable to improve the oxygenation of the water (described below), especially during the last part of the night.
(c) If the projected line (such as line A in the example) intersects the horizontal line and the zero-DO line before sunrise, there is a major risk that there will be a severe lack of DO during the night. Measures should be taken immediately to improve the water oxygenation.
Note: the results depend a lot on the accuracy of your calculations. To obtain good water samples and calculate the average DO content of the water in the pond, proceed as described in Sections 2.1 and 2.5.
Examples:
POND A: Well before sunrise there will probably be a strong deoxygenation of the water; immediate measures should be taken.
 |
38. During critical seasonal periods and in ponds where you expect problems, you can use the chart method over a longer time period. This is particularly convenient if you have an oxygen meter that gives you fast and reliable measurements of DO contents at any water depth. Proceed as follows, referring to graphs below:
(a) Measure the average DO content of the water in the pond at sunrise, for example at 06.00 hours, to determine X mg/l.
(b) Measure the average DO content of the water in the pond at sundown, for example at 18.00 hours, to determine Y mg/l.
(c) Prepare a chart with two scales showing time (horizontal) and DO content (vertical) for each pond you plan to monitor.
(d) Enter your measurements X and Y in the chart of the pond.
(e) Note also the weather conditions.
(f ) Repeat this procedure every day during the period you are examining, or until oxygen problems cease.
39. By observing the fluctuations of the average DO content and the effect of daily weather conditions, you should be able to predict when it will become necessary to intervene to improve the oxygenation of the water and to avoid fish production losses. In particular, you should observe:
 |
 |
Improving pond water oxygenation |
||
|
40. The DO content of pond water can be increased in several ways:
41. A simple way to ensure a good supply of atmospheric oxygen to fish ponds from the beginning is to plan their design to take maximum advantage of the wind. This will result in better aeration of the surface waters and better mixing with deeper water. As far as possible you should design your ponds, particularly the fattening ponds, keeping the following points in mind. (a) Find out which are the most important winds during the year, considering factors such as the critical times for pond oxygenation, the strength and continuity of the wind and the time of day the wind blows. (b) The longer the path of the wind on the pond surface, the greater the wind action. If possible orient your ponds so that the longest dikes are parallel to the direction of the winds you want to use. (c) It is easier for the wind to keep ponds well mixed when they are shallow rather than when they are deep. |
The longer the path of the wind, the greater the wind action
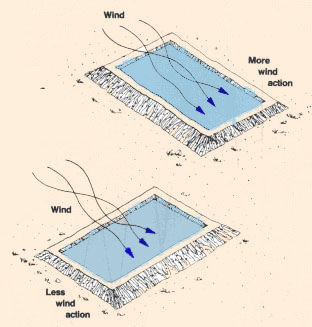 Mixing currents caused by wind action 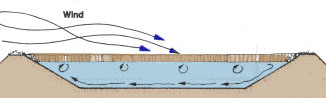
|
|
42. If you can identify the likely cause of the problem, good pond management may improve the DO content of the water. You should take the following routine measures, preferably before any emergency happens.
(a) Direct improvement of DO content by:
(b) Reduction of oxygen consumption from decomposition of organic matter by:
(c) Increased production of oxygen through photosynthesis by:
(d) Reduction of oxygen requirements of fish by:
|
(a) To improve the effectiveness of drying the bottom of the pond, hoe or plough the soil to a depth of 15 to 20 cm. (b) Vegetables or other crops may be cultivated together with pond drying to increase its benefits. (c) Thorough drying is particularly advisable if the loose mud layer is thicker than 15 cm and if it smells putrid. (d) Do not keep a fish pond thoroughly dry if:
|
2.6 How to improve water oxygenation at pond inlets |
||
|
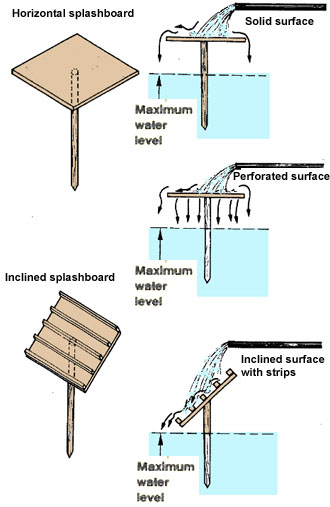
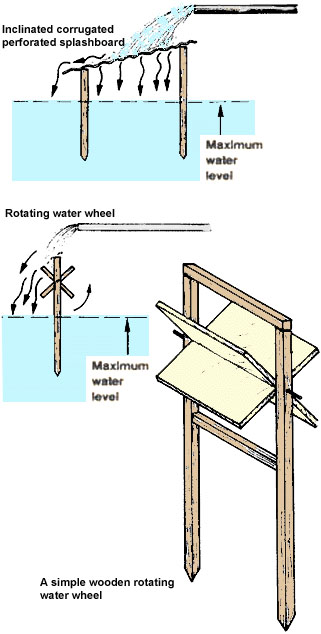
1. It is relatively easy to improve the oxygenation of the water as it drops into the pond (see Pond construction, 20) Several simple ways to do this are described below. You should select the system best adapted to your needs. The mixing of atmospheric oxygen and water will improve as:
2. If the water supply is delivered to the pond through a pipe, you can improve oxygenation by:
|
 |
|
|
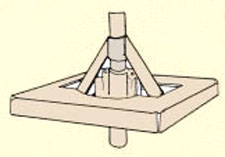
3. If the water supply drops vertically into the pond through any type of overhanging inlet, such as a pipe or a wooden frame, you can improve oxygenation with:
|
 |
|
4. If the water supply flows into the pond through an inclined surface at the end of the feeding canal, the possibilities for improving its oxygenation are more limited. The most efficient improvement would be to place a slanting piece of perforated corrugated iron or asbestos sheet above the dike side.
Note: to maintain their efficiency, you should regularly clean meshed or perforated materials of any algal growth or other deposit. |
 |
|
2.7 How to improve oxygenation by using a cascade |
||
Introduction |
||
|
1. A cascade, which can be built using wood or stone or both, is a simple fixed structure over which water is dropped. As it drops, the water mixes with air, and its DO content is increased. This simple process is called gravity aeration, as opposed to the more complex mechanical aeration discussed later (see Section 2.8). Using a cascade2. A cascade is especially useful for increasing the DO content of poorly oxygenated water, for example spring water or water pumped from a deep well. It is also useful for oxygenating water flowing out of a pond before it is fed into another pond built in series (see Pond construction, 20). This step is particularly important for ponds stocked at high densities such as storage ponds and wintering ponds. 3. The use, position and design of a cascade depends on the topography of the site, particularly the available differences in elevation (see Topography 16). Generally a cascade is built:
Note: if there is a risk of the water supply losing oxygen before it enters the ponds (e.g. if there is a lot of organic matter in the water), it is better to build a cascade near the pond entrance rather than at the beginning of the main water feeding canal. |
A stone cascade with a single drop
 A timber cascade with an intermediate splashboard  |
|
4. The efficiency of transfer of atmospheric oxygen into the water is usually defined by:
E = (100 x actual increase in DO) � (possible increase in DO)
5. This transfer efficiency essentially depends on the following factors.
(a) The initial DO content of the water: the lower the DO content, the greater the improvement.
(b) The energy of the water as it falls over the cascade, which depends on:
(c) The amount of mixing possible between the water and the air, which depends on:
6. The greatest efficiency is, therefore, obtained with:
7. When you plan a cascade, take into account the following criteria, and incorporate the topographic features of the site.
(a) Give the cascade the maximum height possible at the particular location.
(b) If this height is greater than 1 m, break the cascade into two or three intermediate sections.
(c) If the water drops from less than 1.40 m, it is best to break the fall up across a horizontal surface, without using a receiving basin.
(d) If the water drops from higher than 1.40 m, it is best to break it up vertically, or as an incline, and to build a receiving basin with a water depth of at least one-tenth of the dropping height.
(e) Make the cascade wide enough so that the water depth over its top edge is less than 10 cm and preferably less than 5 cm. Try to break up the water flow at the edge by using a ridged bar, perforated screen, etc.
(f) You can increase efficiency by using certain
devices which improve mixing, such as ridge bars, mesh screens
or perforated sheets, but you should not forget to clean them
regularly to maintain their efficiency.
|
Potential efficiency of different cascades
for water oxygenation (in percent)
|
|||||||||||||||||||
1. Mechanical aeration devices are relatively expensive and require an external power source. They are consequently most commonly used for short-term and emergency aeration, such as converting extreme daytime oxygen depletion when ponds are particularly heavily stocked, or during extreme climatic periods. In more intensive fish farming, mechanical aerators may be used continuously, but this step is only practical for higher- value fish species under extremely well-managed and controlled conditions.
2. All of the devices mentioned in this paragraph are used inside the pond. They are powered either directly, with small electric or gasoline motors, or indirectly (e.g. from a tractor power take-off), or using a shore-based pump or air compressor. Some common forms of mechanical aeration include the following:
| (a) Spray-type (fountain) aerators: these usually have an electric motor that spins a vertical propeller, which drives water upwards through a spreader device, spraying water out in an arc around the aerator. The aerator is mounted on a float, which is tethered in position in the pond. A simple guard protects the fish from the spinning propeller. These aerators are typically 0.25 to 1 kW in size. |
Spray-type floating aerator
 |
|
| (b) Pumps: the water is pumped out from a pond,
or an adjacent water body, and sprayed back on to the pond surface. Pumps
can also be used to feed water to a simple cascade. Pumps can
be powered by electricity, gasoline or a diesel engine, or from a tractor.
|
Pump aerator
 |
|
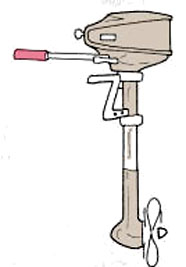
| (c) Outboard motors: to be used to mix and aerate pond water, they should be attached to a fixed point such as a wooden platform or a securely moored boat. Care should be taken to protect the fish from the propeller. |
Outboard motor
 |
|
| (d) Paddle-wheel aerators: a float-mounted motor drives a horizontal axle on which is fitted at each end a vertical paddle-wheel, set about one-fourth to one-third of its diameter down into the water. The blades of the paddle-wheel are usually slightly scooped or angled and are perforated. The paddle-wheels rotate in the water, scooping, lifting and splashing the water out across the surface. They are typically 0.5 to 2 kW in size. Paddle- wheel aerators can also be set up using power from a tractor, via a propeller shaft. Some models are mounted on wheels, allowing them to be backed up into the pond and towed away after use. |
Homemade metal paddle-wheel aerator
 |
|
|
(e) Air compressors or blowers: these can be used together with a perforated pipe or air diffusers. They are more common in smaller ponds or for special uses such as harvesting. The air compressor feeds compressed air down the pipe, from which it emerges in the form of fine to medium-sized bubbles, which mix with the water to provide aeration. These systems are better used in deeper water. |
Commercial paddle-wheel aerator
 Tractor-driven paddle-wheel aerator  |
3. Mechanical aerators are usually defined by efficiency and capacity.
4. Efficiency is usually expressed as kilogram (kg) of oxygen transferred per kilowatt-hour (kWh) of energy applied. This figure typically ranges from 0.2 to 1.5. As with cascades, the level depends on factors such as the amount of mixing created and the existing DO level in the water.
5. Capacity is usually expressed as kg of oxygen transferred per hour. It varies with the size and power of the device, but typically ranges from 0.5 to 5 kg/h.
6. As an appropriate guide, it is best to allow for at least 5 kg/h per hectare of pond, corresponding to an increase of DO concentration of about 0.5 mg/l per hour. At a typical efficiency of 1 kg/kWh, this increase would require 5kW (about 6.7 HP) of applied power per hectare.
7. Selecting the type and size of mechanical aerators depends on several factors, including:
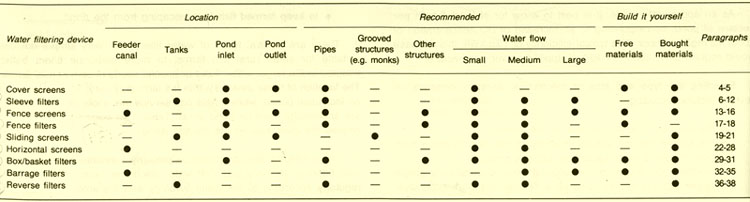
1. Good fish farm management requires proper control over water supplies and their quality. Water filtering devices are commonly used:
2. There are several types of water filter, from very simple devices suitable for small rural fish farms, to more elaborate filters better adapted to the larger water flows or special needs of commercial farms. The location of these devices within the farm may vary. Some are set up on individual ponds, while others can service the whole fish farm. Some are specifically used for pond inlets. Table 2 will help you choose the most appropriate filtering device.
3. Water filtering devices should be properly
maintained to retain both their filtering efficiency
and their water discharge capacity. Clean them regularly
according to the water turbidity and the amount of material collected.
Check them and repair them as soon as the filtering
efficiency alters. Remember that the smaller the particle
size your filter can retain, the more susceptible it becomes to clogging,
and the more frequently you should check it and clean it.
| Sleeve filters | Fence screens | Fence filters | Sliding screens | Horizontal screens | Box/basket filters | Barrage filters | Reverse filters |
Cover screens for water pipes |
||
| 4. Pond inlet and outlet pipes can be cheaply screened by
covering their end with some flexible filtering material. This material
should fit tightly over the pipe end and be well
secured, if necessary using a piece of nylon string or galvanized
wire.
5. Depending on how much money you wish to spend, you can, for example, use one of the following:
|
 |
|
Sleeve filters for water pipes |
||
|
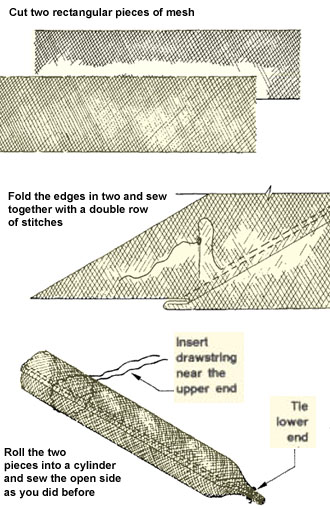
6. A sleeve filter consists of a cylindrical mesh tube, securely fastened around the inlet pipe at one end and tightly closed with a string at the lower end. 7. It is a simple and relatively cheap device, which allows the passage of a large volume of water while very efficiently retaining even the eggs and larvae of wild fish. However, as it is usually made of very fine-meshed synthetic material (e.g. saran with 21 meshes per cm), it may clog up rapidly if its overall surface area is not large enough to handle the water turbidity and flow. 8. If you have the right synthetic material, you can easily make a sleeve filter yourself in the following way. (a) Cut two rectangular pieces of mesh material with the following dimensions, depending on the size you need:
Note: the width of the piece of mesh to be cut should be equal to (1.57 x D) + (4 x S) where D is the diameter (in cm) of the sleeve filter to be made and S is the width (in cm) of the double flat seam joining together the two pieces of mesh. (b) Fold the edges in two and using strong thread, such as nylon, sew the pieces together with a double row of stitches and two double flat seams, to make a cylinder. (c) Fit each end of this cylinder with a drawstring closure and nylon string. Note: a saran sleeve filter 4 m long and about 50 cm in diameter should be sufficient to handle 60 I/s water flow. You need about one square metre of filter surface per 10 l/s water flow. |
 |
|
Using the sleeve filter at a pond inlet |
||
|
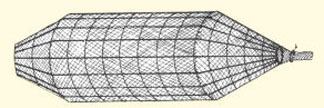
9. How the sleeve filter is used depends on the vertical distance between the inlet pipe and the pond water surface. (a) If this distance is quite large, for example when filling an empty pond, it is best to fit the sleeve filter inside a wooden frame to support the whole of its length. |
A sleeve filter supported by a wooden frame
 |
|
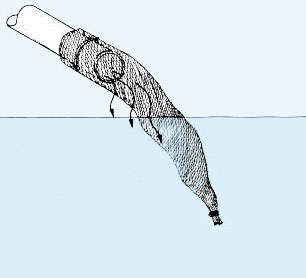
| (b) If this distance is relatively small, for example in a fully filled pond, the sleeve filter will last longer if it floats in the water. |
A sleeve filter partially floating in the water
 |
|
10. Secure one end of the sleeve filter around the end of the inlet pipe. For additional security, attach the end of the string to a strong anchoring point.
11. Tightly close the other end of the sleeve filter with its string. Make sure that it can be easily opened later, simplifying cleaning.
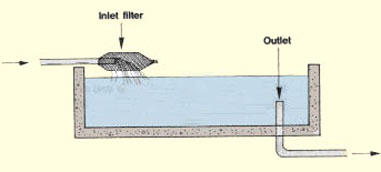
12. If you need to filter the water supplied to water tanks, you may also use sleeve filters, either at the inlet or outlet pipe. Some examples of possible arrangements are shown below.
|
Making an inlet filter
Shape a frame of expanded metal ...  |
... and cover it with fine mesh
 |
|
 |
||
|
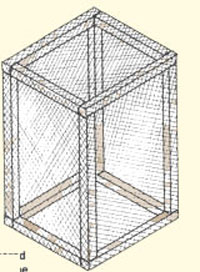
Making an outlet filter
Mesh-covered expanded metal frame 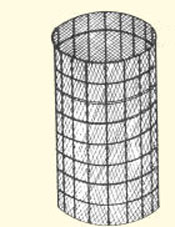
|
Mesh-covered wooden frame
 |
|
 |
||
Fence screens for fish ponds |
||
| 13. A fence screen may be built in front of a pond inlet or
outlet to prevent wild fish and rubbish from entering, as well as to prevent
farmed fish from escaping.
14. Various cheap materials may be used for the construction of a fence screen, such as:
|
 |
|
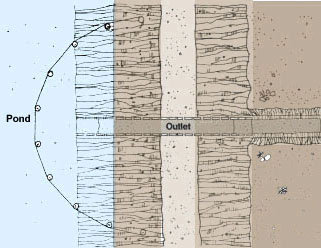 |
A semi-circular fence screen built in front of
a pond outlet
 |
|
15. To increase both the resistance of the fence screen and its water discharge capacity, you should build it in a semi-circle rather than flat, centring it well in front of the structure to be protected.
16. Earlier in this series you also learned how to build a stronger metal fence screen using metal bars to protect the main water intake of your farm (see Section 7.7, Pond construction).
17. Fence filters are somewhat similar to fence screens, except that they are much thicker and heavier, and are built mainly with wood and stones. To build a cheap, durable structure with locally available materials, proceed as follows.
(a) In front of the pond inlet, using string and pegs, mark a semi-circular area centred on the axis of the inlet at a distance of at least 1 m. The area itself should be about 40 cm wide.
(b) Along the inside and outside limits of this area, drive two vertical rows of wooden poles solidly into the earth about 40 cm apart. The poles should stick about 30 cm out of the ground.
(c) Remove 15 to 20 cm of bottom soil from the area.
(d) Build a solid foundation by laying rows of big stones near the poles, within the cleared area.
(e) Tightly fill the spaces in between with smaller stone chips. Do not leave large holes in the inner part of the filter.
(f) Build the filter up, successively adding layers of bigger stones (on the outside, near the poles) and small stone chips (on the inside), until you reach slightly below the top of the poles.
18. If the inflow water transports too much debris or silt, the filter may eventually become clogged. At least once a year, take it apart for cleaning and rebuild it properly.
|
A semi-circular fence filter built in front
of a pond inlet 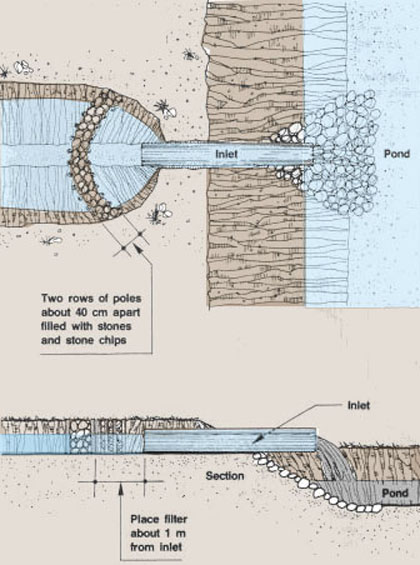 |
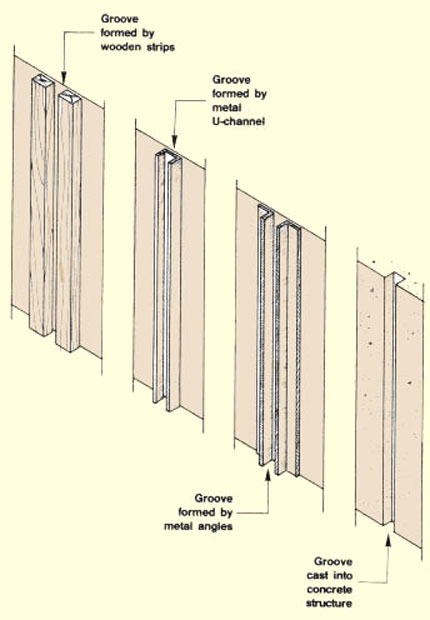
19. In a previous manual (see Pond construction), you learned how most water transport and control structures are built with sets of grooves that hold wooden boards and sliding screens. Such filtering screens are commonly used in main water intakes, at pond inlets, in monk and sluice outlets and in holding tanks as well as in structures such as those used for harvesting and grading fish.
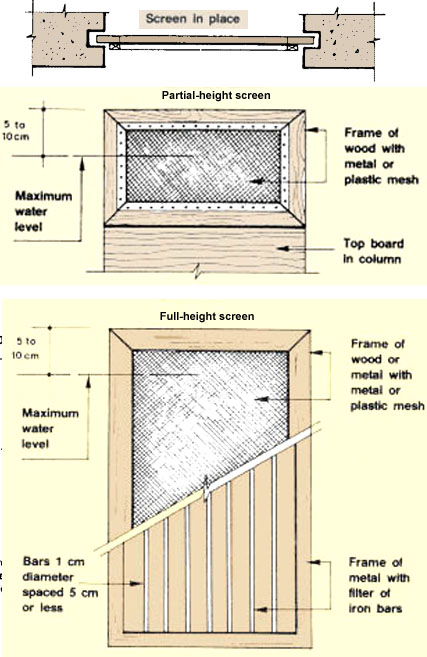
 |
20. Sliding screens usually consist of an external frame to which the filtering material is attached. They may be designed according to the following criteria.
(a) The dimensions, depending on the structure for which they are built:
(b) The frame material, generally either wood or metal: the wood should be either selected for durability under water, or appropriately treated (see Section 3.1, Pond construction).
(c) The filtering material, generally either metal or plastic mesh. Round iron bars welded to a metal frame may also be used.
(d) The filtering efficiency, the greater the efficiency, the smaller the holes needed and the more susceptible the screen is to clogging. To reduce the need for very frequent cleaning, use larger filtering areas for fine screens. Do not use holes that are too small.
21. As an approximate guide, the velocity of water through the open area of a screen should not exceed 0.02 m/s. Thus, if the expected flow is 10 l/s (0.01 m3/s) , an open area of at least 0.01 m3/s � 0.02 m/s = 0.5 m2, is required. If the filter screen has 20 percent open area in normal operation, you will need a 2.5-m2 screen.
Note: if your farm has several ponds, it will be too time-consuming to look after a fine-mesh screen at the inlet of each pond; you should either build a good general filtering device upstream from your ponds (see next section), or you should use box/basket filters (see paragraphs 29 to 31).
 |
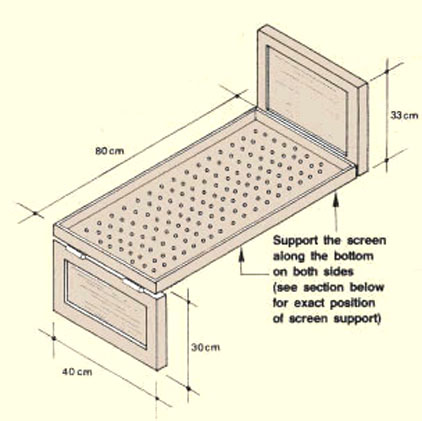
(a) On the basis of the maximum water flow required for the fish farm, estimate how large the surface area of the horizontal screen should be (see paragraph 21). Divide this area by the width of the feeder canal at the surface of the water to find the screen length necessary.
(b) In the main feeder canal, first build a rectangular open box using either wood, bricks, cement blocks or concrete. Build the box as follows:
23. The filtering device is to be tightly fitted inside the box between the two pairs of grooves, and is built as follows:
(a) Build a rectangular wooden, plastic or metal frame on which you fit the filtering screen. This screen should be made of strong material, preferably a perforated metal sheet, but plastic or metal mesh may also be used. Mesh size should not be smaller than 3 mm.
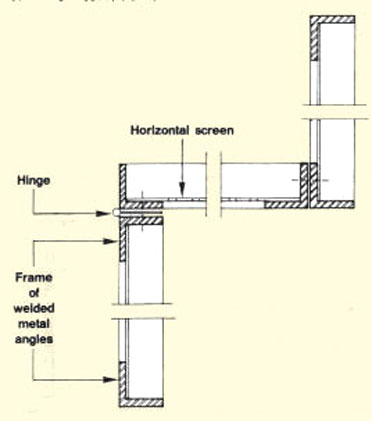
(b) At the back (downstream) end of this frame and perpendicular to it, attach a wooden board. Its height should be equal to the distance from the top of the support brackets to the top of the box built in the canal.
(c) At the front (upstream) end of the filtering frame and perpendicular to it but hanging down, attach with hinges a wooden board. Its height should be slightly more than the distance from the top of the support brackets to the bottom of the box built in the canal.
(d) Position this filtering device in the box on the supporting brackets, with the hinged board turned down and facing the entrance of the water canal. Check and adjust as necessary in order that:
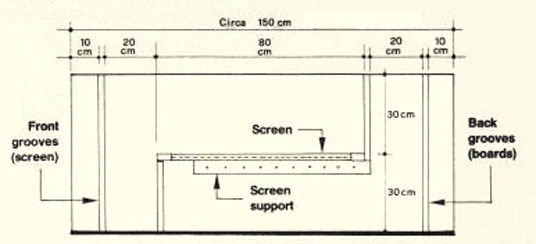
24. The following drawings show two examples of horizontal underwater screens, one in wood and one in metal, and how to place them in a feeder canal.
|
Construction diagram for building a wooden box
for a horizontal underwater screen
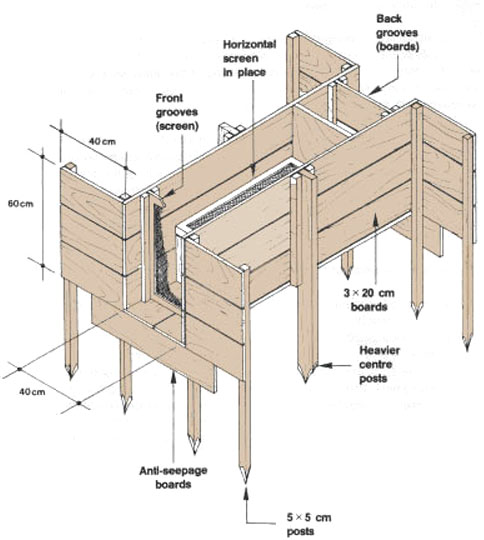 Note: the dimensions shown for the horizontal underwater screens and structures are suitable for a small pond system |
|
A metal horizontal underwater screen
 |
|
Construction diagram for building a metal horizontal
underwater screen
 |
|
Brick structure for a horizontal underwater screen built in main
feeder canal
Plan  |
|
Section
 |
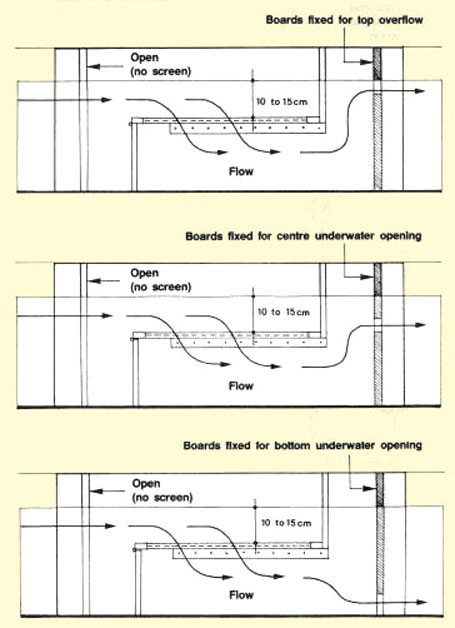
25. The horizontal underwater screen is very simple to use.
(a) Position the filtering screen in the box or structure on the screen supports as shown.
(b) In the back grooves, set a series of wooden planks, up to a level which will make the water surface rise about 10 to 15 cm above the horizontal screen.
(c) When the horizontal underwater screen is in use, no vertical screen should be in the front grooves.
26. If you wish, you can easily regulate the flow of water along the channel by setting boards in the grooves to make an underwater opening of fixed size. Be sure that-the water will rise at least 10 cm above the horizontal screen.
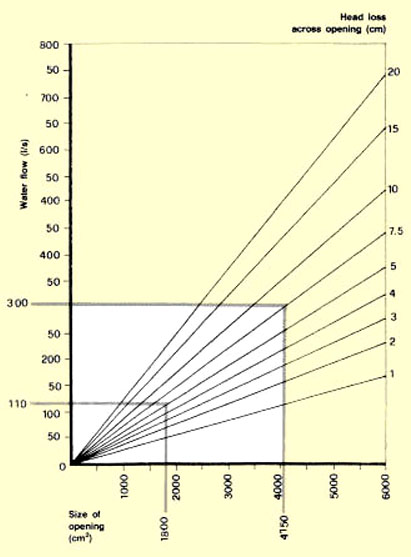
27. The flow-through system will depend on the size of the opening and on the head loss between the intake and the screen. You can use Graph 2 to estimate flow for some typical opening sizes. Note that the flow will decrease as the filter becomes blocked.
Example
28. To clean the screen, proceed as follows.
(a) Insert a full-height sliding screen in the front grooves.
(b) By hand remove all the floating debris accumulated in front of the vertical board at the back end of the screen.
(c) Grab the top of this board and lift the horizontal screen partly out of the water. The front vertical board on which the screen is hinged should remain in its position underwater.
(d) Brush the screen well.
 |
(e) Set the screen back underwater on its supports.
(f ) Remove the sliding screen from the front grooves.
30. Ideally, access to and cleaning of the filters should be easy. Although their price is often higher than sliding inlet screens, box or basket filters have some advantages:
31. There are several kinds of box or basket filters. Some are easy to build yourself with locally available materials. For others, you will need to buy special filtering cloth and may require the assistance of a good carpenter. Here are some examples.
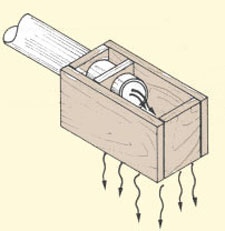
| (a) Wooden box filter attached to inlet pipe: a strong filtering screen should be used at the bottom of the box. It is useful for small water flows and rural ponds. |
Wooden box filter attached to inlet (open bottom)
 |
|
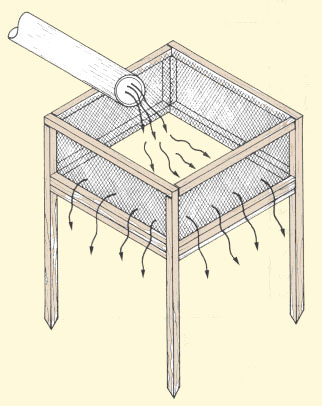
| (b) Screened box filter under inlet: the force of the inflowing water is first broken on the strong bottom. Mesh material is only used on the sides. Four legs support the box filter under the inlet at a level above maximum water level in the pond. This type is more expensive to build, and dimensions depend on water inflow: for 100- to 1000-m2 ponds, a box of 50 x 50 cm with 20 to 40 cm height is suitable. |
Screened box filter under inlet (solid bottom)
 |
|
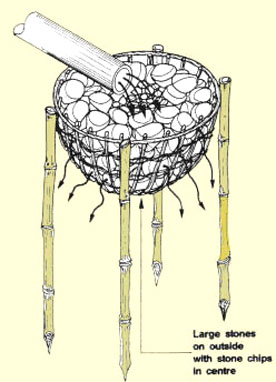
| (c) Basket filter filled with stones or chips: about 0.5 m above the pond water surface, fix under the inlet a wooden basket or half a metal drum, with bottom and sides fully perforated. Fill the outer sides with larger stones. Partly fill the middle portion with stone chips. In the upper part, leave a 20-cm hollow in which the water drops. Check and clean the basket regularly to prevent it from getting clogged. |
Stone-filled basket filter under Inlet
 |
|
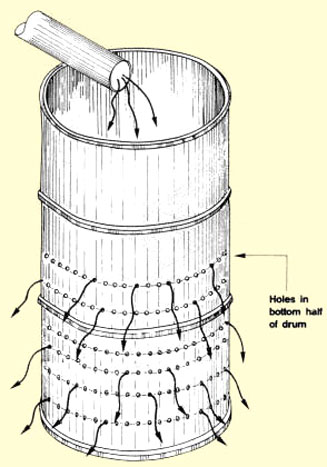
| (d) Perforated metal drum under inlet: an old metal drum, open at the top, is perforated with holes on the bottom half of its sides. Use a strong nail from the outside of the drum. Fix the drum under the inlet so that the inflowing water drops into the middle of it. Filtration efficiency depends on the size of the holes. |
Perforated metal drum under inlet
 |
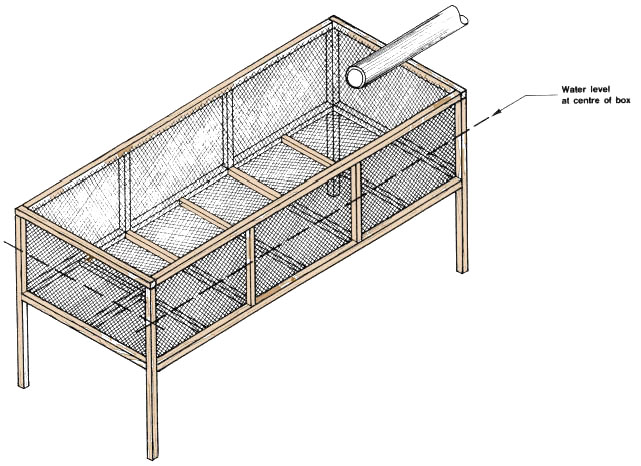
(e) Partly submerged box filter: when the distance from the inlet to the water surface is small, you can use a box filter one-half to two-thirds submerged in the pond and fixed under the inlet. Build four wooden frames and assemble them into a rectangular wooden box. Reinforce the bottom of the box so that its frame openings are smaller than 35 x 60 cm. Secure strong filtering cloth (preferably synthetic material such as saran, see paragraph 6 on in this chapter) to the inside of the wooden frame. Fix the box filter under the inlet. As long as the bottom of the box is not submerged, reduce the water inflow to prevent excessive stress and stretching of the cloth cover and to prevent the box from overflowing.
Note: dimensions vary according to water inflow. A saran-covered box filter 100 cm wide, 250 cm long and 60 cm deep is suitable for filtering water flows up to 60 l/s
|
Partly submerged wooden box filter under
inlet
 |
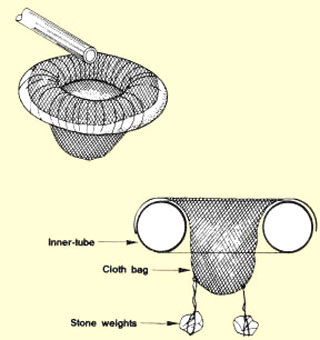
(f ) Floating box filter: similar to the previous model, except that it floats in the pond, under the inlet, with the bottom part well submerged. This filter is good in greater water depths or with varying water levels. It is preferred to the previous type whenever the inlet is high enough above the pond surface:
|
Floating wooden box filter under inlet
 |
|
|
Floating tube filter under inlet
 |
33. A barrage filter acts as a barrier in the feeder canal, and it can considerably reduce the flow of water unless it has a large enough area and a sufficient head to push the water through it. When designing the dimensions of your barrage filter, you should allow at least 1 m3 of filter for every 1 l/s of water flow, and allow at least 5 cm of head to permit water flow through the filter. The filter should be at least 1 m thick.
34. As a general rule, make the filter at least four times as wide as the feeder canal on which it is to be built.
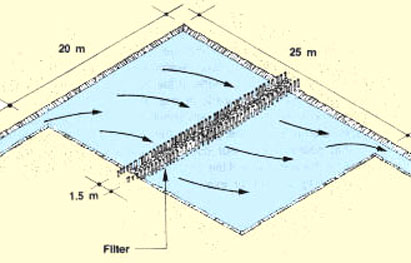
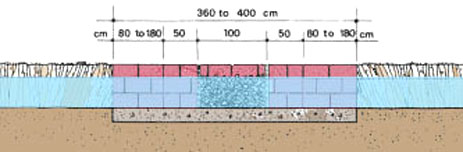
35. Here are some examples of how you can build a barrage filter on your main feeder canal.
(a) A simple and inexpensive barrage filter can be designed as a small, shallow pond measuring 20 x 25 m. Between two parallel rows (distance 1.5 m) of wooden poles (diameter 3 to 12 cm) driven 30 cm vertically into the ground at close intervals, stones, gravel and stone chips are piled up to a level slightly higher than the maximum water level in the canal, for example 1 m.
|
How to widen a feeder canal for a barrage filter
 |
|
Section through stone- and gravel-filled filter
 |
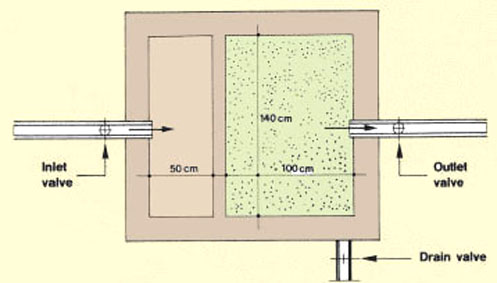
(b) A barrage filter with a brick or block chamber: the feeder canal is enlarged to build a rectangular chamber on a solid foundation (see Pond construction, 20). Across this chamber two metal screens made, for example, of heavy metal mesh or round iron bars, are set in grooves 1 m apart. Stone chips and gravel are piled up tightly between the screens, to slightly above the maximum water level in the canal. The structure is completed with an inlet and an outlet channel, also of brick or block, from 80 to 100 cm in length.
|
Plan
 |
|
Section AA
 |
|
Section BB
 |
(c) A somewhat more sophisticated barrage filter, similar to the previous one, can also be built in concrete with 7.5-cm walls and a 10- to 15-cm foundation.
|
Concrete block barrage filter
(20 x 20 x 40 cm blocks)  |
36. Upflow filters are more sophisticated and are more expensive to build. Skilled masonry work is essential for their construction. The filter needs to be set up and handled very carefully or it may fail to work. Repairs are generally difficult and costly. However, such a filter has the advantage of making it possible to reverse the water flow (backwash) and to wash out routinely the deposited silt and other particles from the filtering material. Such reverse cleaning should be carried out regularly, sometimes even daily if the turbidity is high. Regular cleaning allows the filter to be used for removal of quite fine particles. Its use is particularly appropriate where clean water is essential, such as in a hatchery for breeding fish (see Sections 9.0 to 9.4).
|
Plan of masonry upflow filter
 |
|
Vertical section
 |
37. To operate an upflow filter, proceed as follows.
(a) Be sure the water inflow passes through a screen first to remove the larger debris and avoid clogging the draining valve. Check that the draining valve is closed.
(b) Open the inlet valve and the outlet valve. The water should pass through the filtering material under some pressure.
38. To clean the upflow filter:
The filter is then ready to be used again.