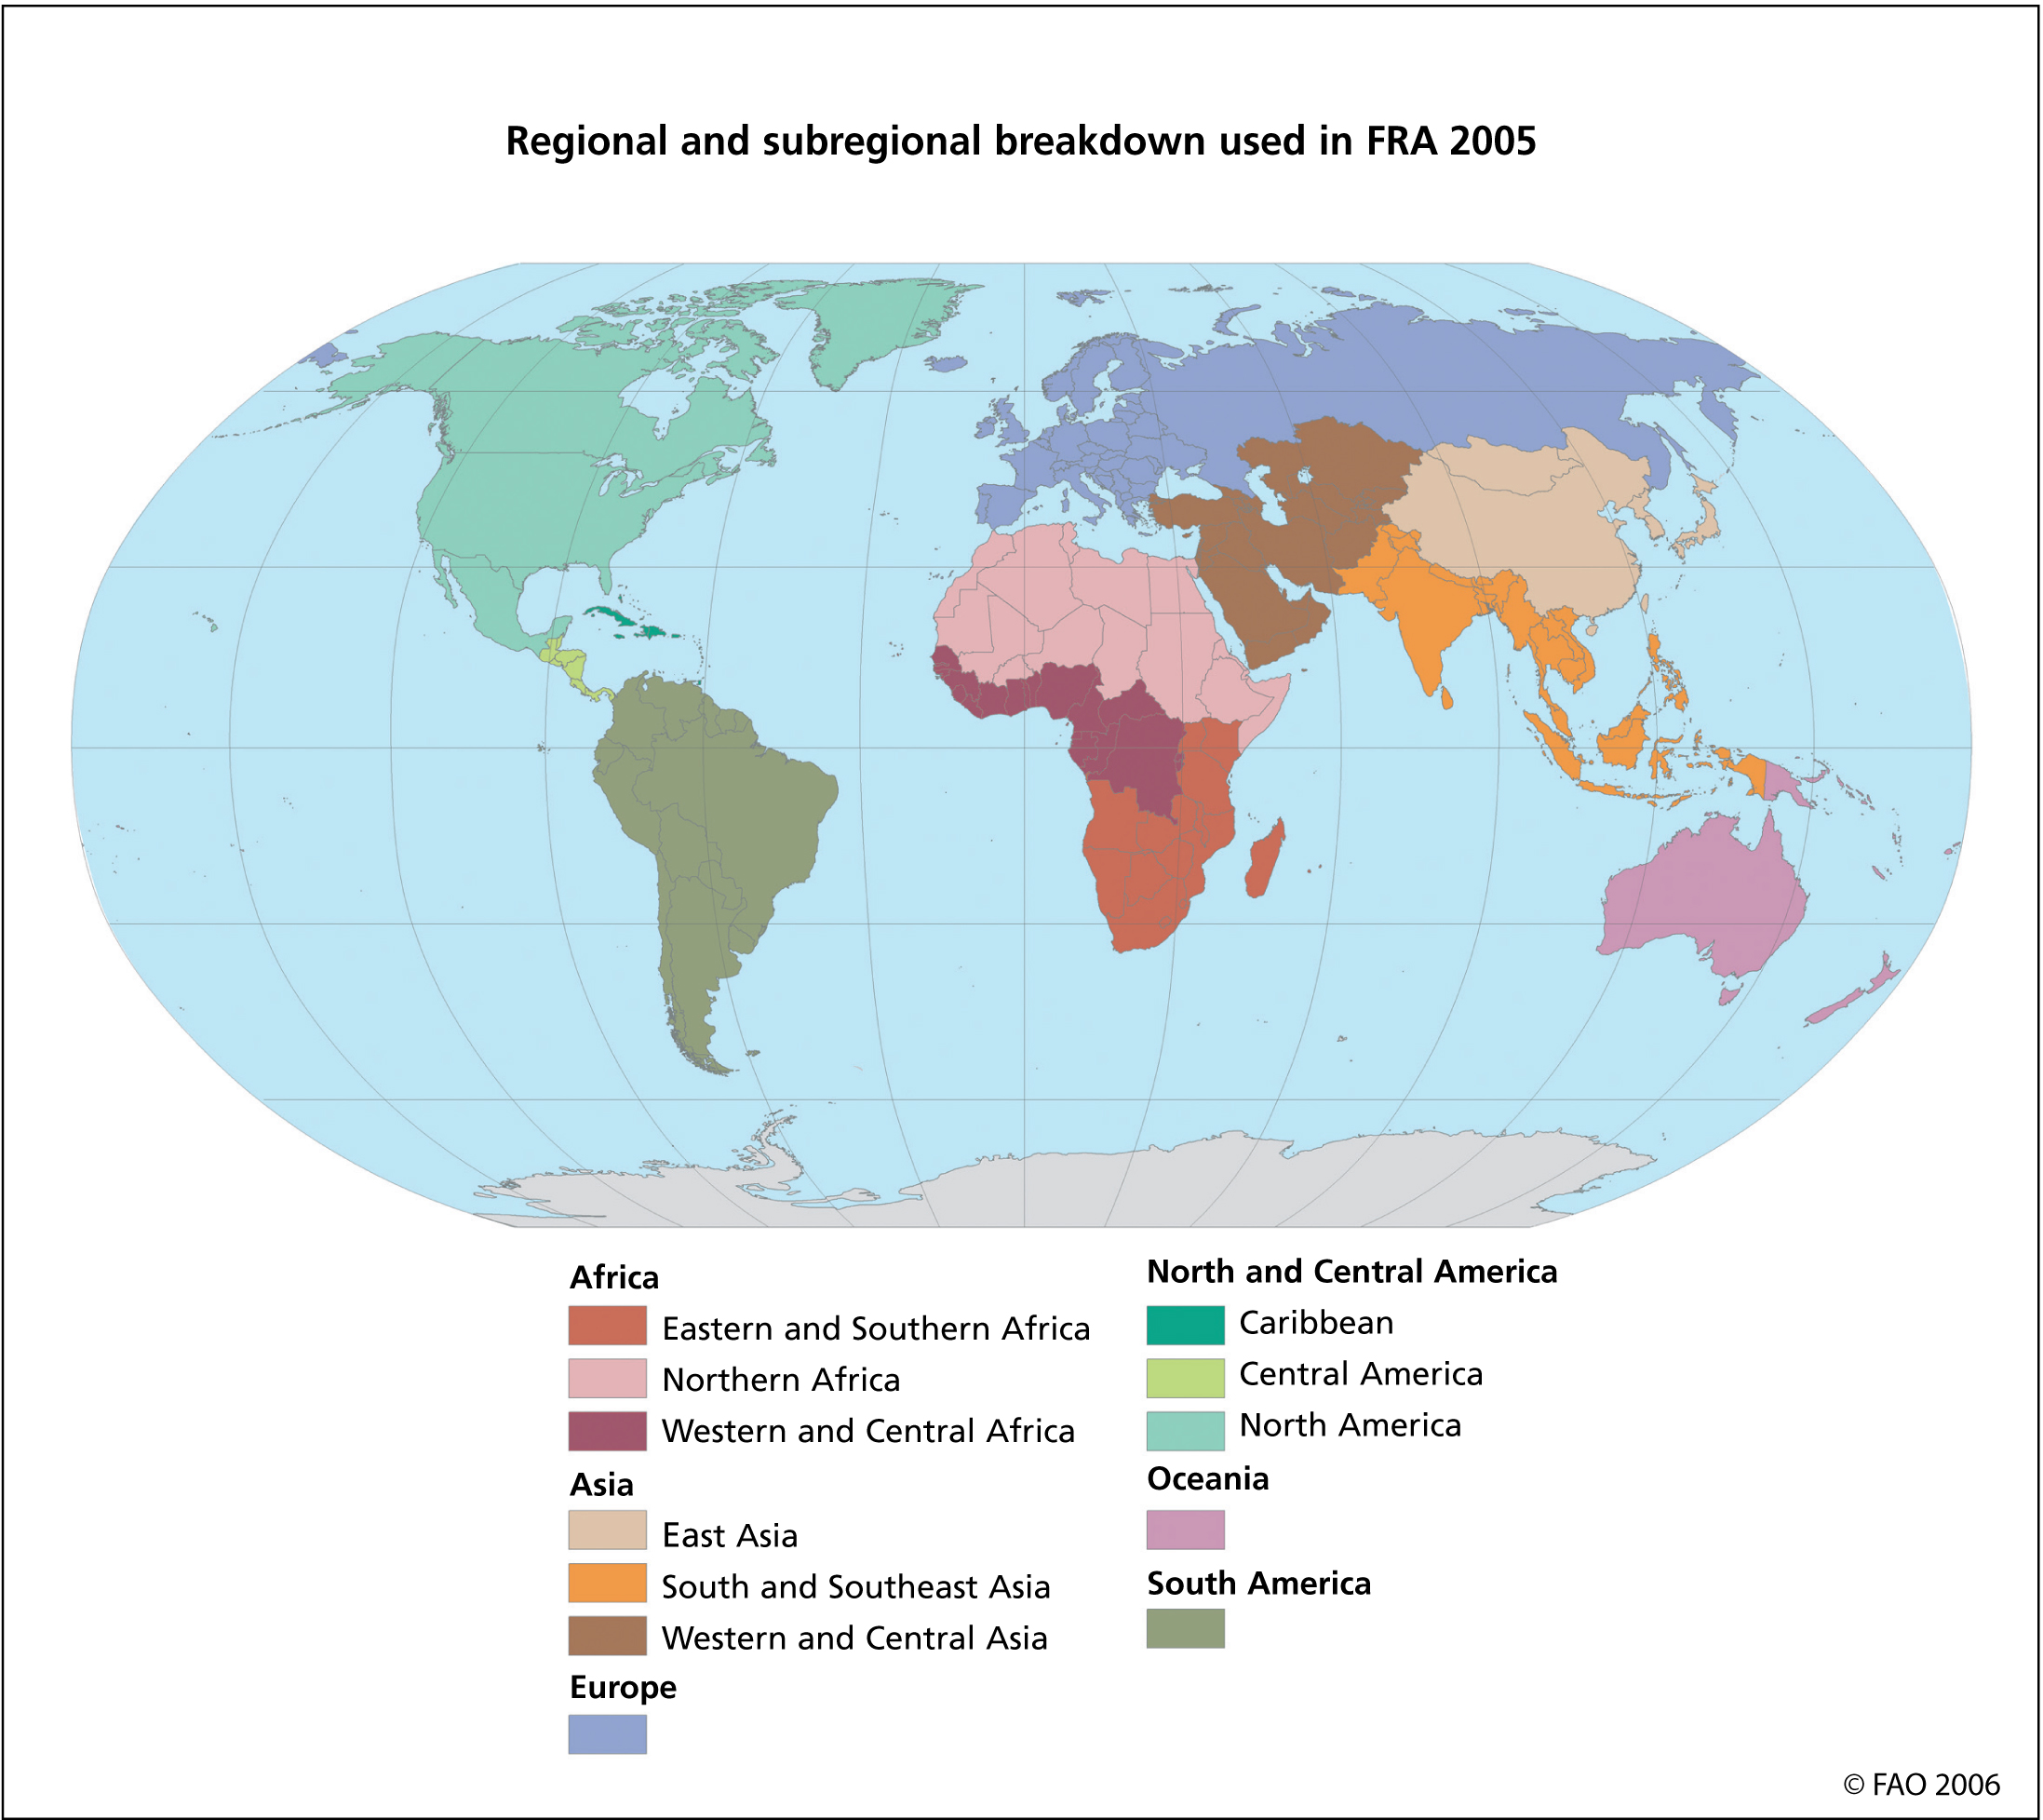
Regional and subregional breakdown used in FRA 2005
This map shows the grouping into regions and subregions that was used in global forest resources assessment 2005.
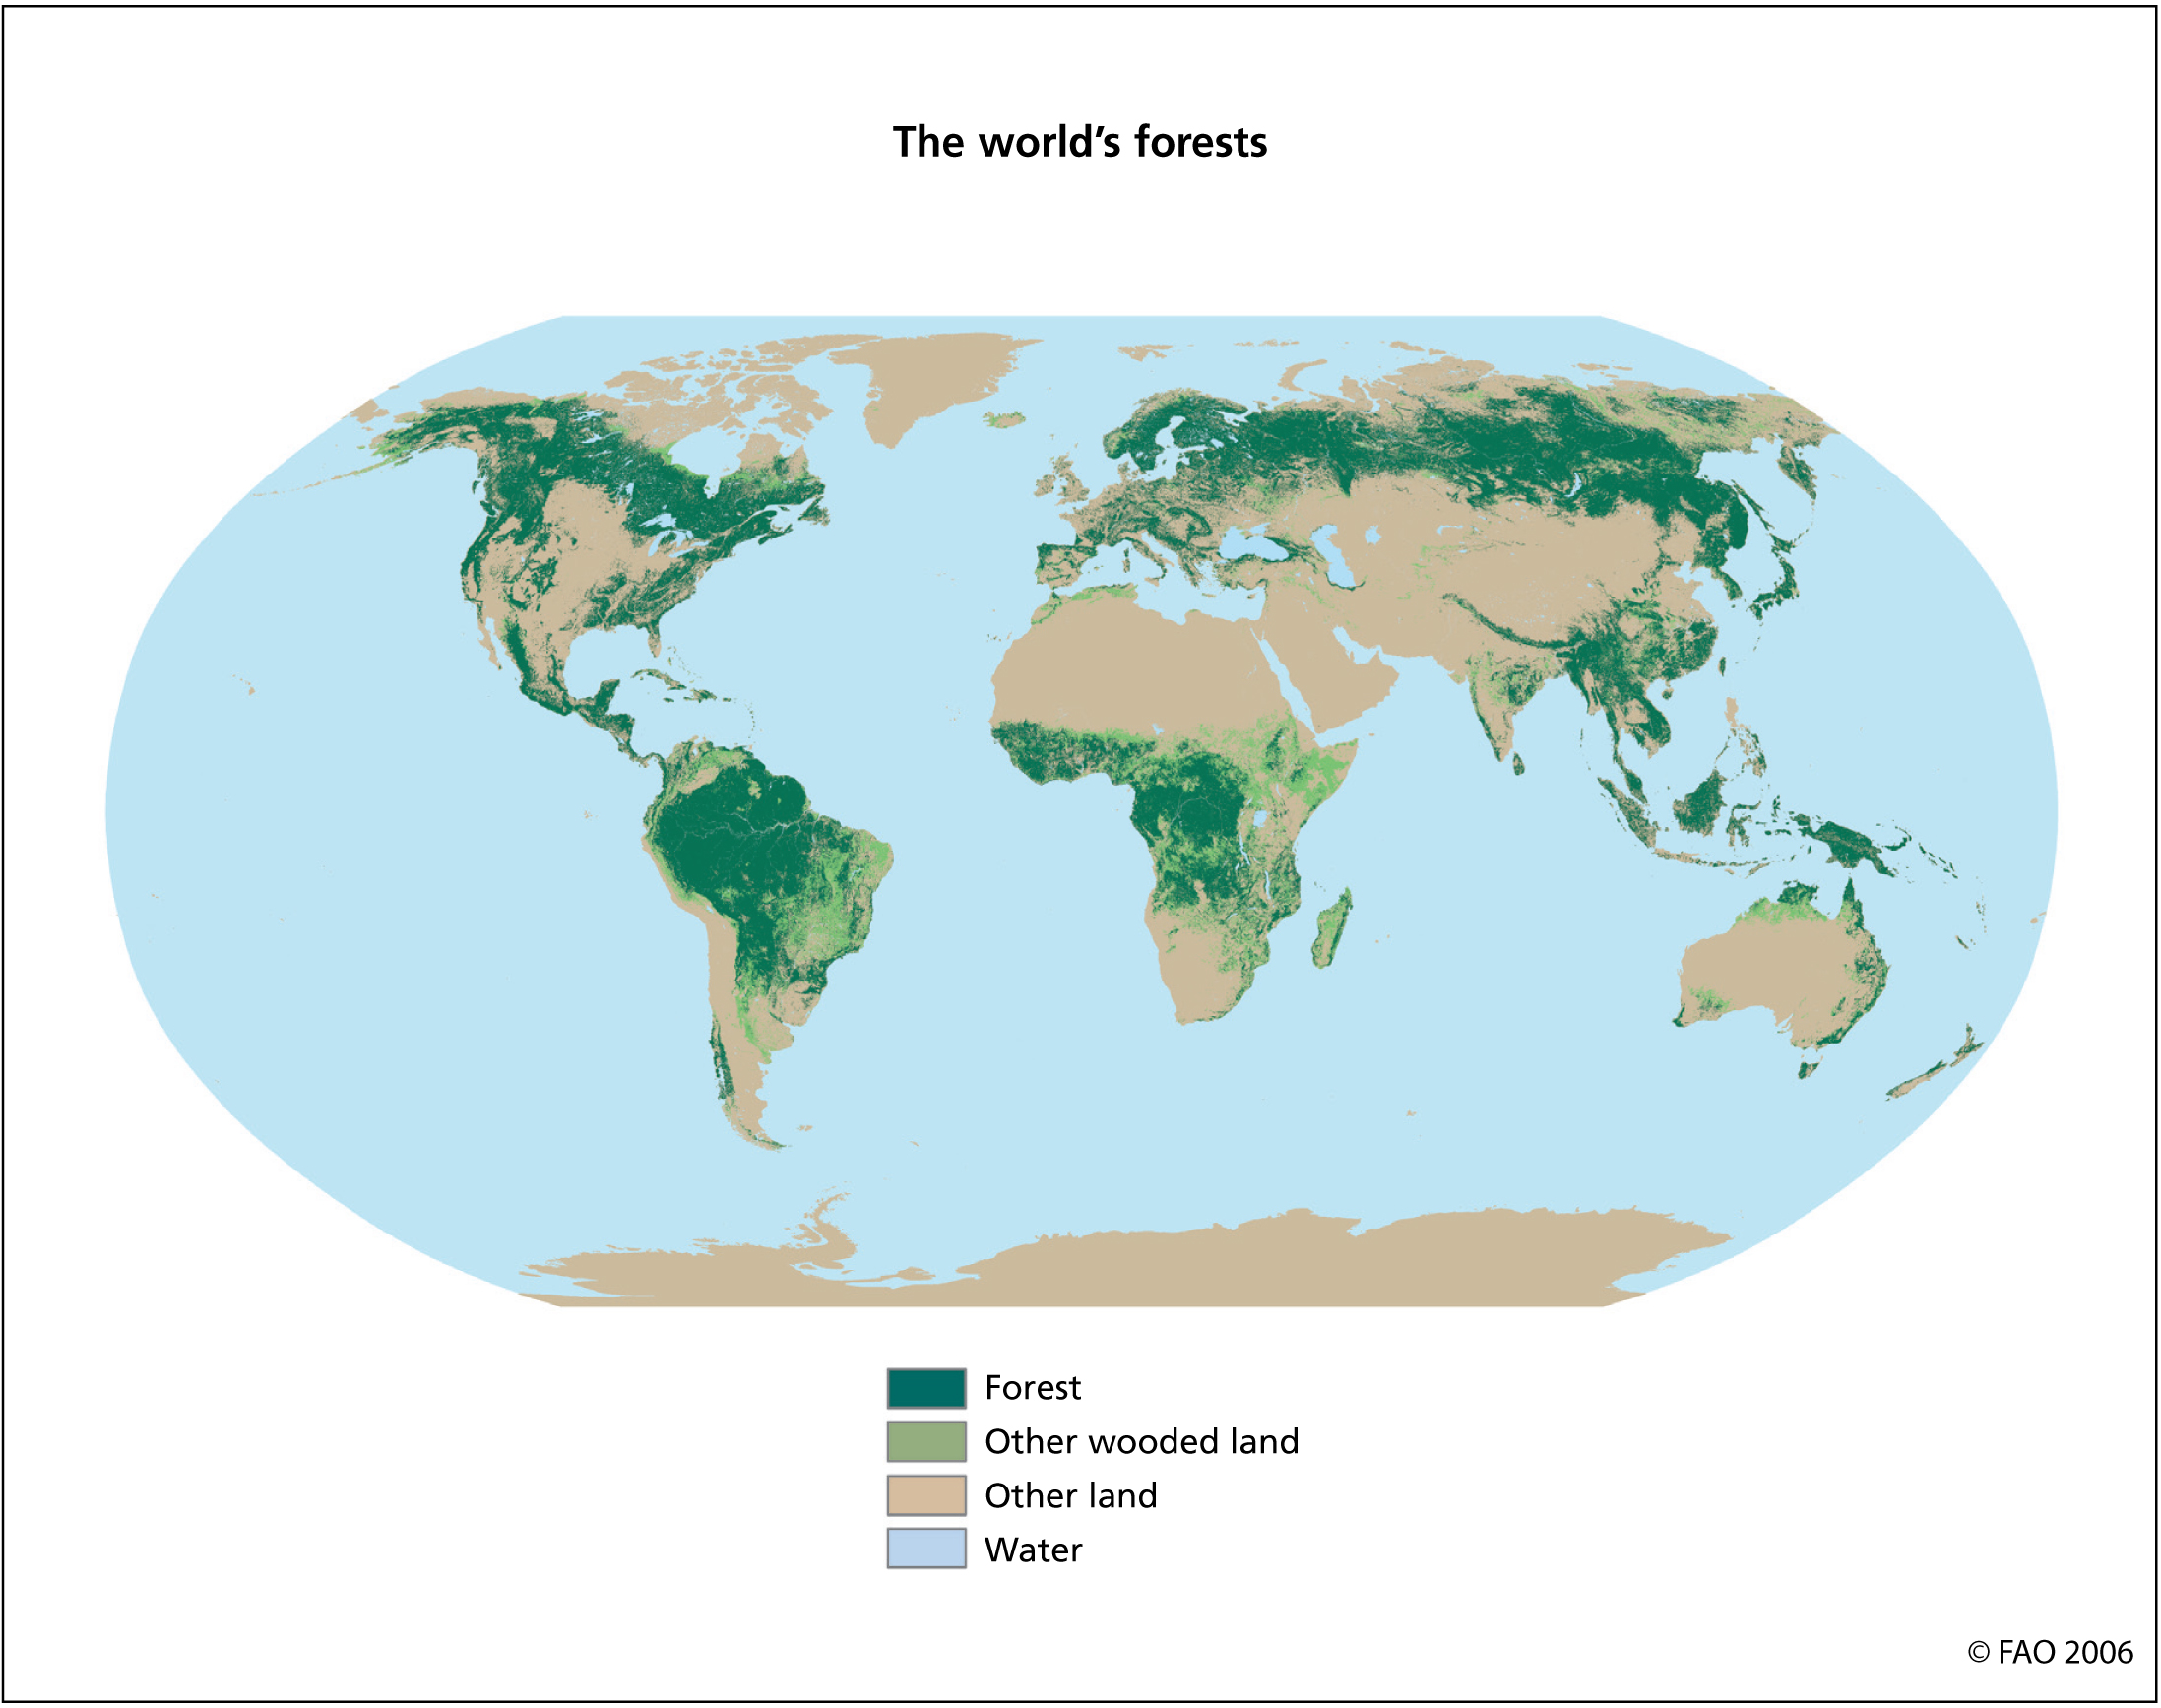
The world’s forests
This map of the world’s forest was produced as part of FRA 2000 in collaboration with many partners. It has been updated to correspond to the categories used in FRA 2005. In 2005, the world’s total forest area is estimated at 3 952 million hectares, which corresponds to about 30% of the land area.
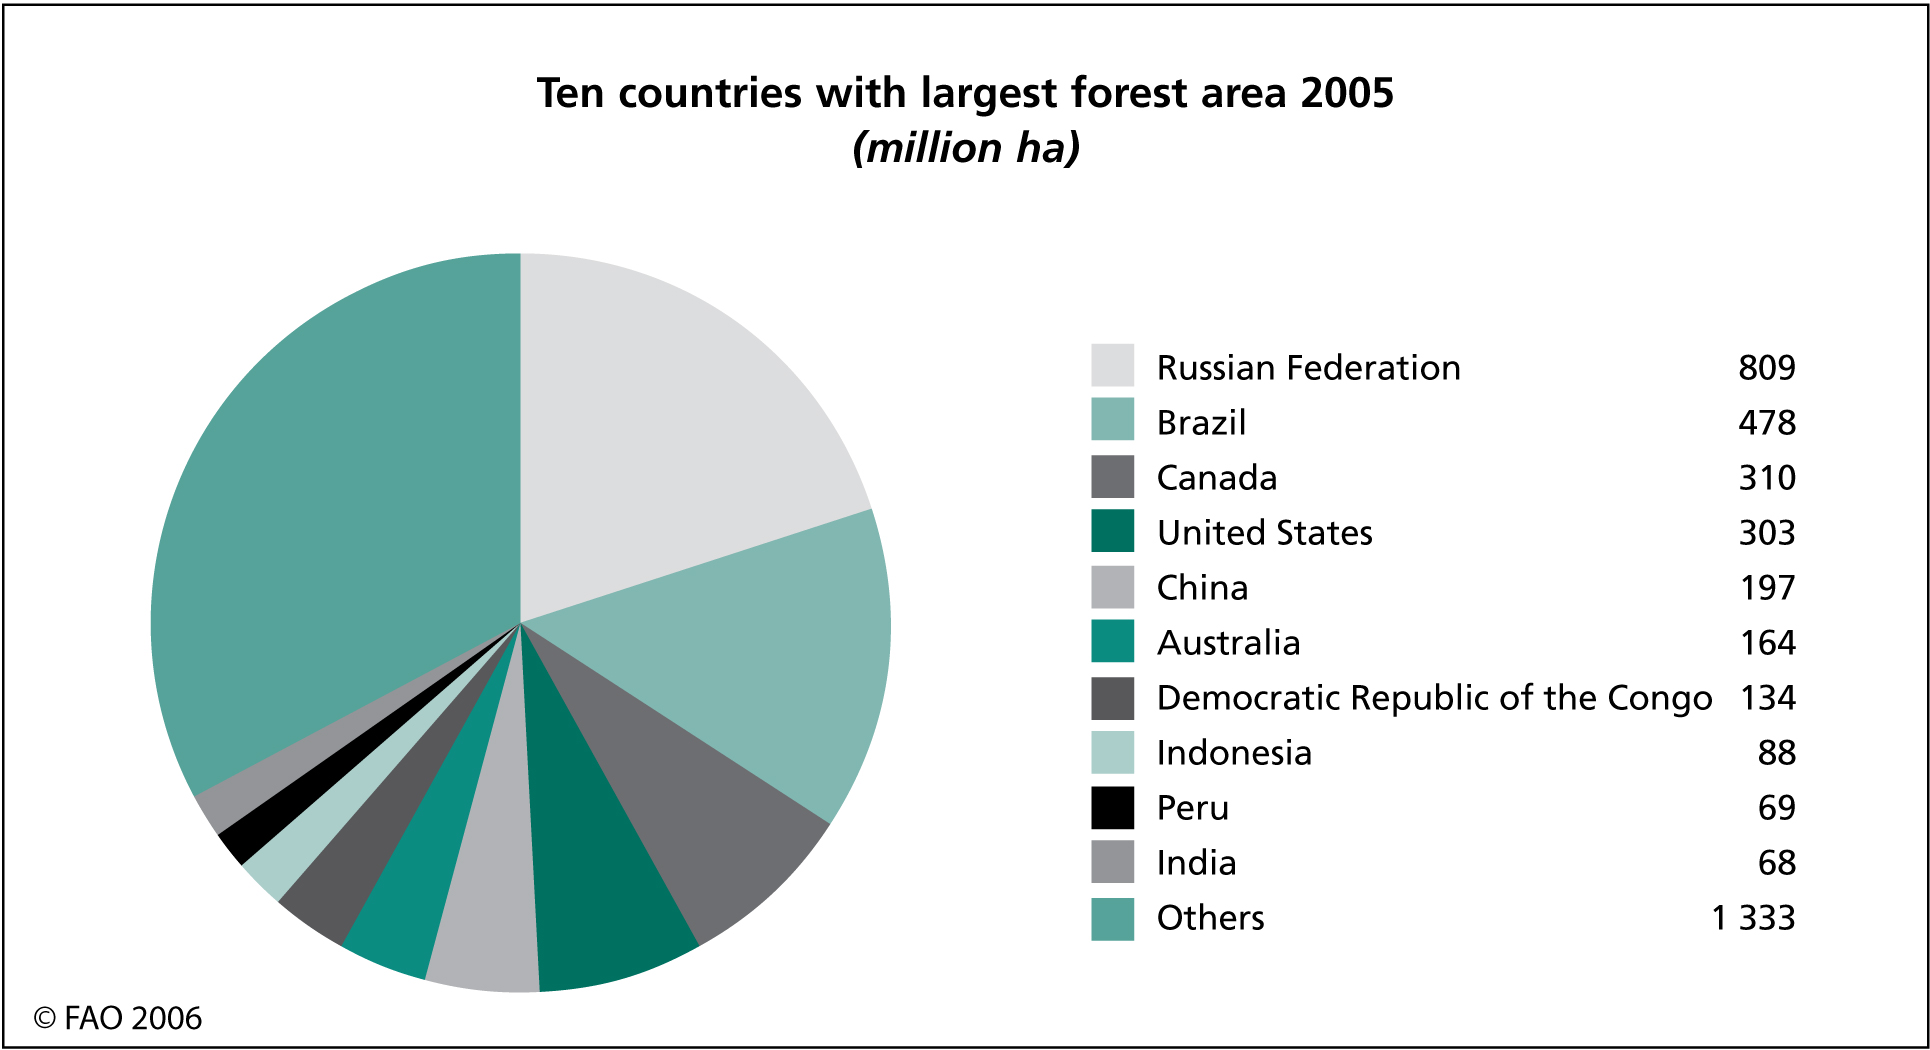
Ten countries with largest forest area
This figure shows the ten countries with largest forest area 2005. These ten countries account for 66% of the world’s total forest area.
Forest area in percent of land area
This map shows the forest area in percent of land area by country 2005. Light green colours are low forest-cover countries and dark green colours are high forest-cover countries.
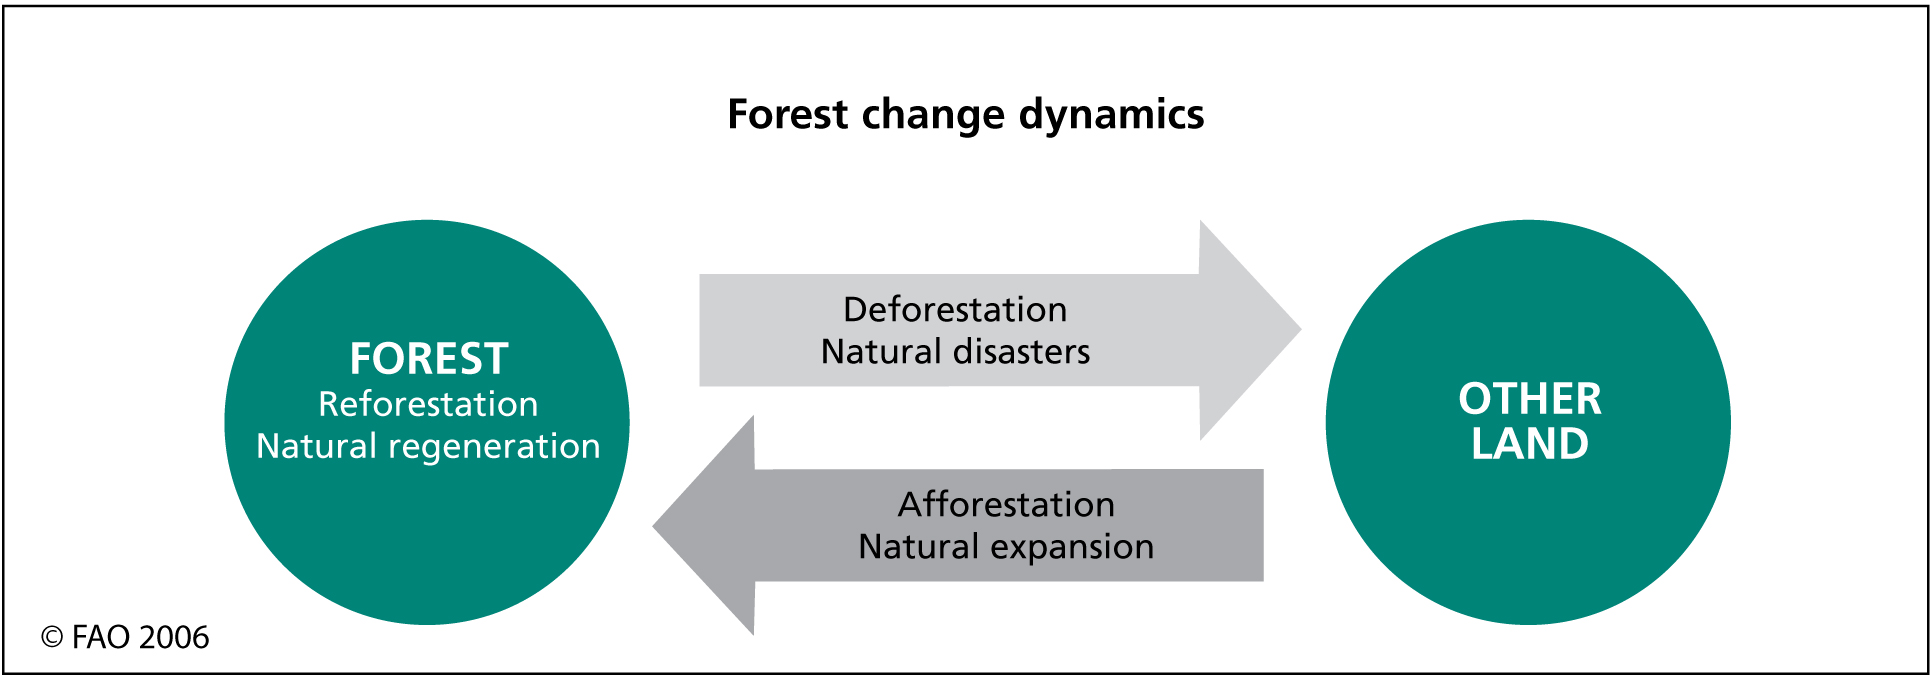
Forest change processes
This figure illustrates the forest change processes and concepts such as deforestation, afforestation, reforestation and natural expansion of forests.

Annual net change in forest area
This figure shows the annual net change of forest area by region for the periods 1990-2000 and 2000-2005. The world’s total net loss of forest area was 7.3 million hectares per year in the period 2000-2005 compared to 8.9 million hectares per year in the period 1990-2000.

Countries with large net changes in forest area
This map shows the countries that had large net changes in forest area in the period 2000-2005. A large net increase is marked green and a large net loss is marked red.
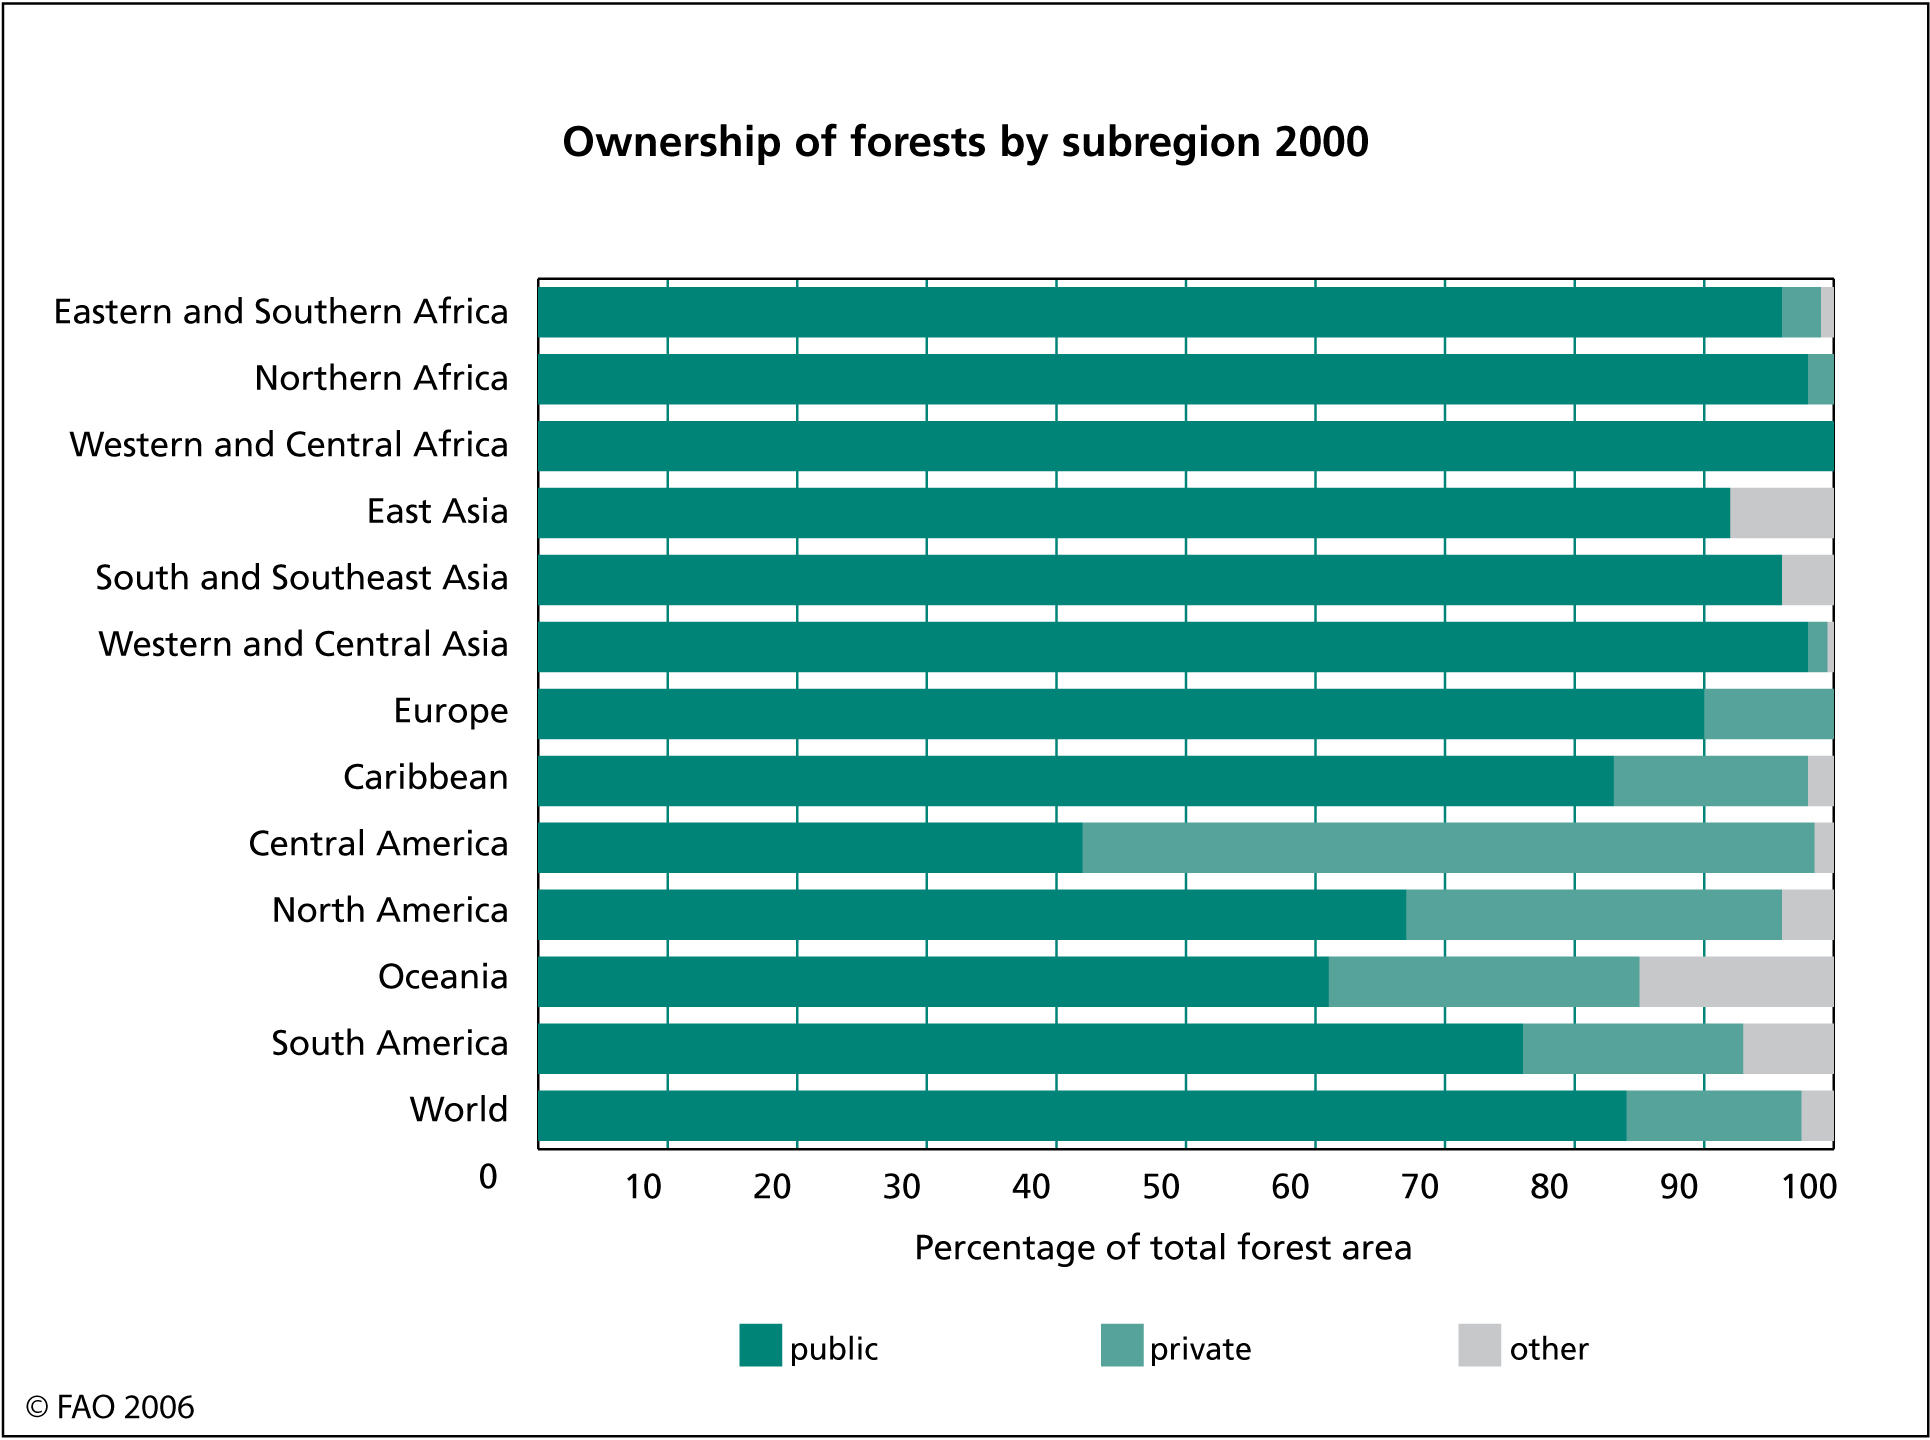
Ownership of forests by subregion 2000
This figure shows public and private ownership of forests by subregion for year 2000.

Forest characteristics
This figure shows the percentage of the world’s forest area 2005 that are primary forests, modified natural and semi-natural forests and forest plantations.
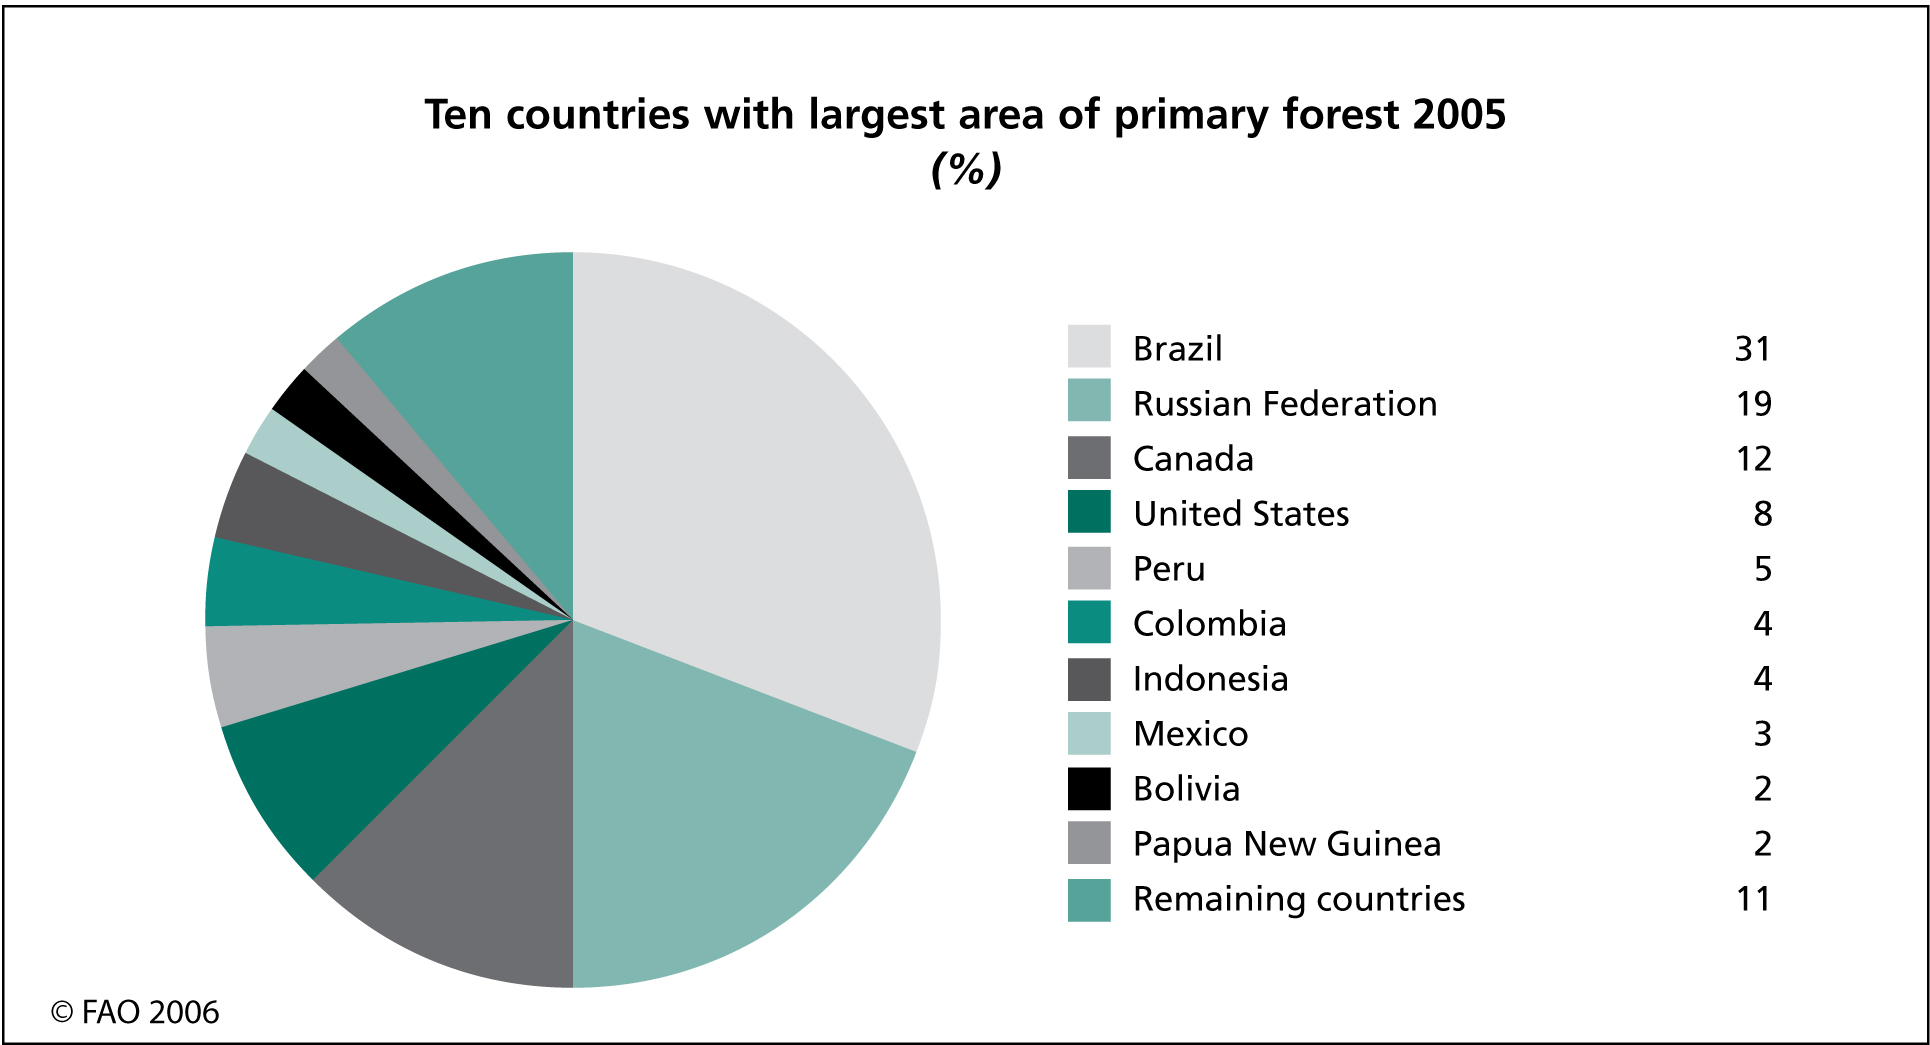
Ten countries with largest area of primary forest 2005
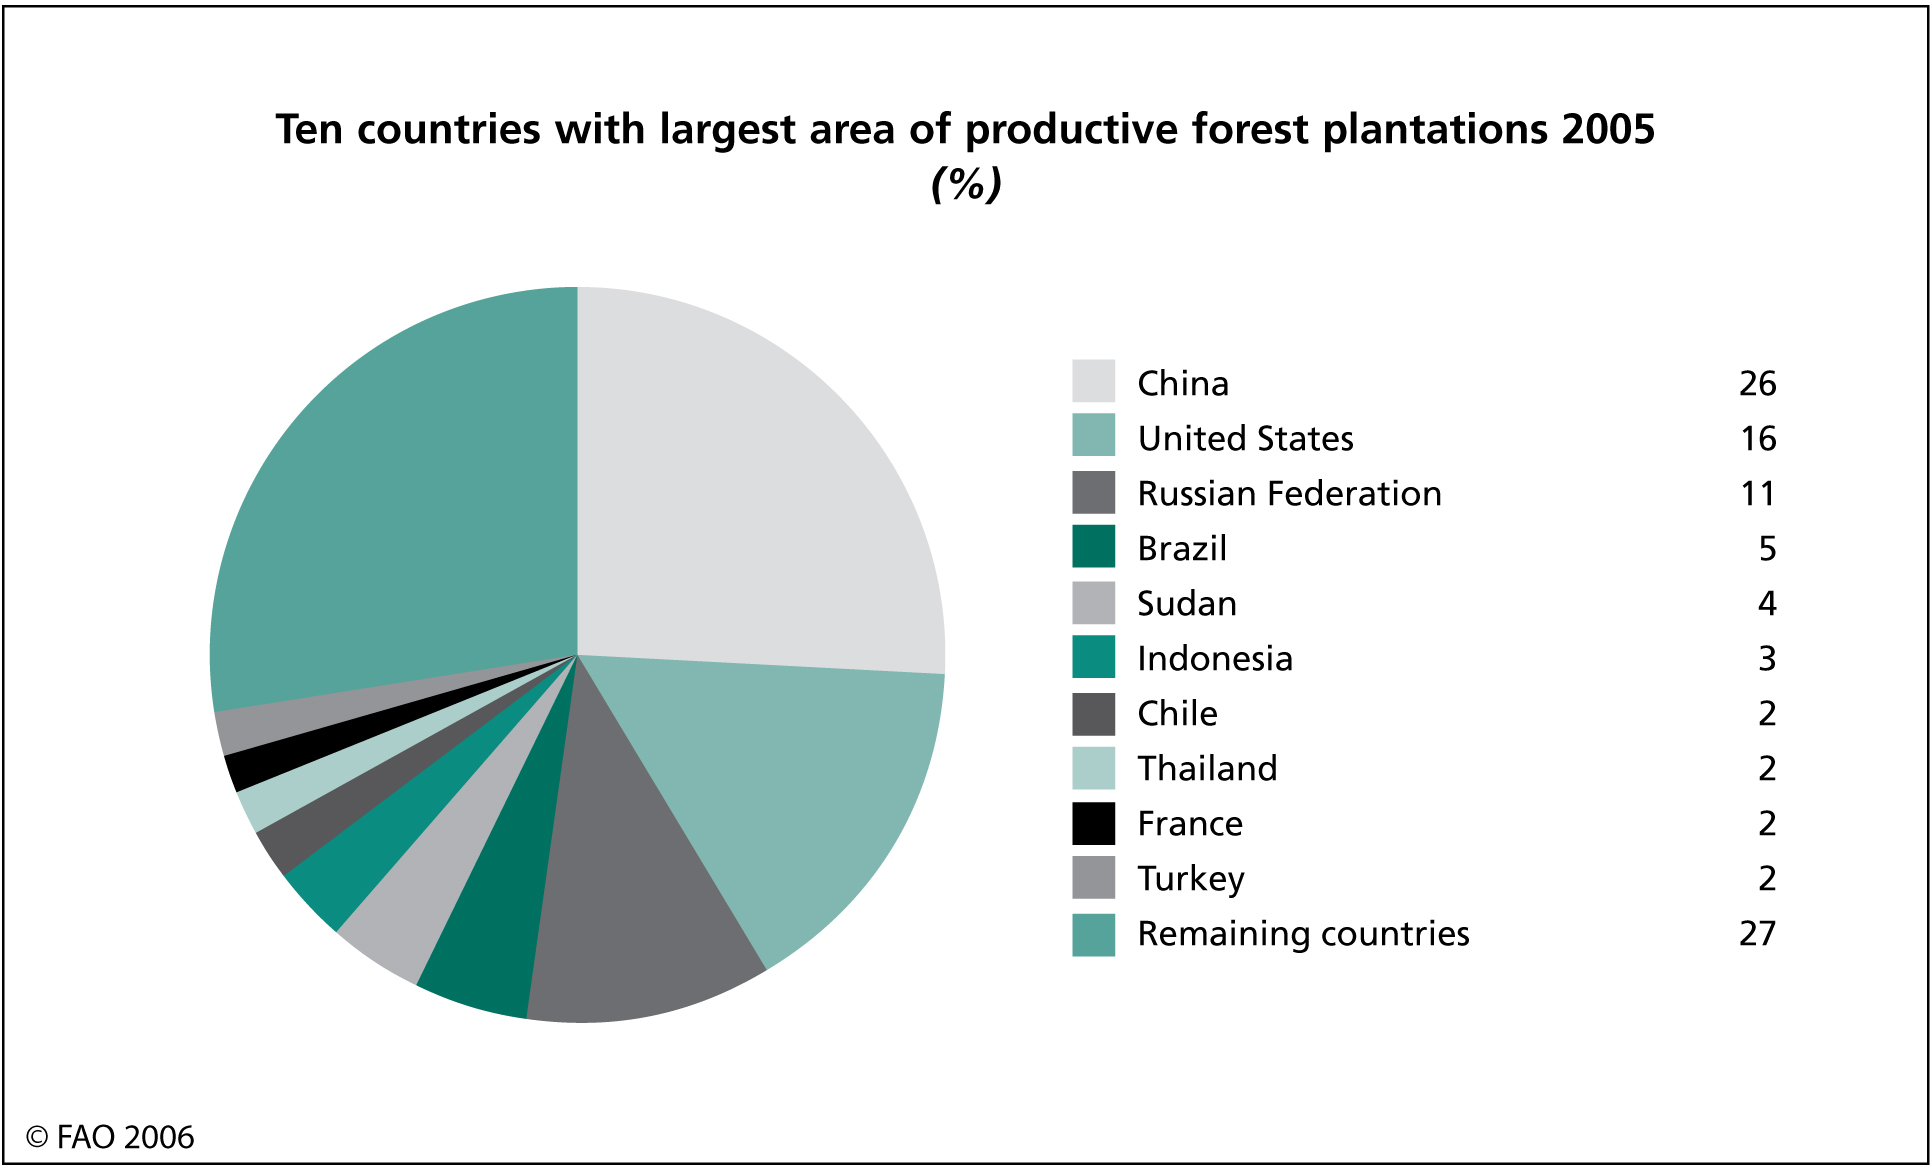
Ten countries with the largest area of productive forest plantations 2005
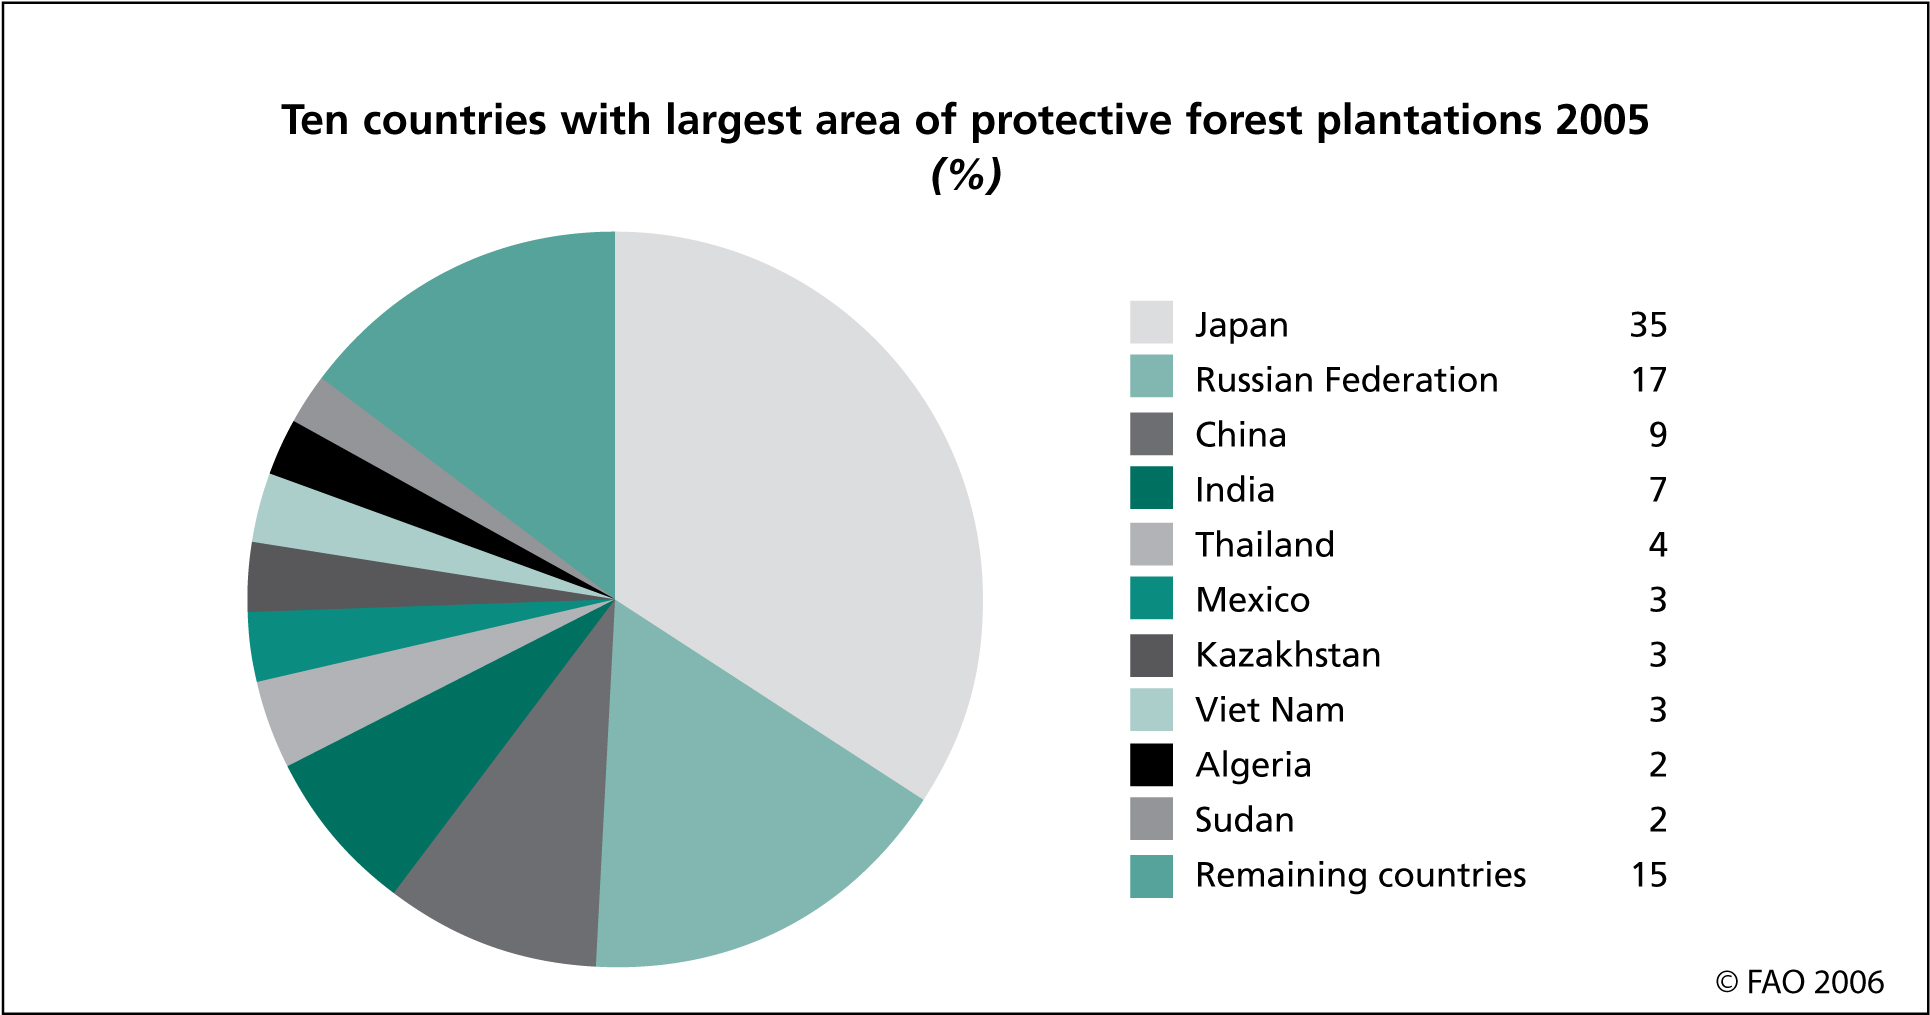
Ten countries with largest area of protective forest plantations 2005

Global trends in forest characteristics
This figure shows how the area of primary forest, modified natural and semi-natural forests and forest plantations have changed during the period 1990-2005.

Designated functions of forests
This figure shows the percentage of the world’s forest area 2005 that are designated for different purposes, such as production, protection, conservation, social services and multiple use.
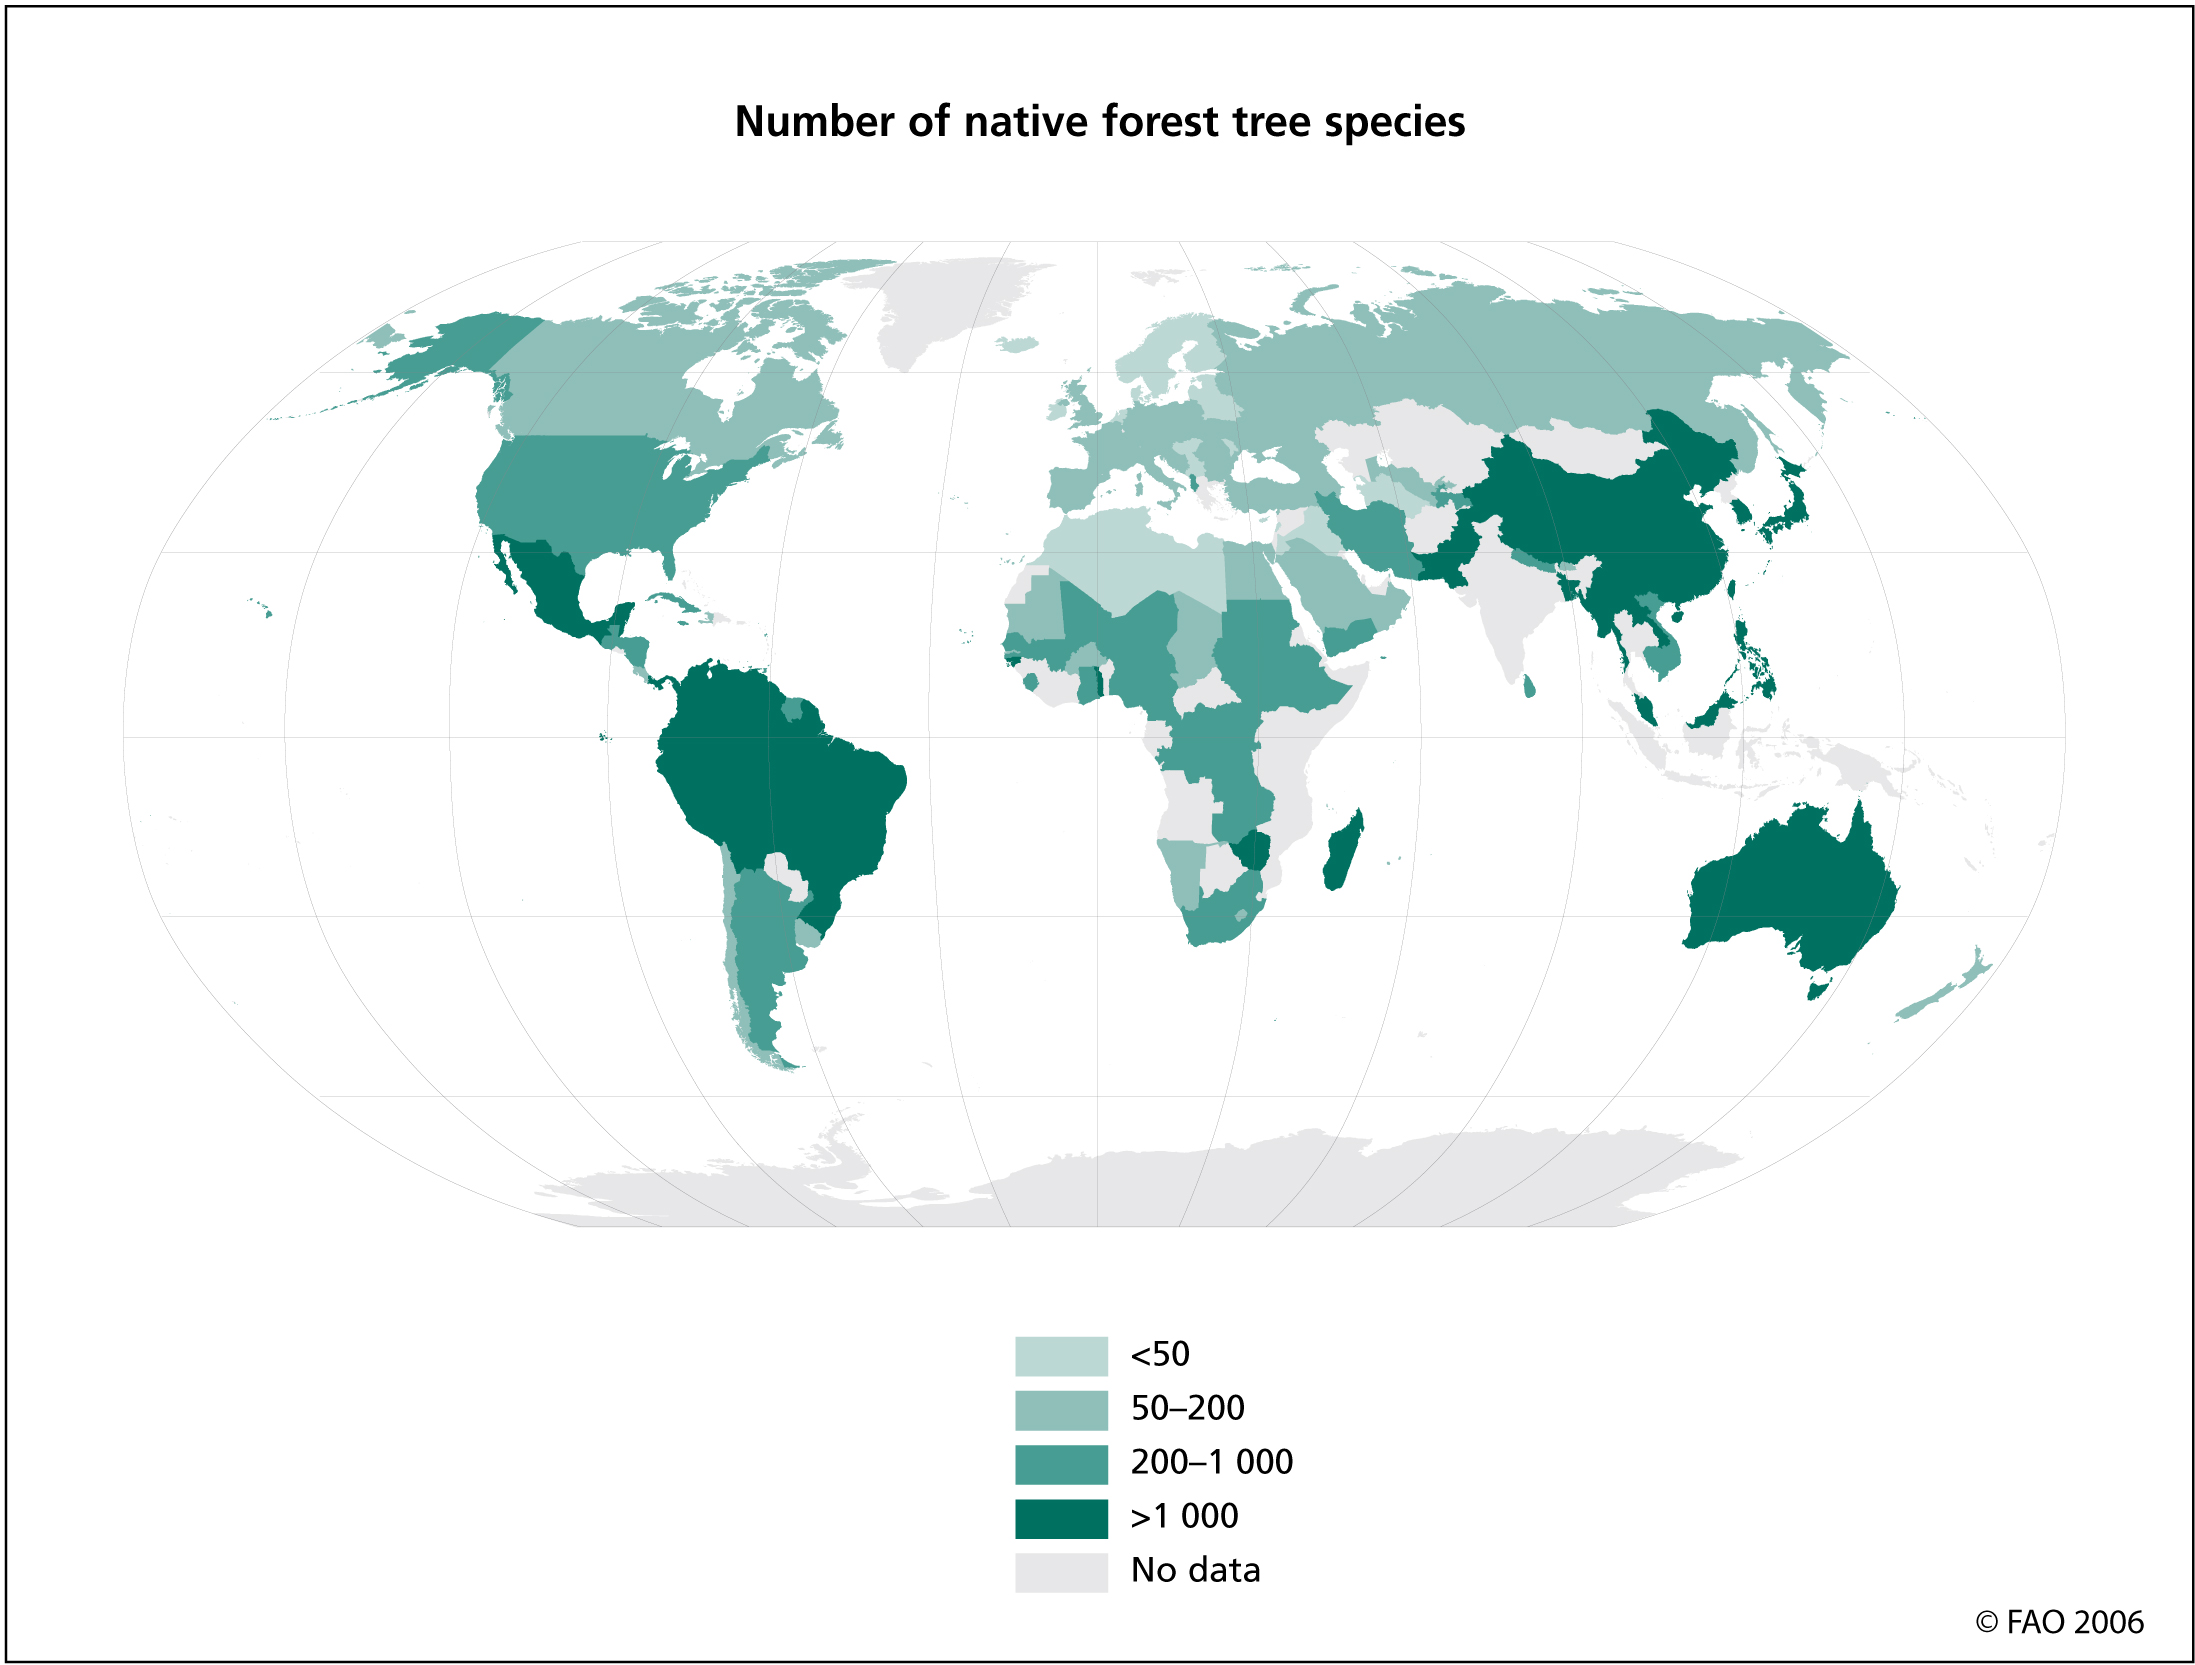
Number of native forest tree species
This map shows the number of native forest tree species by country.
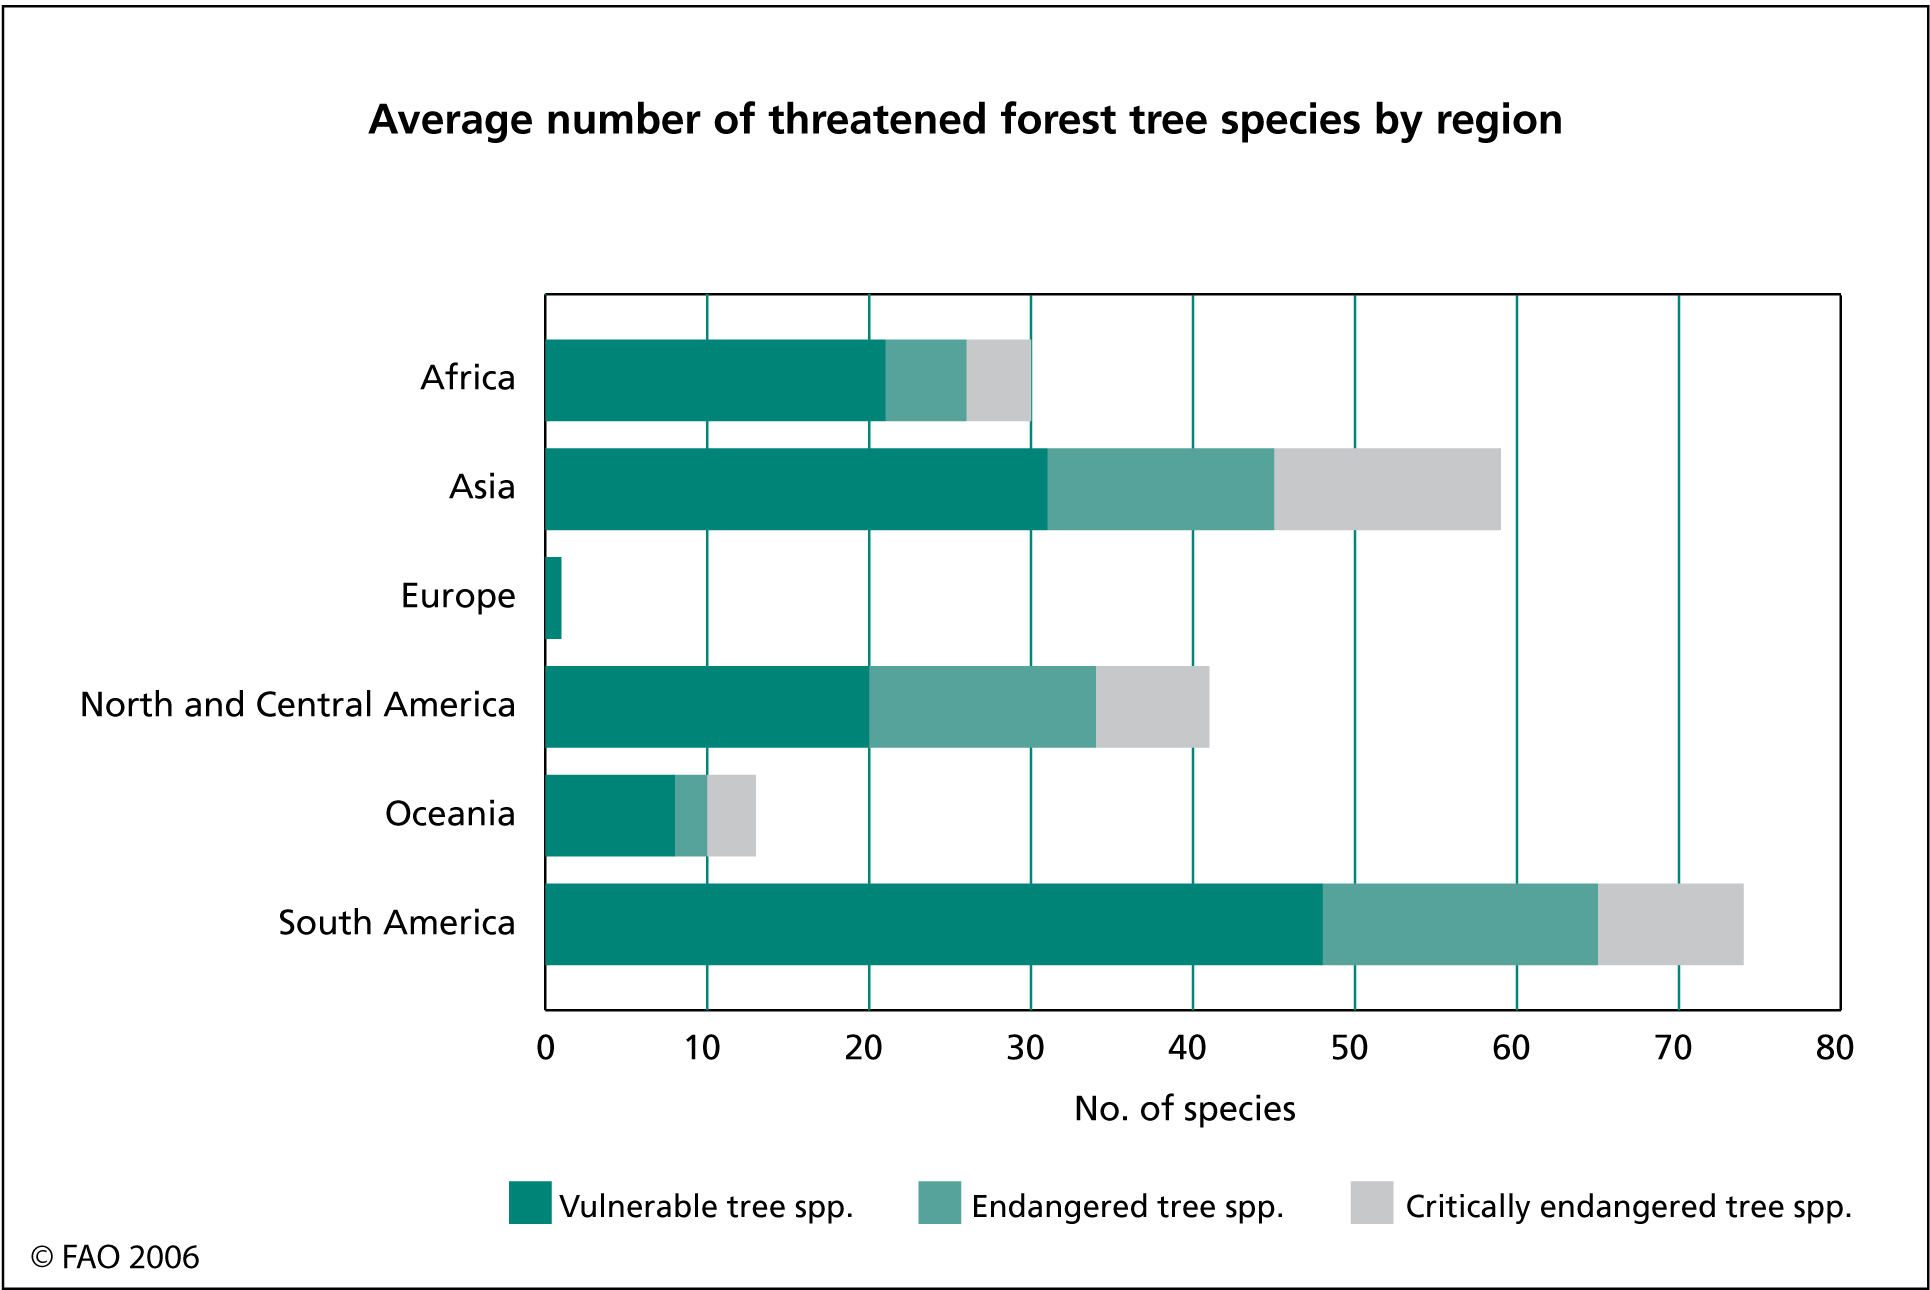
Average number of threatened forest tree species by region
This figures shows the average number of threatened forest tree species in a country by region. Threatened species are classified in vulnerable, endangered and critically endangered according to the IUCN Red list classification.
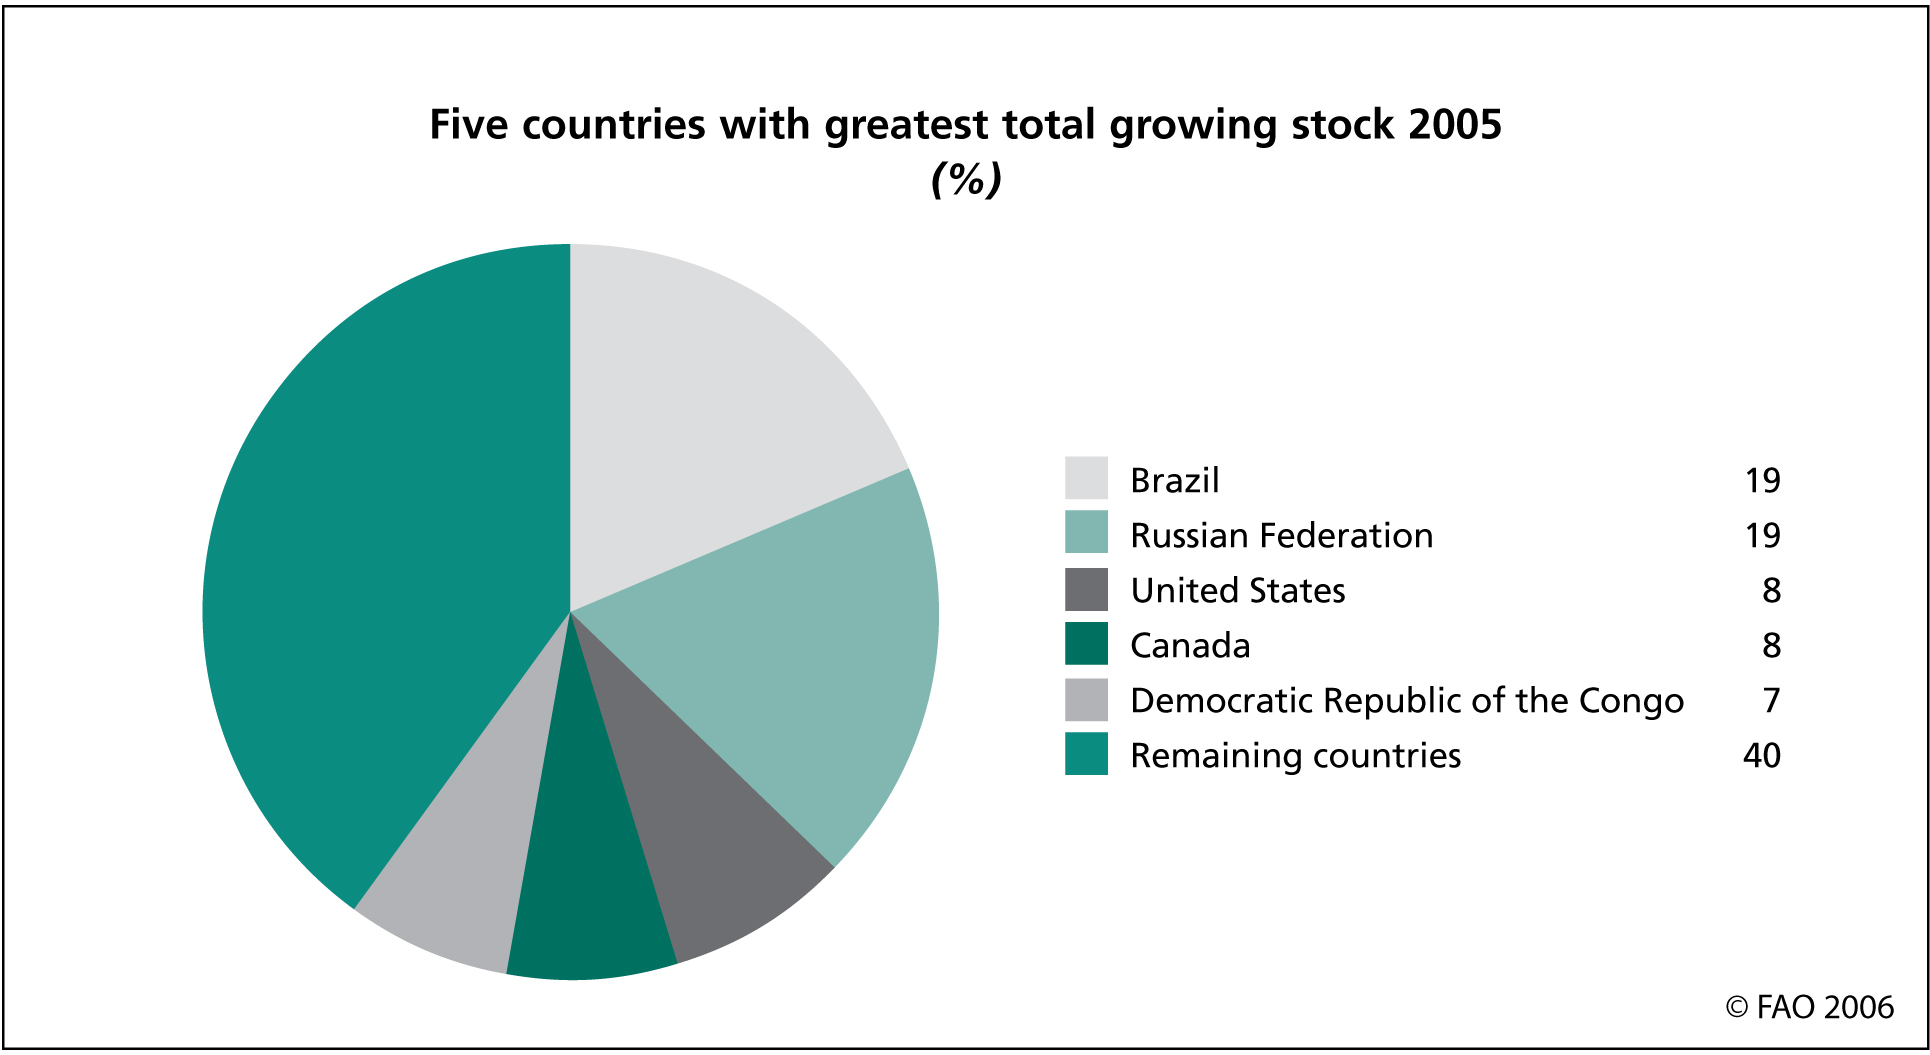
Five countries with the greatest total growing stock 2005

Total carbon stock in forests
This figure shows the total carbon stock in forest 2005 by region, split on the following carbon pools: biomass, dead wood, litter and soil.

Five countries with the largest volume of wood removals 2005
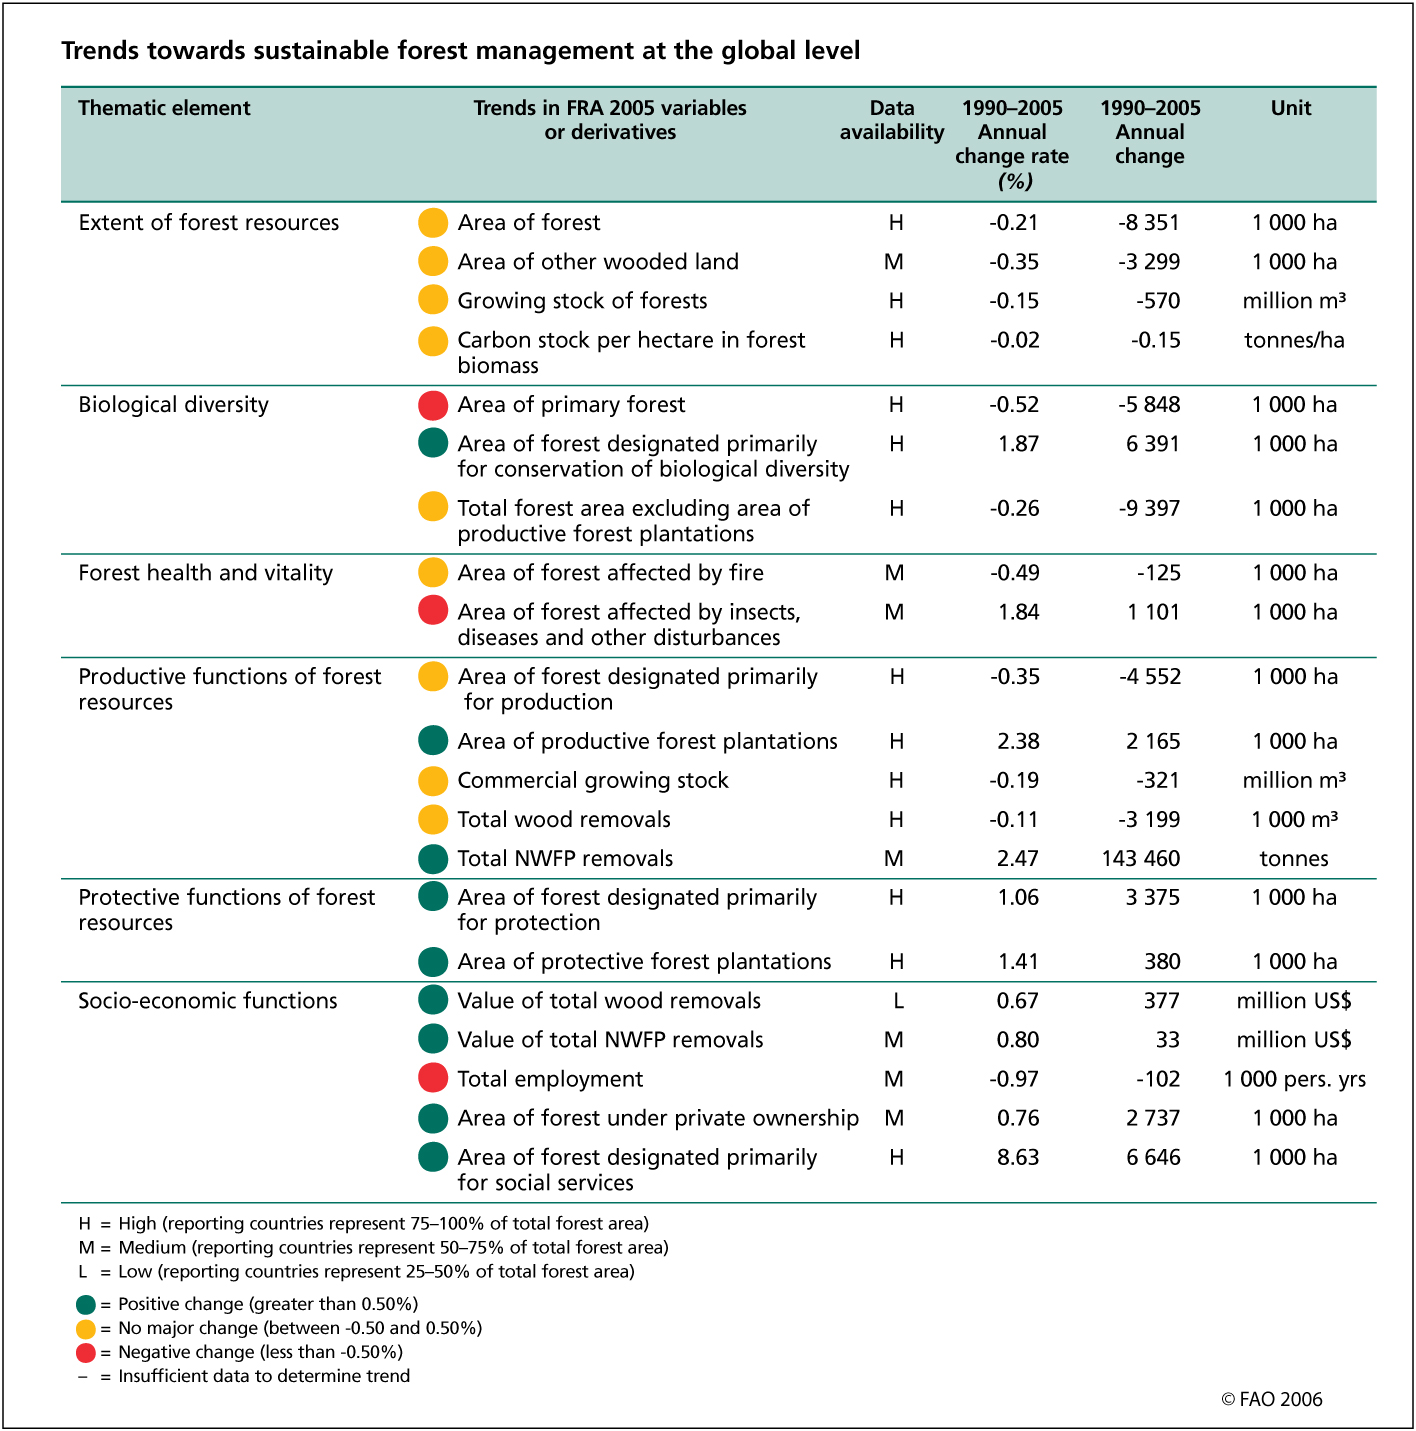
Trends towards sustainable forest management at the global level
This figure shows the global trends of a number of key variables for sustainable forest management. The colour of the traffic-lights are based on the annual change rate of these key variables.
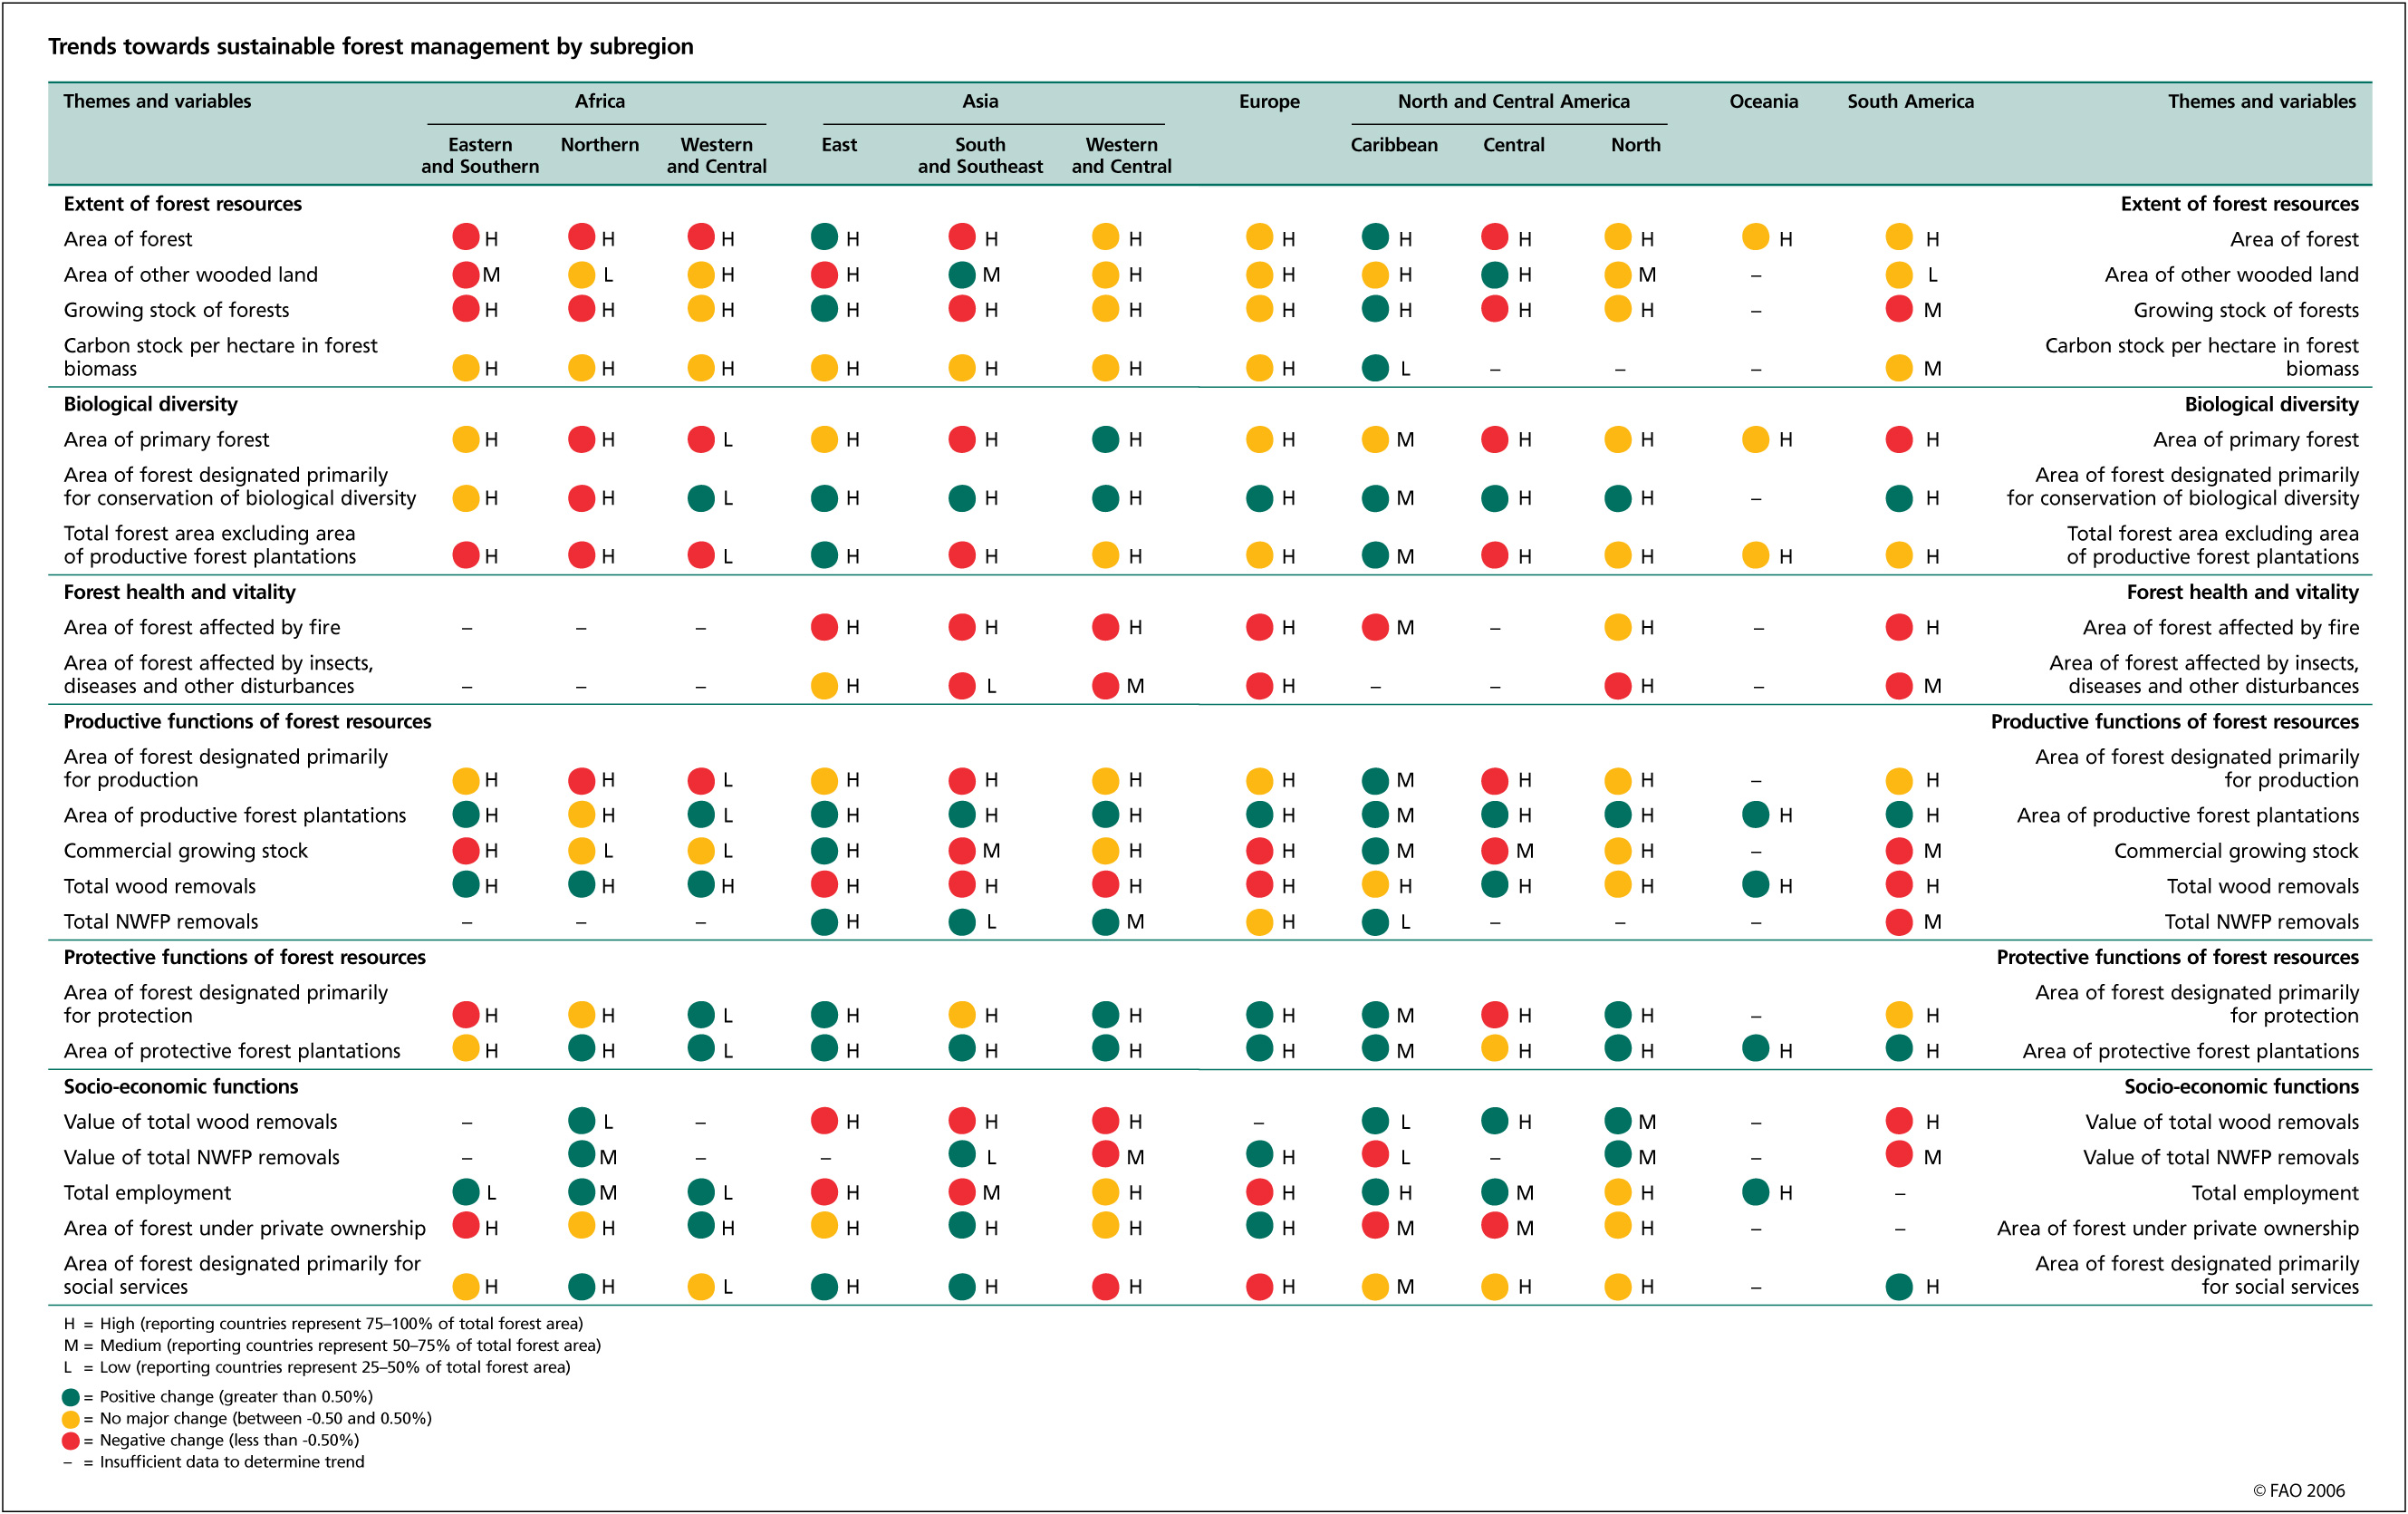
Trends towards sustainable forest management by subregion
This figure shows the traffic-lights on trends towards sustainable forest management by subregion.