|
|
|
|
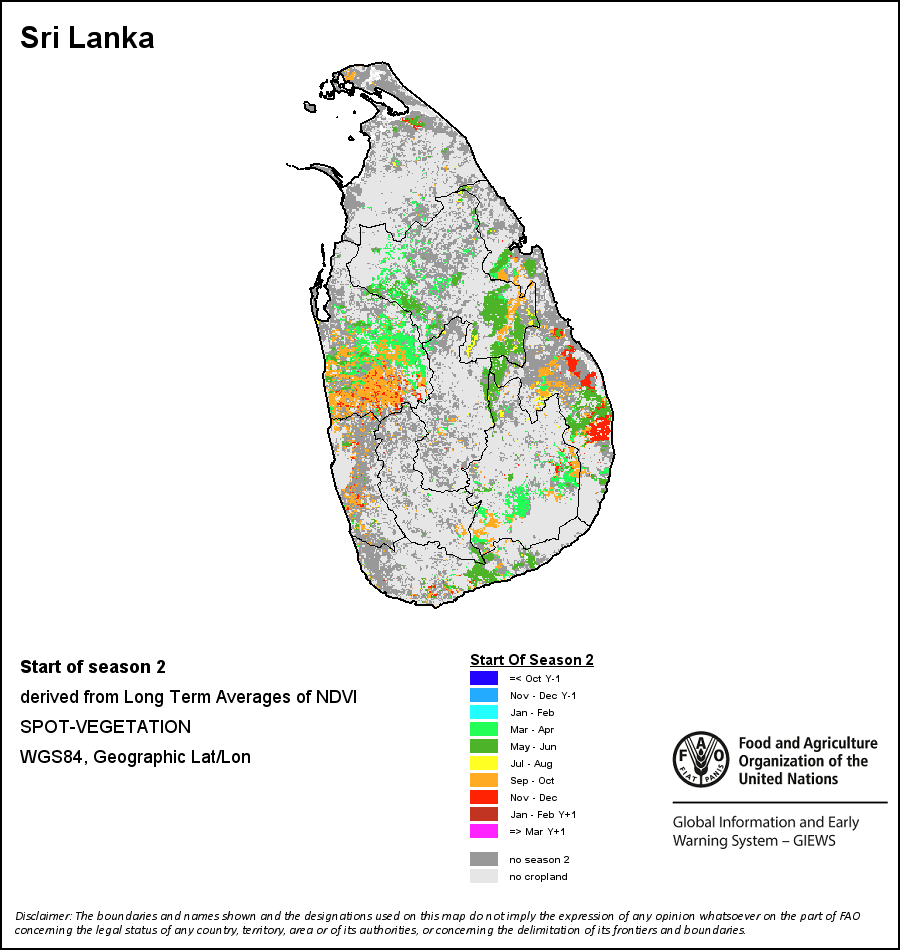
The seasons’ progress is based on the long-term average of vegetation phenology for each pixel. This simplification implies that the crop/pasture phenology is static and therefore the growing seasons progress at a constant rate each year.
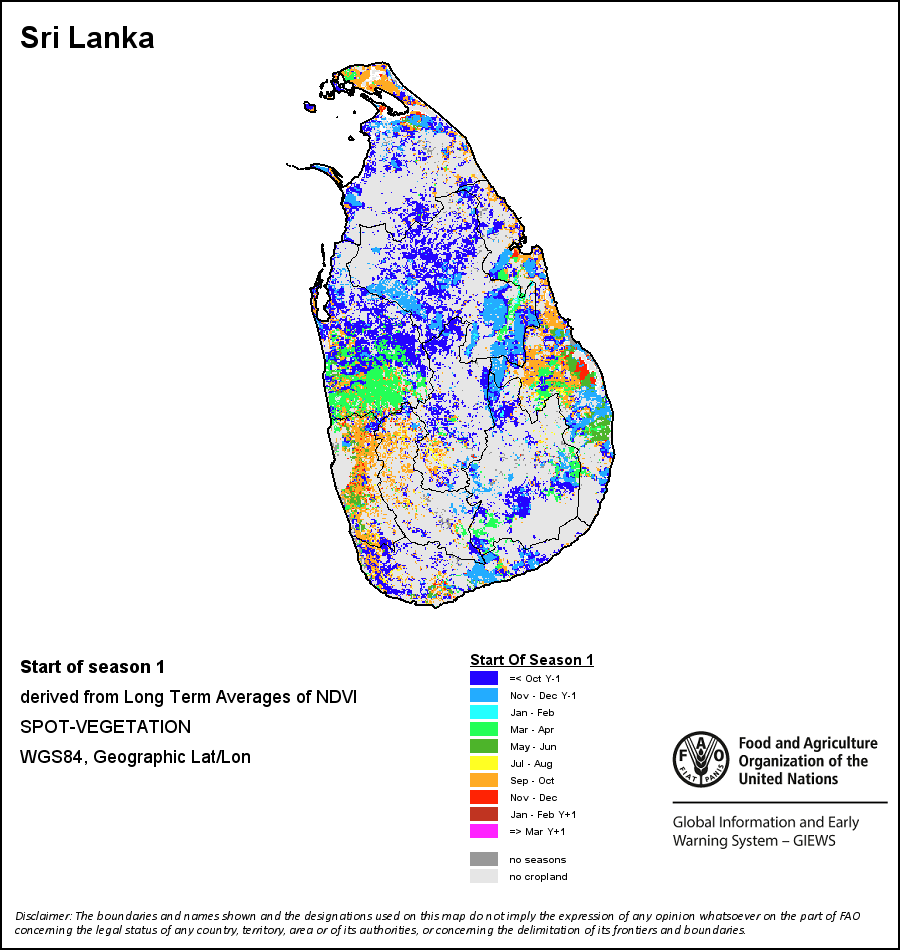
Start of Season (SOS) indicates the early stage of crop/grass emergence, defined as the date when the rising NDVI-curve cuts the threshold NDVIs:
NDVIs=NDVImins + Ts*(NDVImax – NDVImins) NDVImax is the NDVI at the maximum of the cycle, NDVImins is the minimum before this maximum and threshold Ts is fixed to 0.25 for all land cover types. SOS is searched leftwards from NDVImax to NDVImins.
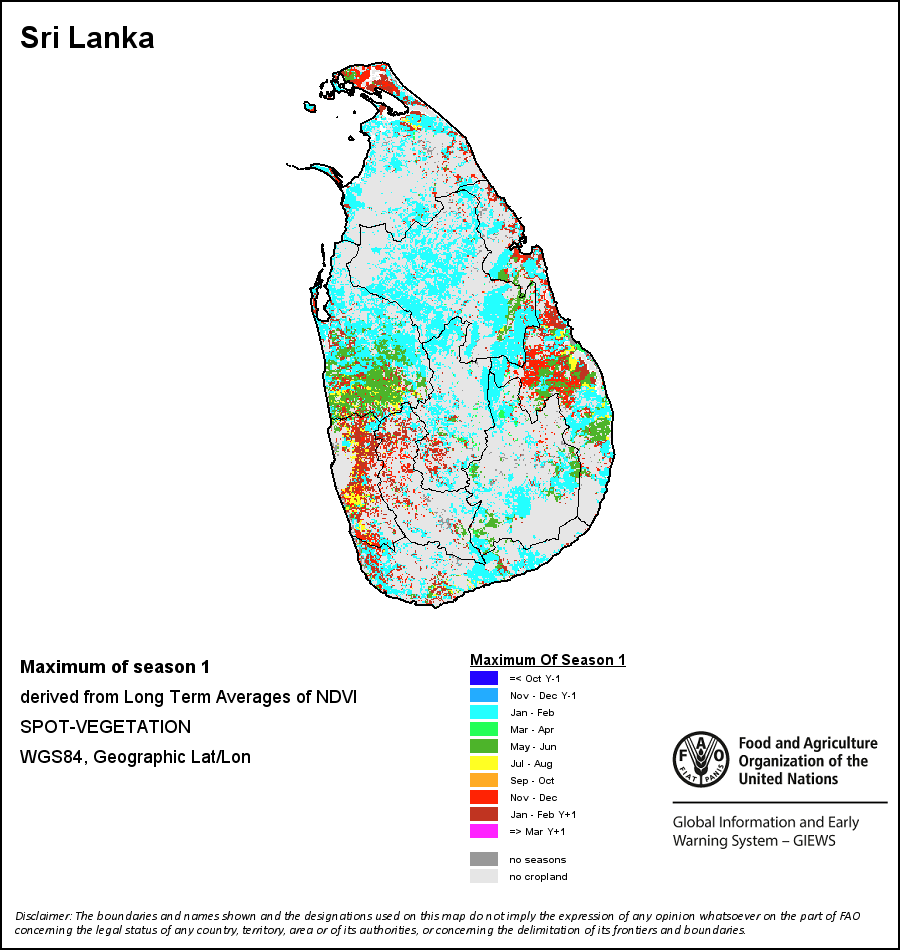
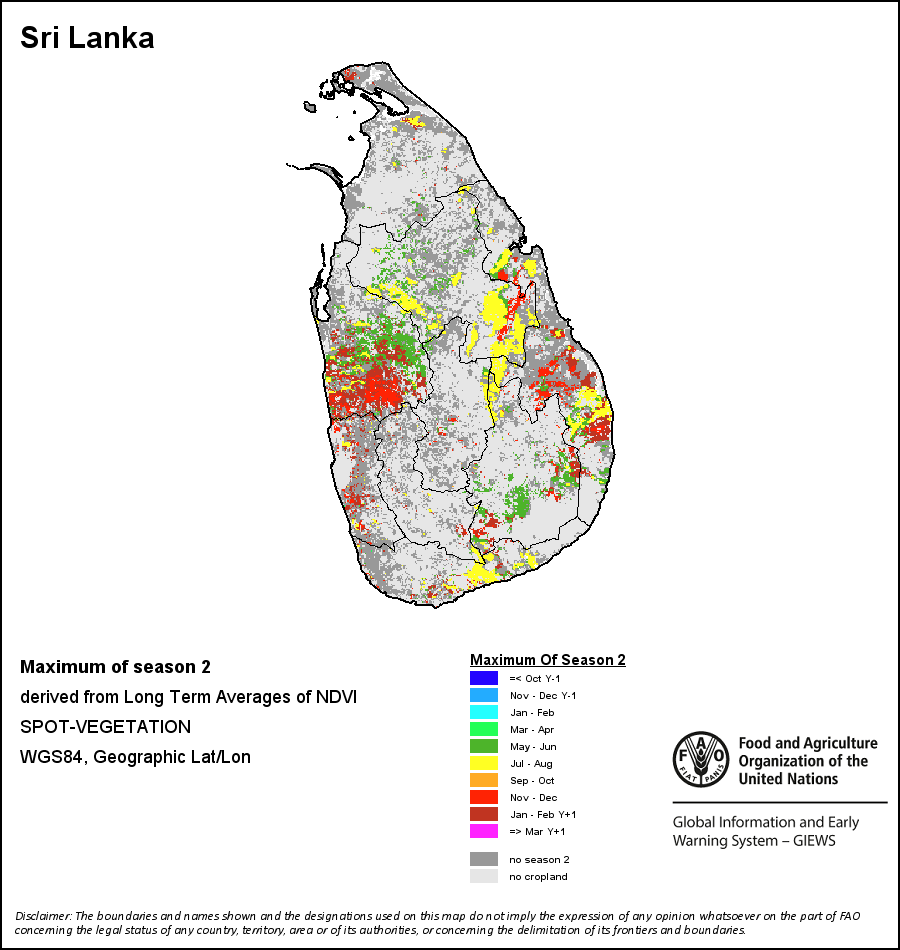
Maximum of Season (MOS) indicates when crop/grass foliage is fully developed, defined as the date when the NDVI is at its maximum value.
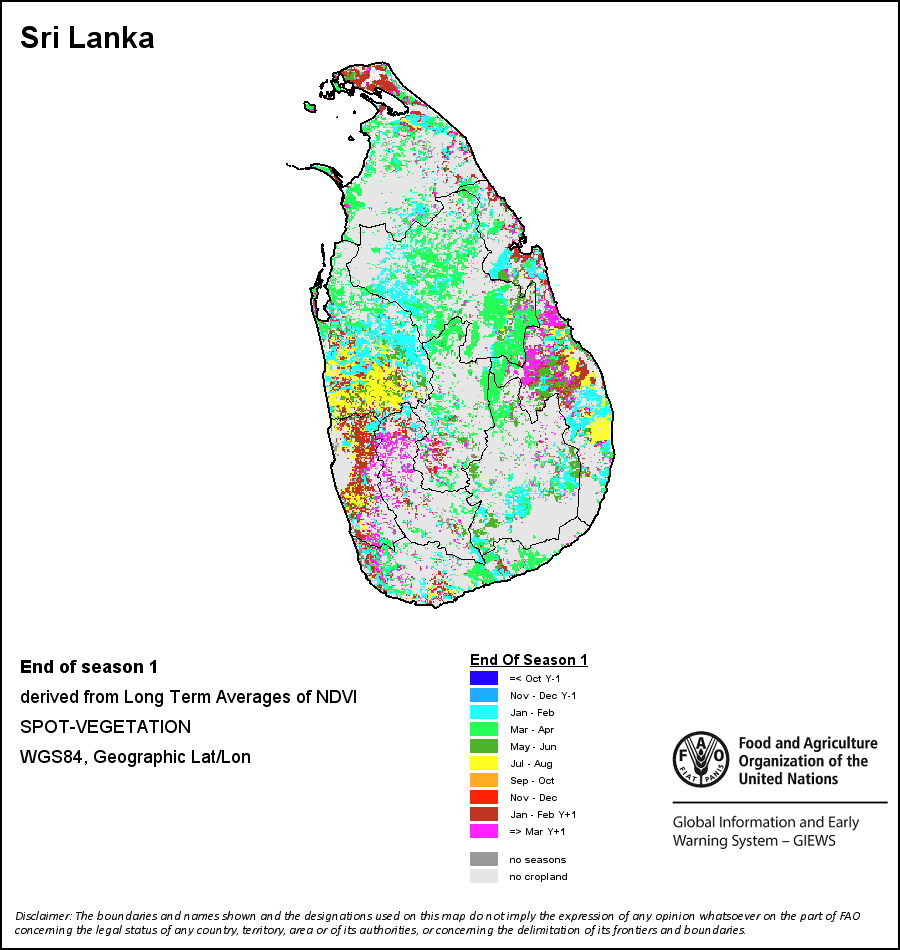
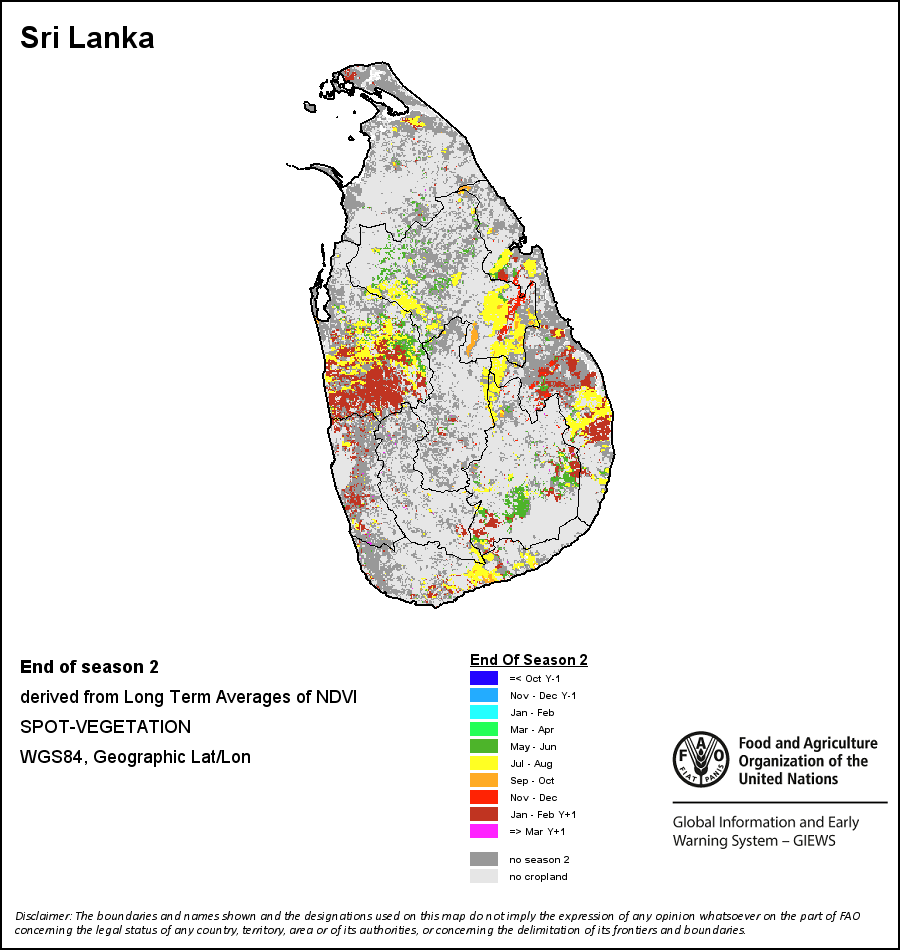
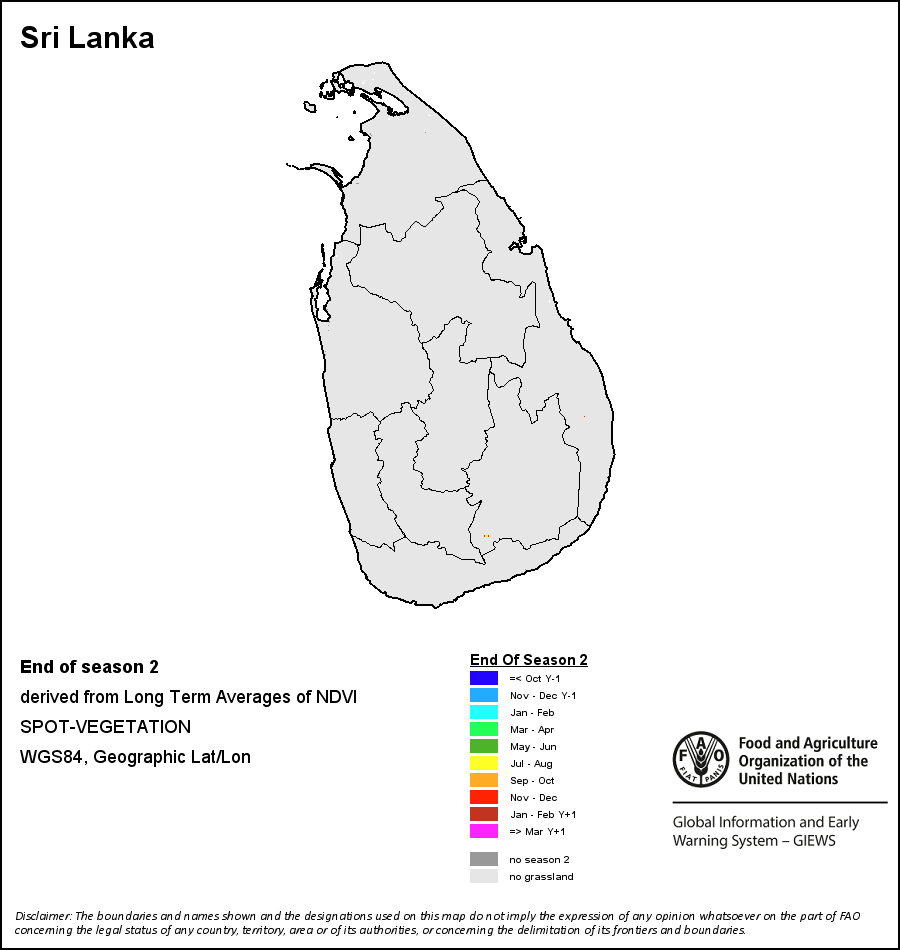
End of Season (EOS) indicates when crop/grass has reached physiological maturity, defined as the date when the descending NDVI-curve crosses NDVIe, This date does not necessarily correspond to the harvest period.
NDVIe=NDVImine + Te*(NDVImax – NDVimine)NDVImax is the NDVI at the maximum of the cycle, NDVImine is the minimum after this maximum and threshold Te is set to 0.75 for cropland and to 0.25 for all other land. EOS is searched rightwards from NDVImax to NDVImine.
The seasons’ progress is based on the long-term average of vegetation phenology for each pixel. This simplification implies that the crop/pasture phenology is static and therefore the growing seasons progress at a constant rate each year.
Start of Season (SOS) indicates the early stage of crop/grass emergence, defined as the date when the rising NDVI-curve cuts the threshold NDVIs:
NDVIs=NDVImins + Ts*(NDVImax – NDVImins) NDVImax is the NDVI at the maximum of the cycle, NDVImins is the minimum before this maximum and threshold Ts is fixed to 0.25 for all land cover types. SOS is searched leftwards from NDVImax to NDVImins.
Maximum of Season (MOS) indicates when crop/grass foliage is fully developed, defined as the date when the NDVI is at its maximum value.
End of Season (EOS) indicates when crop/grass has reached physiological maturity, defined as the date when the descending NDVI-curve crosses NDVIe, This date does not necessarily correspond to the harvest period.
NDVIe=NDVImine + Te*(NDVImax – NDVimine)NDVImax is the NDVI at the maximum of the cycle, NDVImine is the minimum after this maximum and threshold Te is set to 0.75 for cropland and to 0.25 for all other land. EOS is searched rightwards from NDVImax to NDVImine.
|
The seasons’ progress is based on the long-term average of vegetation phenology for each pixel. This simplification implies that the crop/pasture phenology is static and therefore the growing seasons progress at a constant rate each year.
Start of Season (SOS) indicates the early stage of crop/grass emergence, defined as the date when the rising NDVI-curve cuts the threshold NDVIs:
NDVIs=NDVImins + Ts*(NDVImax – NDVImins)
NDVImax is the NDVI at the maximum of the cycle, NDVImins is the minimum before this maximum and threshold Ts is fixed to 0.25 for all land cover types. SOS is searched leftwards from NDVImax to NDVImins.

Maximum of Season (MOS) indicates when crop/grass foliage is fully developed, defined as the date when the NDVI is at its maximum value.

End of Season (EOS) indicates when crop/grass has reached physiological maturity, defined as the date when the descending NDVI-curve crosses NDVIe, This date does not necessarily correspond to the harvest period.
NDVIe=NDVImine + Te*(NDVImax – NDVimine)
NDVImax is the NDVI at the maximum of the cycle, NDVImine is the minimum after this maximum and threshold Te is set to 0.75 for cropland and to 0.25 for all other land. EOS is searched rightwards from NDVImax to NDVImine.

The seasons’ progress is based on the long-term average of vegetation phenology for each pixel. This simplification implies that the crop/pasture phenology is static and therefore the growing seasons progress at a constant rate each year.
Start of Season (SOS) indicates the early stage of crop/grass emergence, defined as the date when the rising NDVI-curve cuts the threshold NDVIs:
NDVIs=NDVImins + Ts*(NDVImax – NDVImins)
NDVImax is the NDVI at the maximum of the cycle, NDVImins is the minimum before this maximum and threshold Ts is fixed to 0.25 for all land cover types. SOS is searched leftwards from NDVImax to NDVImins.

Maximum of Season (MOS) indicates when crop/grass foliage is fully developed, defined as the date when the NDVI is at its maximum value.
End of Season (EOS) indicates when crop/grass has reached physiological maturity, defined as the date when the descending NDVI-curve crosses NDVIe, This date does not necessarily correspond to the harvest period.
NDVIe=NDVImine + Te*(NDVImax – NDVimine)
NDVImax is the NDVI at the maximum of the cycle, NDVImine is the minimum after this maximum and threshold Te is set to 0.75 for cropland and to 0.25 for all other land. EOS is searched rightwards from NDVImax to NDVImine.
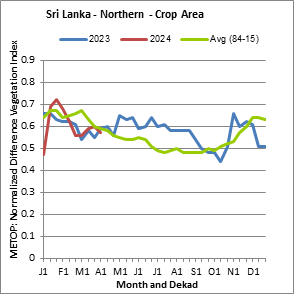
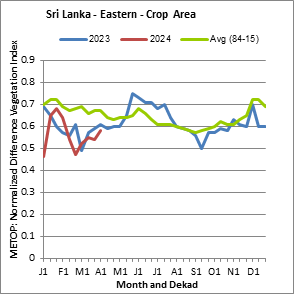
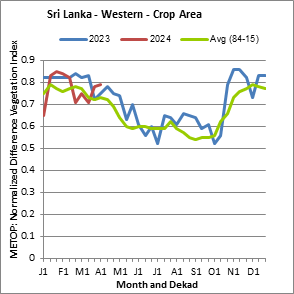
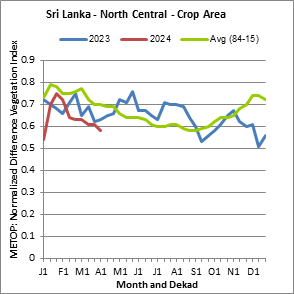
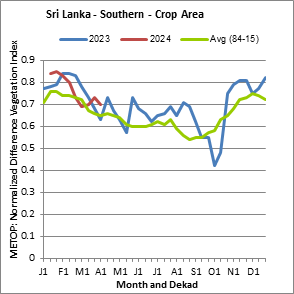
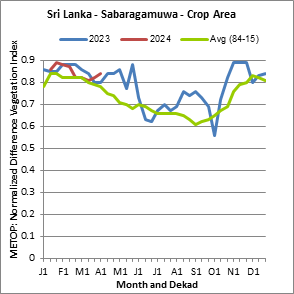
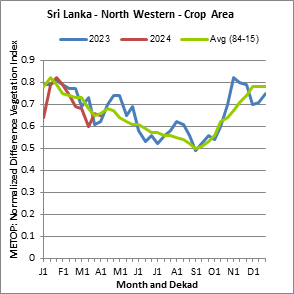
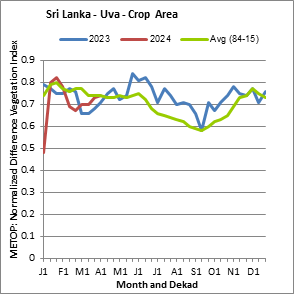
| NDVI profile compared with LTA (1984-2015) and previous year at administrative level 1
|
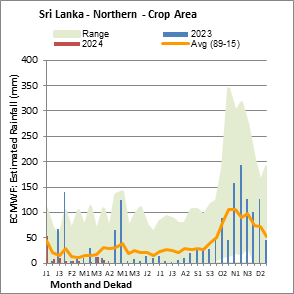
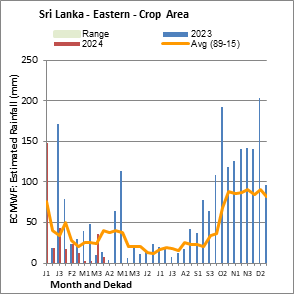
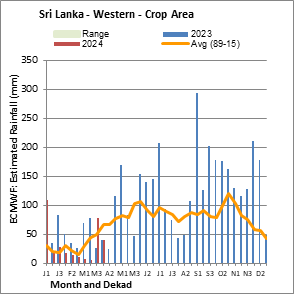
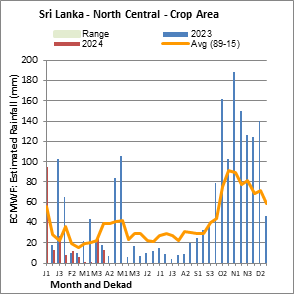
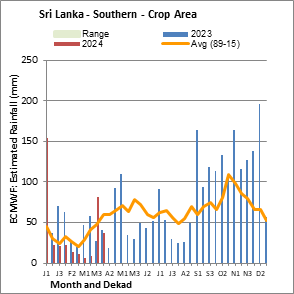
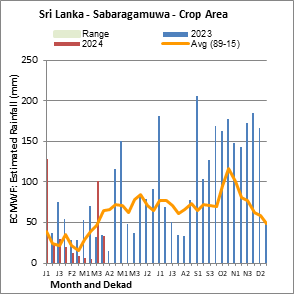
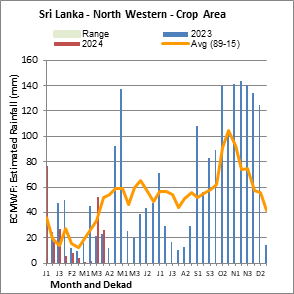
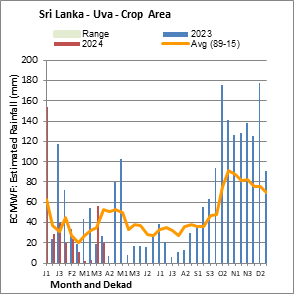
| Estimated Precipitation compared with LTA and previous year at administrative level 1
|
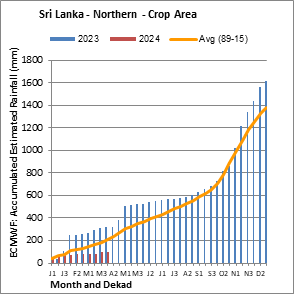
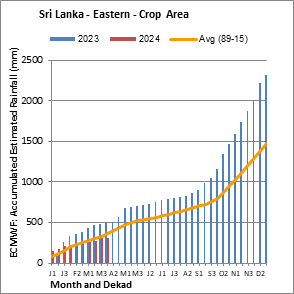
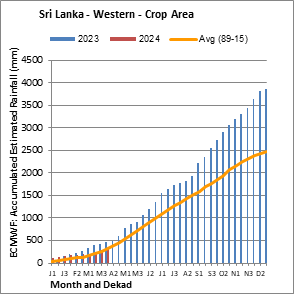
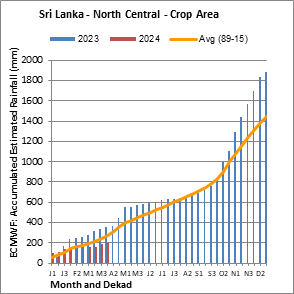
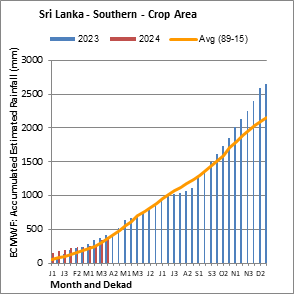
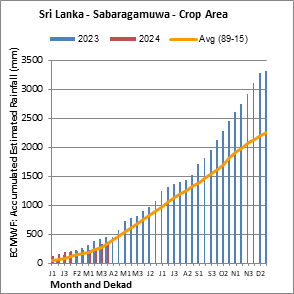
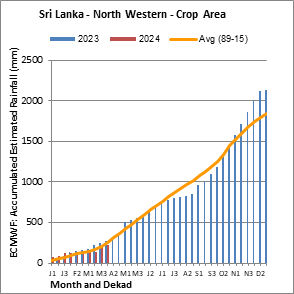
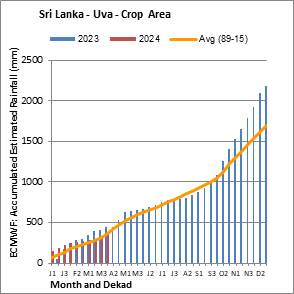
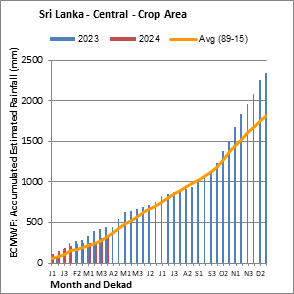
| Accumulated Estimated Precipitation: aggregated at administrative level 1
|
|
 More
More


 on the FAO Hand-in-Hand Geospatial Porta")
 on ArcGIS Online")
 through the Web Map Service (WMS) provided by FAO using your own GIS software") WMS
WMS time series data in CSV format or Visualize the data directly in FAO Hand in Hand Geospatial portal by copying link address.")