
Fish trade in Africa: an update
.jpg)
Despite significant progress, international trade has so far not served as an effective tool for the achievement of rapid and sustainable economic growth and development for many African countries. Promotion of intra-regional trade constitutes an imperative response to challenges facing Africa and will contribute to enhancing the countries’ capacity and getting them ready to compete more effectively on international markets.
World production and overall trends
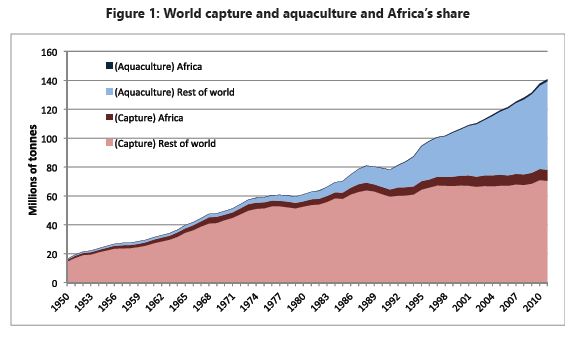
Over the past decade, world capture fisheries production has remained stable at around 90 million tonnes per year. In 2010, Africa contributed 7 597 427 million tonnes, or 9% of global caught supply, representing a regional increase of 6.8 times from 1 109 387 tonnes in 1950. In that year, fish catches and aquaculture totalled some 158 million tonnes valued at US$ 217.5 billion (Figure 1).
In 2011, the African total capture fisheries and aquaculture production dropped slightly to about 8 995 518 tonnes (6% of world total), of which 1 398 091 tonnes came from aquaculture and 7 597 427 tonnes from capture catches. Overall though, Africa’s contribution to world fishery production has grown from 5.9% in 1950 to 8.1% in 2011. This increase has been due to the extension of national EEZs to 200 miles; higher fishing capacity and technological progress; creation of national industrial fleets; high rate of motorisation of artisanal canoes (61% in Africa) and fishing agreements signed between African countries and others, especially the EU.
Global inland production was estimated at 11.2 million tonnes in 2010, of which Africa contributed about 2.5 million tonnes. Uganda and the United Republic of Tanzania are the leading fishing countries in the African Great Lakes region, while Nigeria and Egypt, with their river fisheries, remain the main producers in Africa.
African import and export trade patterns
Global fish trade has been increasing very rapidly in recent decades. An estimated 45% of the world catch is now traded internationally. The widespread use of refrigeration, and improved transportation and communications has facilitated this vast expansion of trade, which is an important engine of economic growth and development.

Africa’s share in global exports continues to be minor, estimated at US$ 4.8 billion in 2011 (Figure 2). Expansion of export volumes was primarily due to the growth in exports of fresh, chilled or frozen fish (which constituted over 50% of the total); and to a lesser extent, prepared and preserved fish and fish meal. These exports generated fairly low per unit values, but helped drive export revenues due to the large volumes exported (Figure 3). While export volumes of crustaceans and molluscs have remained largely stagnant over the past two decades, they contributed significantly to the growth in export values, generating almost 30% in value in 2006-2008 (compared to 13% in volume).
Main export market: Europe
The top ten African exporters accounted for 89.5% of the total value of fish and fishery products exports from the continent. Morocco (leading with 29%), Namibia (15.8%), South Africa (12.3%), Mauritius (7%) and Senegal (6.3%) – are among the top 50 global fish exporters, with Morocco contributing 1.1% to global trade (1.11% of value) and Namibia around 0.6%. Exports grew from 3.5% in 1980 to around 4 % during the early 1990s and then stabilised around 4.6% (Figure 3).

The number one market for the top ten African exporters of fish products is Europe (70%), followed by Asia (15%), Africa (11%), North America (2%). Oceania and South America are estimated respectively at 1% (Figure 4).

In 2010, Africa’s top 10 exporters received between 46% and 92% of their fishery products export revenues from the EU, and Mauritania’s share being the lowest due to the importance of their trade on the Japanese market which accounted for around a third of exports (mainly frozen fish and molluscs).
Dependency on the EU market is highest for Madagascar and Côte d’Ivoire where in 2010, France alone imported 83% (mainly shrimp, prawn and processed tuna) and 61% (mainly processed tuna) of the countries’ fishery products exports respectively. Spain was by far the largest EU importer of products from Morocco as well as Namibia, Côte d’Ivoire, South Africa and Mauritania. Spainish imports were almost entirely made up of crustaceans, molluscs and unprocessed fish, with the exception of the products from Mauritius and to a lesser extent Côte d’Ivoire. Italy is also an important market in the EU, especially for products from Morocco, South Africa and Tunisia.
Imports: high volume, low value
The continent is an important market for fish, accounting for around 11% of global volume of imports. However, in value terms, African imports were low at around 3.48 % of global value in 2010 (Figure 5).

The top ten importers recorded 82.6% of the total value of imports (Figure 6).

Nigeria is the world’s fourth largest importer in volume terms (5.4% of global imports) after China, Japan and the US, but only 23rd in value terms or 0.8%. Similar to exports, import volumes grew by some 5% annually between 1976 and 2008 while import values increased at a faster rate of close to 7% on average per year.
Main species and products
Imports are dominated by fish – essentially fresh, chilled and frozen – which accounted for close to 90% of imports on average, over the last decade. The most commonly imported fish has been fresh, chilled and frozen mackerel (almost 40%) and other unspecified frozen fish.
Fresh, chilled and frozen fish also accounted for the largest share of import values, although prepared and preserved fish tended to attract a high value (14% in 2006-2008) relative to their share in import volume (5%). Imports of dried, salted and smoked fish remained low, even though they are widely consumed in Africa. The demand is likely met through domestic production which is processed and consumed locally, and/or fresh fish which is imported for processing into dried, salted or smoked products.
Products purchased by the top 10 African fish importers are mainly fresh, chilled or frozen fish. South Africa is the notable exception because crustaceans and molluscs account for a quarter of its imports, while prepared and preserved fish constitute about one third. The top 10 importers together, account for 90% of Africa’s import volumes and 80% in value terms. The main market for fish meal is Nigeria (second biggest cultured fish producer).
Imports by African region

The Economic Community of West African States (ECOWAS) is by far the largest fishery products importer by volume (70%), essentially made up of low-value fresh, chilled or frozen fish. The region pays the lowest average price per unit of imports.
SADC and COMESA-EAC imports are relatively high, partly due to demand for high-value products in South Africa. The region had the fastest annual average growth since 1976 at 8% per year, which increased to 10% over the last decade.
Imports to ECCAS and AMU have remained fairly low, though steady, with an annual growth rate of 4% and 5%, respectively, between 1976 and 2008 (2% and 2.6% over the past decade). The two regions show the largest differences between their unit values for exports and imports. North Africa accounts for just over half of Africa’s (small) imports of crustaceans and molluscs. The main source countries for the leading African importers are presented in Table 1.
Nigeria’s top suppliers are US and Chile followed by Europe (18%), and Asia (10%); meanwhile, African suppliers provide 7% (Mauritania, Algeria and Mauritius - 1% and 3%). Ghana and Côte d’Ivoire are largely supplied by African countries, Morocco and Namibia providing about 2/3 of Ghana’s imports. These two countries are followed by Mauritania and Senegal. Mauritania was also the main supplier to Côte d’Ivoire (29%), followed by Morocco, Ghana and Senegal (on average 9% each). In its turn, Egypt obtained about 2/3 of its imports from Asia, in particular Thailand (which supplies almost all of Egypt’s processed products), Vietnam, Japan and China (among others). The Netherlands was the second largest source of imports (14%). African countries supplied only a minor share, with about 5% of Egypt’s imports. Spain was by far the largest source of imports for Mauritius followed by France (35% and 12% respectively). These figures are not surprising given the two countries’ interest in the Mauritian tuna processing industry.
Overall, EU countries accounted for just over half of Mauritius’ imports. The Seychelles was the largest African supplier (7%) while South Africa and Morocco sold the largest shares of processed products to the island state. South Africa obtained the majority of its imports from Thailand (44%, primarily processed sardines and tuna) while India, the second largest import source, exported mainly crustaceans to South Africa. China was also a fairly important trading partner. South Africa sourced only 5% of products from the African continent.
Net exporter in value terms
The value of exports and imports indicate that Africa has been a net exporting continent ever since 1985 (Figure 8). However in terms of volume, imports exceed exports, being composed of low value small pelagic fish (horse mackerel, mackerel and sardinellas).

In terms of values per unit, the top 10 countries that are leading both in exports and imports (Seychelles, Côte d’Ivoire, Mauritius and South Africa) pay less for their imports than they receive for their exports (Figure 9). The gap is smaller for South Africa, due to the comparatively low value of exports added to the relatively large share of higher value imports (notably crustaceans and molluscs).

As a whole, Africa has a trade surplus of around US$ 1.6 billion (Figure 5). But viewed individually, 24 African countries have a trade surplus while 29 countries run a deficit. On average, the surplus tends to be larger than the deficit. While nine African countries run a trade surplus of over US$ 100,000, only three have a deficit of less than US$ 100,000. Morocco has the largest surplus of almost 1.4 billion of which US$ was for 700,000 for Nigeria alone, thus lowering the total trade surplus in the continent.
The trade balance of selected countries is presented in Figure 10. As indicated, Morocco has by far the largest trade surplus, followed by Namibia (US$ 500 million), Senegal (US$ 300 million) and South Africa (US$ 299 million). Seychelles (because of tuna imports), Kenya and Tunisia have individually less than US$ 200 million. Angola, Democratic Republic of Congo, Cameroon, Ghana, Côte d’Ivoire, Egypt and Nigeria are fish and fishery products trade deficit countries. In 2011, Nigeria alone imported around US$ 1 245 394 while the trade deficit was higher than US$750 million.

Promoting intra-regional trade in fisheries
Although the African economy is characterised by a relatively high degree of openness, trade in general and international trade in particular, has so far not served as an effective tool for the achievement of rapid and sustainable economic growth and development for many of the countries of the continent.
Africa has already taken different initiatives to scale up cross- border trade. The African Union’s work focuses on the establishment of a CFTA, while the Comprehensive Africa Agriculture Development Programme (CAADP Compact) based on a 10% investment and 6% growth in the agriculture sector and Regional Economic Communities (REC)’s promotion of regional integration and intra-regional trade, remain top priorities for the continent. Yet, apart from few success stories, intra-regional trade stands only at around 12 percent compared to 60 percent, 40 percent, and are poorly produced and packed and raise concerns about quality and safety. Inadequate infrastructure remains one of the principal obstacles to intra-African trade, in addition to the following factors remaining obstacles for fish trade: inefficient cross- border procedures; Rules of Origin; catch certificates; quality and safety issues; IUU fishing aspects and ecolabelling; and investment and private-sector development. Otherwise, intra-African trade could be a powerful driver of Africa’s growth and economic maturity.
The RECs efforts regarding trade facilitation give rise to great opportunities for boosting intra-Africa trade, but realising this potential, and hence the effort to advance regional integration through intra-Africa trade, will require overcoming a number of challenges. Africa’s policy towards regional integration and intra-Africa trade needs to consider fish trade diversification as one of the central issues, since the lack of export-import similarity is a principal hindrance to intra-Africa trade and regional integration A fundamental challenge is therefore to address supply chain constraints, value addition, value chains to render African fishery products more competitive in regional and international markets; and boosting intra-African trade to create diversification and competitiveness. Also of importance are policies which create an environment for trade facilitation in which there are efficient core services such as finance, telecommunication services, energy and adequate transportation networks.
Thus the following are important to achieve deepened regional integration and intra-regional trade:
- Improving infrastructure in Africa, addressing the missing links, implementing the New Partnership for Africa’s Development (NEPAD), and more recently, the Program Infrastructure Development for Africa (PIDA);
- Linking landlocked countries via several initiatives including the Almaty Program of Action, and those of RECs and corridor management institutions;
- Simplifying and harmonising documentation, rules and procedures, and customs formalities as embodied in RECs’ protocols on trade liberalisation;
- Including national trade policies and facilitation signed at RECs levels; Establishing Free Trade Areas and Customs Unions;
- Removing trade facilitation bottlenecks in particular including dealing decisively with rent-seeking practices and malpractices at border multiple checkpoints, and roadblocks;
- Establishing one-stop border posts (One Stop Border Trade Posts);
- Improving payment systems and promoting currency convertibility (an old story);
- Investing in economic diversification (also an old story); and more recently
- Implementing the Minimum Integration Program (MIP), which is a major continental framework aimed at enhancing coordination, convergence and collaboration among RECs to achieve the ultimate goal of the African Economic Community.
In conclusion, Africa cannot do without trading with the outside world but it can reduce its vulnerability to external shocks by boosting intra-regional trade and furthering market integration. Such a promotion of intra-regional trade constitutes an imperative response to challenges facing Africa and will contribute to enhancing the countries’ capacity and getting them ready to compete more effectively on international markets
Author: Dr. Amadou Tall, Independent Consultant specialising in seafood inspection systems and African seafood trade.