AQUASTAT - FAO's Global Information System on Water and Agriculture
Geo-referenced Database on Dams
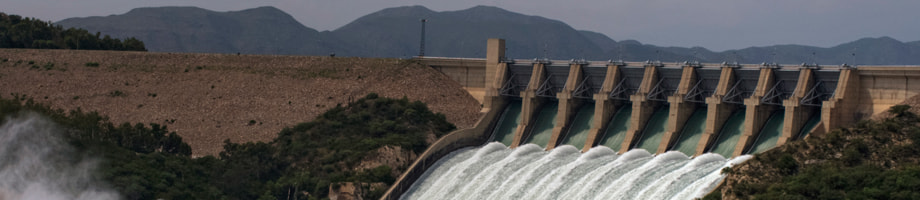
Dams, and their associated reservoirs, provide the ability to store water for later use, provide hydropower and provide some level of protection from extreme precipitation events. If designed correctly, dams allow water to be available at times when in its absence it would not be available, therefore increasing exploitable renewable water resources. This is particularly important for countries in which the available water during the wet and dry seasons varies significantly. Dams may also allow for the excess runoff that would normally flow to the ocean without being used to become available for use. However, dams and reservoirs, especially large ones, also can have negative impacts on human societies, requiring resettlement and leading to social disruption. Dams also change the river network and flow regulation is considered one of the main negative ecological consequences of dams and reservoirs. Also, stored water may evaporate at a greater rate than free-flowing water. In short, dams have pros and cons, such that their design characteristics need to be evaluated carefully.
AQUASTAT gathers detailed information about dams in each country, especially on location, height, reservoir capacity, surface area and main purpose. At present information on over 14.000 dams is available. New data are usually collected during the country update processes. AQUASTAT’s data was an important input into the Global Reservoirs and Dams (GRanD) database, especially for African dams. The database is also used to estimate the evaporation from reservoirs, generating a national-level figure for an often ignored statistics that in some areas can be quite significant. Total dam capacities are introduced into the AQUASTAT core database, and additional details are also provided. All dams are listed in the files below, organized by region.
| REGION | GEO-REFERENCED DAMS | NOTES AND REFERENCES | METADATA | ANALYSIS |
|---|---|---|---|---|
| Africa |  |
 |
 |
|
| Middle East | |
|
|
---- |
| Central Asia | |
|
|
---- |
| Southern and Eastern Asia | |
|
|
---- |
| Europe | |
|
---- | ---- |
| Oceania | |
---- | ---- | ---- |
| Northern America | |
---- | ---- | ---- |
| Central America and Caribbean | |
|
---- | ---- |
| Southern America | |
|
---- | ---- |
Legend:
- Geo-referenced dams databases: The dam databases are provided as Excel files. Each file has two sheets: the first sheet contains the database and the second sheet contains the legend. These databases, in their present format, are neither complete nor can be considered error-free. They correspond to the best available information at the time of the study 1.
- Notes and References: Explanatory document providing specific information about the references used, and brief notes on the more complicated dams contained in the excel spreadsheet.
- Dams in GeoNetwork: GeoNetwork is an opensource depository that allows users to share geographically referenced thematic information between different organizations.
- Analysis: A document in which the importance of dams is reflected upon 1.
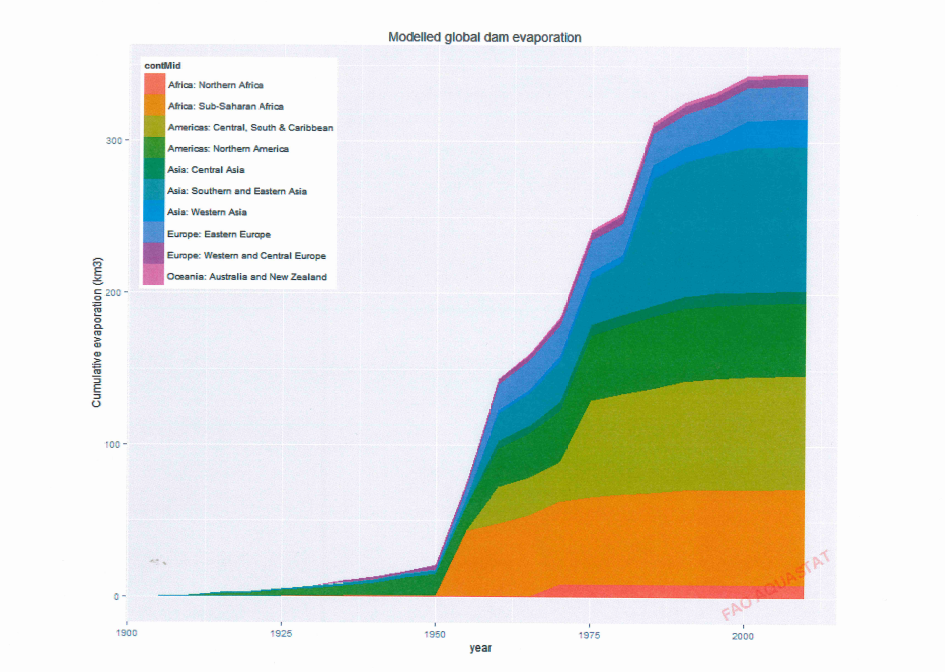
Evaporation from artificial lakes and reservoirs
Dams and their associated reservoirs provide many services, including water storage, flow regulation, navigation, hydropower, in-stream and off-stream uses, flood protection, amongst others. However, these artificial lakes and reservoirs evaporate more water than the natural surface water flow before the dam was built, because dams generally increase the surface area of the body of water. This means that more water is exposed to air and direct sunlight, thus increasing evaporation. This "lost" water is referred to as consumed, because it is removed from the system. In some cases, this water consumption can be quite substantial.
Due to its importance, AQUASTAT has estimated the evaporation for all artificial lakes and reservoirs that are available in the above geo-referenced dams database. This exercise is a very rough estimation, with many limitations, and it thus should be considered as an 'order of magnitude' study only. For more information on the methodology, see the technical note prepared on Evaporation from artificial lakes and reservoirs. As always, AQUASTAT welcomes feedback which would help improving the information provided.
The figure below shows the evaporation by region, resulting from the study.
Click the chart to magnify
Other charts, showing evaporation from artificial lakes and reservoirs together with agricultural, industrial and municipal water withdrawal, are available in the Water uses section.
More information on the different types of water uses can be found in the technical note Disambiguation of water statistics.
-
Due to the complexity involved, published reports and maps are not updated frequently and may not reflect updates.
↩


