AQUASTAT - FAO's Global Information System on Water and Agriculture
Israel
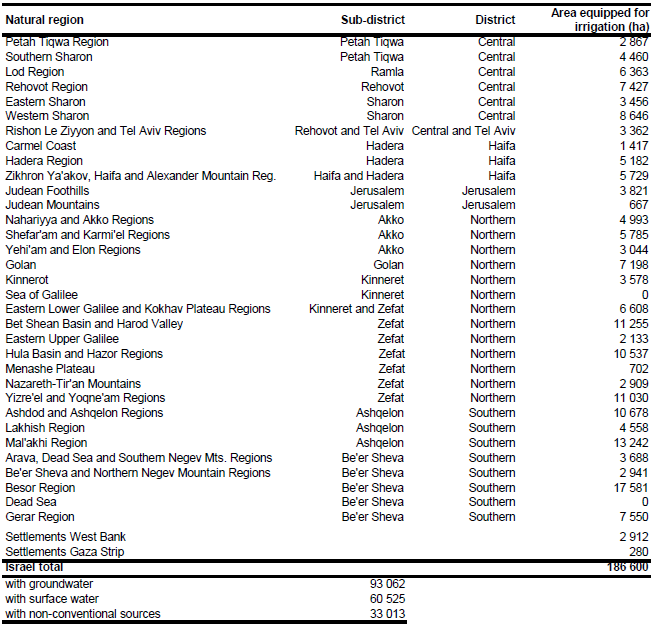
According to the official statistics AEI in year 2004 was 225 000 ha [IL01]. However, the area actually used for irrigation reached its maximum extent in the mid-1980s at about 230 000 ha and declined then to 205 700 ha in 1990 [IL02], 186 600 ha in 2000 [IL02], and 151 400 ha in 2009 [IL03]. This means that a growing part of the irrigation infrastructure has been out of use. Subnational statistics on the extent of AEI were not available. To account for the decline in the extent of irrigated land, AEI per natural region was estimated based on the extent of the major irrigated crops reported for year 2000 [IL02]. As indicated at the national scale [IL02], it was assumed that the flower and garden-plant area was completely irrigated, that citrus plantations were completely irrigated, that 91.88 percent of the vegetable area was irrigated, and that 74.08 percent of the other plantations (except citrus) was irrigated. Total AEI computed this way was 186 600 ha of which an irrigated area of about 3 200 ha is located in enclosed settlements in the West Bank and Gaza territories. The irrigated area per natural region is visible in the table below and also can be downloaded as Israel irrigation areas in PDF or Israel irrigation areas in Excel.
The irrigated areas were digitized from two irrigation maps ([IL04]; [IL05]). The outlines of the digitized areas were then adjusted using satellite imagery [IL06]. Some smaller irrigation schemes visible on the satellite images were also digitized and incorporated.
49 percent of the total water use in Israel is from groundwater, 33 percent from surface water (extraction from the Jordan River) and 13 percent from treated wastewater and 5 percent from desalination plants [IL07]. About two third of the water use is for irrigation. About 90 percent of the fresh water resources have been incorporated into a single system that enables implementation of a uniform national policy of water production and regular supply to the different sectors of consumers [IL08]. This also means that water from different sources is mixed and transported over long distances. Therefore it was assumed that the partitioning of water supply into different water sources also represents the percentages of irrigated area irrigated from the corresponding water sources. Area actually irrigated was 151 400 ha in year 2009 [IL03]. Subnational data on AAI were not available.
References
[IL01]: FAO. 2012. AQUASTAT country profile of Israel, version 2008. FAO, Rome, Italy.
[IL02]: Central Bureau of Statistics. 2003. Statistical abstract of Israel 2002. http://www.cbs.gov.il, 19/09/2004.
[IL03]: Central Bureau of Statistics. 2012. Time series Data Bank, table “Land by Categories”, http://www1.cbs.gov.il/ts/databank/databank\_main\_func\_e.html, 01/12/2012.
[IL04]: Eichenauer, H. 1993. Die Bewässerungsgebiete Israels, Anmerkungen zu einer Karte 1:1 Million. In H. Popp & K. Rother, eds. Die Bewässerungsgebiete im Mittelmeerraum, pp. 135-141. Passau, Germany, Passavia Universitätsverlag.
[IL05]: Universität Tübingen. 1993. Tübinger Atlas des Vorderen Orients (TAVO), plate AX7. Wiesbaden, Germany, Reichert.
[IL06]: Earth Satellite Corporation. 2004. Landsat GeoCover (2000/ETM+) Edition Mosaics, tiles 071-271 and 071-272. Sioux Falls, USA, USGS, http://glcfapp.umiacs.umd.edu:8080.
[IL07]: ARIJ. 2007. Status of the environment in the Occupied Palestinian Territory. Applied Research Institute – Jerusalem (ARIJ), Bethlehem, Palestine, http://www.arij.org/, 19/08/2009.
[IL08]: Sitton, D. 2000. Advanced agriculture as a tool against desertification. Israel Ministry of Foreign Affairs, http://www.mfa.gov.il/mfa/facts%20about%20israel/economy/advanced% 20agriculture%20as%20a%20tool%20against%20desertifica, 19/08/2009.


