
How to use the FLW Database
The database on Food Losses and Waste is a novel endeavour by FAO under Sustainable Development Goal (SDG) 12.3 to share available knowledge and help focus efforts where they can have the most impact in order to meet the SDG target. This is a living dataset, based on an extensive and continuing literature review, so always check back for additions and improvements. We know it will be a collaborative effort to improve the data – so if you see an area where you have data and would like it to be included, please send it to us!
The database is open for users to interact with the data. Want to know where tomatoes are lost? How about in your region? Here you can find all the options for refining your queries to the dataset.
The database is made of two main parts:
A selection pane on the left
The selection pane allows you to refine the search on a number of filters
The data visualisations at the centre of the page where you can choose how to visualise the data of the following options:
Plot of loss percentages: showing all the selected data by year
HeatMap of Available Data: showing where and for what commodities there is information, thus providing an overview of available knowledge
Boxplot by Stage: providing a snapshot of the level and variety of losses by showing the range of losses by stage of the value chain
Data: a table providing all the selected data with the level of losses, the actual percentages and a set of metadata information
Data visualisations
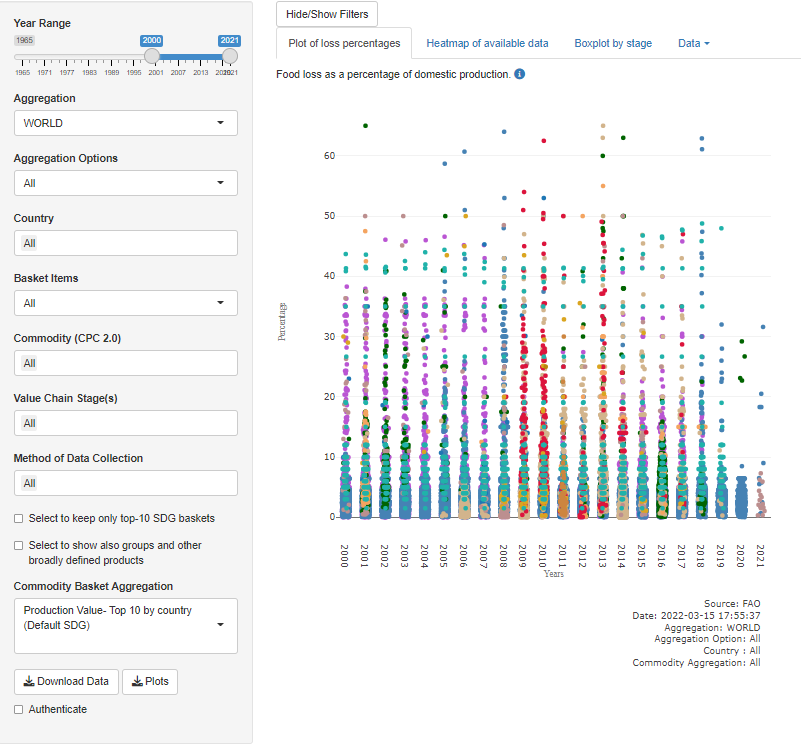
1. Plot of loss percentages
It has all the selected data points according to the filters. When opening the database and before selecting, the graph shows the content of the whole database as displayed above.
Each point represents a specific research/study. Loss percentages are plotted by year. A colour code indicates the different Methods of Data Collection.
When pointing the cursor on a point, a metadata box appears reporting the related year, actual loss percentage, commodity, country, method of data collection, data source, reference and link to the original source.
2. HeatMap of Available Data

It summarises the extent of available data by geographic area (region or country depending on the filters) and items (commodity groups or individual commodities depending on the filters) for the whole food chain.
The color changes with the amount of available information. The graph therefore illustrates data scarcity or abundance.3. Boxplot by Stage
It is a break-down of a data set that can be used to identify the stage at which losses occur the most and therefore target intervention strategies.
In this database, it compares the levels of food loss at the different stages in the value chain. It has a box to show where 50% of the data falls into, the mid-value of the data shown by a line and extreme points out of the box for the percentage loss at every stage in the supply chain. On other words, the data is divided into quarters where the whiskers indicate variability outside the third quarter of the data and the first quarter.
The end of the whiskers represents the minimum and maximum values of the distribution (potential outliers). An outlier is an observation point that is distant from other observations, and thus falls outside of the overall trend that is presented in the data.
In box plots, an outlier is a number, which is greater than the end of the third quarter by more than 1.5 times the distance between the first and third quarter of the data.

Focusing the dataset – Filtering Options
There are several options available to the users in order to refine the information and zoom into the results that are key for the user’s needs. The filters can be used independently of each other in most cases, so that a user could look for losses across all commodities for a geographic aggregation or vice versa – specific commodities or commodity groups across all geographies.

Year Range:
Select the period of interest. This is the year that the study was undertaken. Years range from 1965 to Present.
Aggregation:
Select the broad geographic area of interest. The geographic aggregates follow the M49 geographic standard of the UN Statistics Division. Several alternative geographical aggregates such as countries in which FAO has operational capacity or the 2018 World Bank Income Classifications are also provided.
Aggregation Options:
Select the sub-groups within the Aggregation heading previously filtered.
Country:
Individual Countries can be selected within the sub-groups in the Aggregation Options. The list of countries follows the M49 standard.
For example, under the ‘SDG Region’ (Aggregation), and the ‘Latin America and the Caribbean’ (MDG=M49) (Aggregation Options), only the countries in this region can be selected with the Country filter (Aruba, Anguilla, Argentina, etc.). If the data exists for the selected country(ies), the data points will be filtered and presented in the graphs.
Basket Items
The data can be filtered for six commodity groups. The options in this filter are:
Cereals & Pulses
Fruits & Vegetables
Roots, Tubers & Oil crops
Animal Products
Fish Products (to be added)
Other (stimulants, spices, etc.)
These are the same commodity groups used to compile the SDG indicator 12.3.1 (a) Food Loss Index and that countries will use to select their top ten commodities. The selection in this category restricts the choice of food commodities in the Commodity (CPC 2.1) filter, much like the geographic aggregation.
Commodity (CPC 2.1)
Individual commodities can be selected with this filter within the sub-group Basket Items. The list of items follows the international Central Product Classification version 2.1 (CPC 2.1) used in FAOSTAT. These are the international standard for definitions, concepts and classifications for food and commodities.
Value Chain Stage(s)
In an effort to improve the knowledge on where losses and waste is occurring within the commodity supply chains, the data points were tagged with the stage of the value chain that was delineated in the source study. They follow the main stages considered within the SDG (point of production (farm, slaughter, landing); storage; transport; wholesale; processing); however, for some countries and commodities additional stages or activities have been included as they are critical loss points that were the objective of the study.
Method of Data Collection
The options for this filter summarize the main loss measurement/estimation methods found in the literature or point at the main sources of the data. Knowing the method used in each study helps in understanding its data scope or representativeness.
Options on the methods are:
The Expert Opinion method consists in the advice, belief or judgment given by an expert on the losses.
Case Studies examine food losses of specific value chains, products, persons or groups over a period. Case studies are often limited to a small set of participants, which may or may not be representative of the overall population.
Controlled Experiment is a method of data collection where loss measurement is done in a fully controlled environment either in the field or laboratory. It includes direct measurement of a pre-sampled area of production and follows the local harvesting and post-harvest handling practices on-farm and off-farm. They include crop cutting experiments, field trials and laboratory trials. This is a cost-intensive measurement that can benchmark interview-based surveys.
Modelled estimates refer to estimation of losses via statistical models.
Survey-based estimates apply where a survey and representative sample were designed to collected loss data.
Census data refer to loss data collected in the framework of Agricultural Census. In a census all the units in a population are surveyed in order to describe the agricultural census including to establish loss levels.
FAO’s Annual Agricultural Questionnaires are the tool used by FAO to collect official data from the countries annually. Loss data are collected with production and other utilizations of the commodities and reported in FAOSTAT in the Food balances domain.
Literature Review this is data compiled from review of articles, reports and journals on FLW
FLW Protocol: this is a reporting tool developed by the WRI and other stakeholder where different entities can report on loss and waste using a variety of methods. Entities can range from companies and cities to entire countries.
National Accounts loss data or estimates come from official sources and systems within country and have been used to compile the national accounts but may not have been reported in the annual agricultural production questionnaires.
On/Off Options
Select to keep only top-10 SDG baskets
The focus of the SDG 12.3.1.a is to improve the data in the top 10 commodities selected for the country to track within the 2030 agenda. Clicking on this option will filter the data to the default top ten commodities by country.
However, FAO is collecting data where it is available and countries may report above and beyond the top 10 commodities and studies, so all data in the database is available.
Select to show also groups and other broadly defined products
This option when selected will display the data including all broadly defined groups e.g. cereals, pulses, fruits etc.