FAO Regional Office for Europe and Central Asia
In their pursuit to ensure an equitable and sustainable future, governments can rely on FAO expertise in food and agriculture. Responding to the needs of Europe and Central Asia, the Organization is offering support in many specific areas. Find out more
Highlights


Regional Priority Programmes

Regional Priority Programme
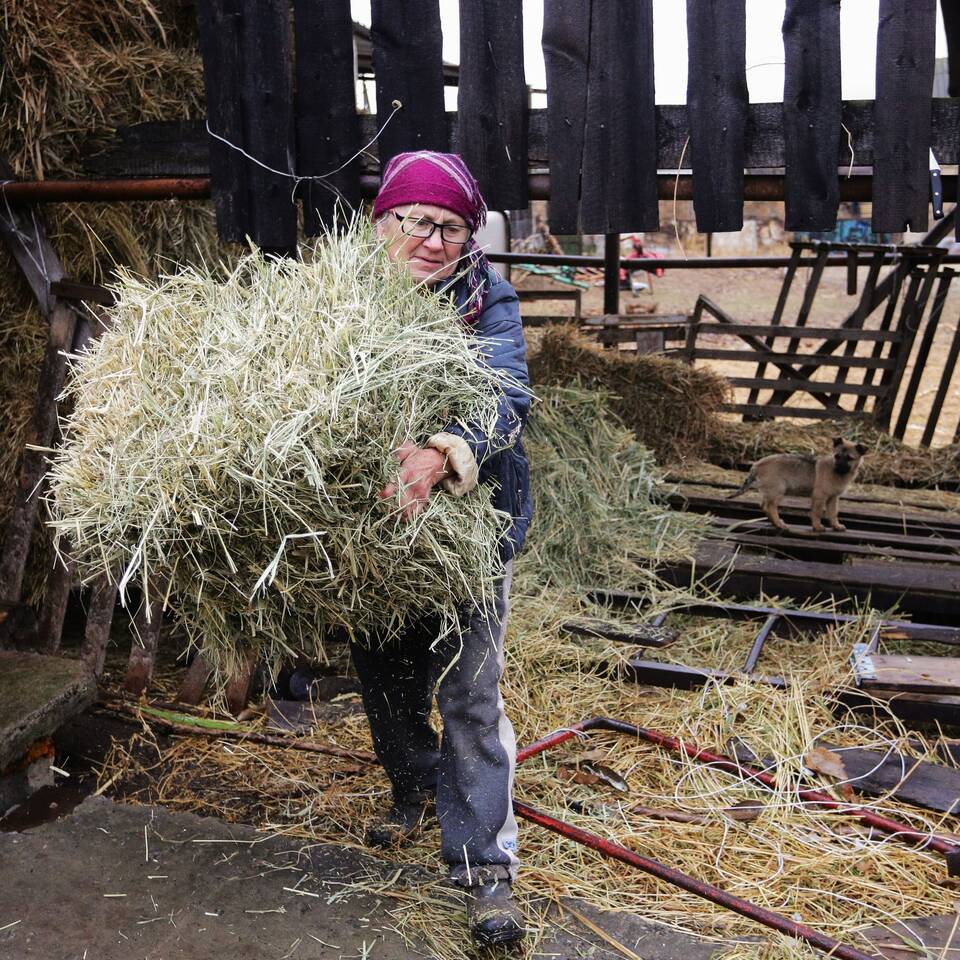
Facilitating inclusive rural transformation for enhanced livelihoods and sustainable development

Regional Priority Programme
Shaping food environments and markets for healthy diets and sustainable agrifood systems

Regional Priority Programme
Advancing natural resources management, environmental protection and climate resilience
Recent and upcoming events
3/6
2026
4/6
2026
From theory to action: EU LEADER approach in non-EU countries
Tartu (Estonia), 03/06/2026 - 04/06/2026
FAO is organizing a technical workshop on 3-4 June 2026 in Tartu, Estonia to build an understanding of the role of the European Union’s (EU) LEADER approach and its application in the context of sustainable transformation of local food systems based on country experiences and challenges.
30/5
2026
6/6
2026
FAO at the Eighth GEF Assembly
Samarkand (Uzbekistan), 30/05/2026 - 06/06/2026
The Eighth Global Environment Facility Assembly will take place from 30 May to 6 June 2026 in Samarkand, Uzbekistan, bringing together representatives from 186 member countries and partners from across government, civil society, Indigenous Peoples, academia, youth, and the private sector to shape the future of global environmental action. As the highest governing body of the Global Environme...
Featured publications

From vulnerability to resilience: Guidelines for assessing climate change impacts in agricultural heritage systems
2026
This publication presents an eight-step guide to assess vulnerability and resilience to climate change impacts in Globally Important Agricultural Heritage Systems and in agricultural systems with similar characteristics. With a particular focus on Europe and Central Asia, the guide supports practitioners in designing and implementing context-specific climate vulnerability assessments that strengthen adaptive capacity and promote dynamic conservation.

Ukraine: Food security and agricultural livelihoods assessment, July 2025
2026
This report analyses the state of food security and agricultural resilience in Ukraine’s war-affected regions in 2025. It examines how ongoing hostilities, economic disruption and damage to agricultural assets are affecting household livelihoods, production capacity and access to food.
In depth


.jpg?sfvrsn=c2b9e520_3)


Multimedia


Contact
20 Kalman Imre utca
H-1054 Budapest
Hungary
Tel: +36 1 4612000
Fax: +36 1 3517029
E-mail:
FAO-RO-Europe@fao.org