The idea of food being lost or wasted sounds simple, but in practice there is no commonly agreed
definition.
Essentially, food loss and waste is the decrease in quantity or quality of food along the food supply
chain.
Food loss occurs along the food supply chain from harvest up to, but not including, the retail
level.
Food waste occurs at the retail and consumption levels.
Although there may be an economic loss, food diverted to other economic uses, like animal feed, is not
considered as food loss or waste, nor are the inedible parts of food products.
in focus
Reducing food loss and waste at scale
This report confirms that food loss and waste is indeed a problem.
The broad estimate FAO provided in 2011 suggested that around 1/3 or 30 percent of the world’s
food
was lost or wasted every year. This can be considered a preliminary estimate that raised
awareness
of the issue.
To provide more clarity on the subject, that figure is in the process of being replaced with two
separate SDG indicators, the Food Loss Index and the Food Waste Index. These two indices will
allow
us to measure more precisely how much food is lost in production or in the supply chain, or is
wasted by consumers or retailers.
The Food Loss Index is calculated by FAO and provides new
estimates for part of the supply chain, from post-harvest up to (but not including) retail.
The Food Waste Index, calculated by UNEP, measures food waste at retail and consumption levels.
Estimates for this index are forthcoming.
These more precise figures will allow us to better measure our progress towards Sustainable
Development Goal 12, which sets out the target of halving per capita global food waste
at retail
and consumer levels by 2030, as well as reducing food losses along production and supply chains.
How much food is being lost from post-harvest up to the retail level?
Initial estimates made by FAO
for the Food Loss Index
tell us that around
0%
of the world’s food is lost
from post-harvest up to (but not including) the retail level.
As we improve our estimates, we will know whether the order of magnitude of the problem is
comparable to earlier estimates of around 1/3 of the world’s food lost or wasted every year.
NOTE: Percentage of food loss refers to the physical quantity lost for different commodities
divided
by the amount produced. An economic weight is used to aggregate percentages at regional or
commodity
group levels, so that higher-value commodities carry more weight in loss estimation than
lower-value
ones.
SOURCE: FAO 2019.
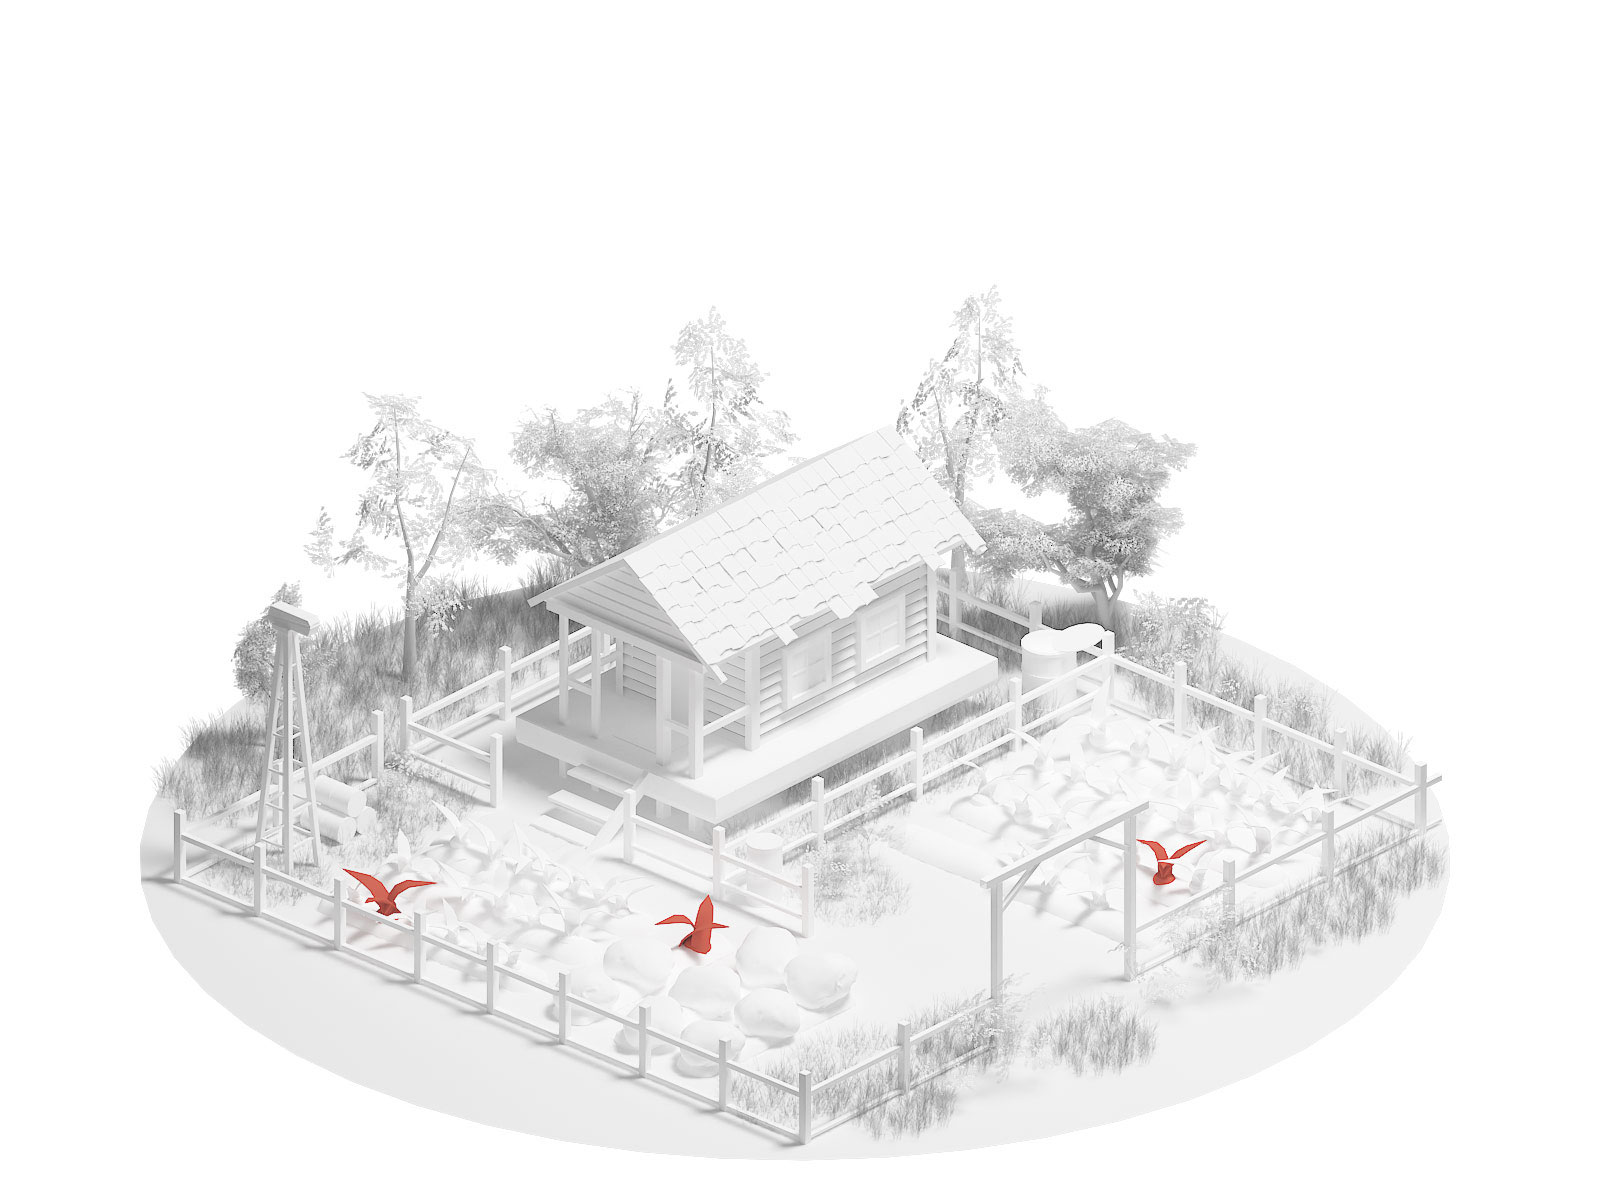
Important causes of on-farm losses include inadequate harvesting time, climatic conditions, practices
applied
at harvest and handling, and challenges in marketing produce.
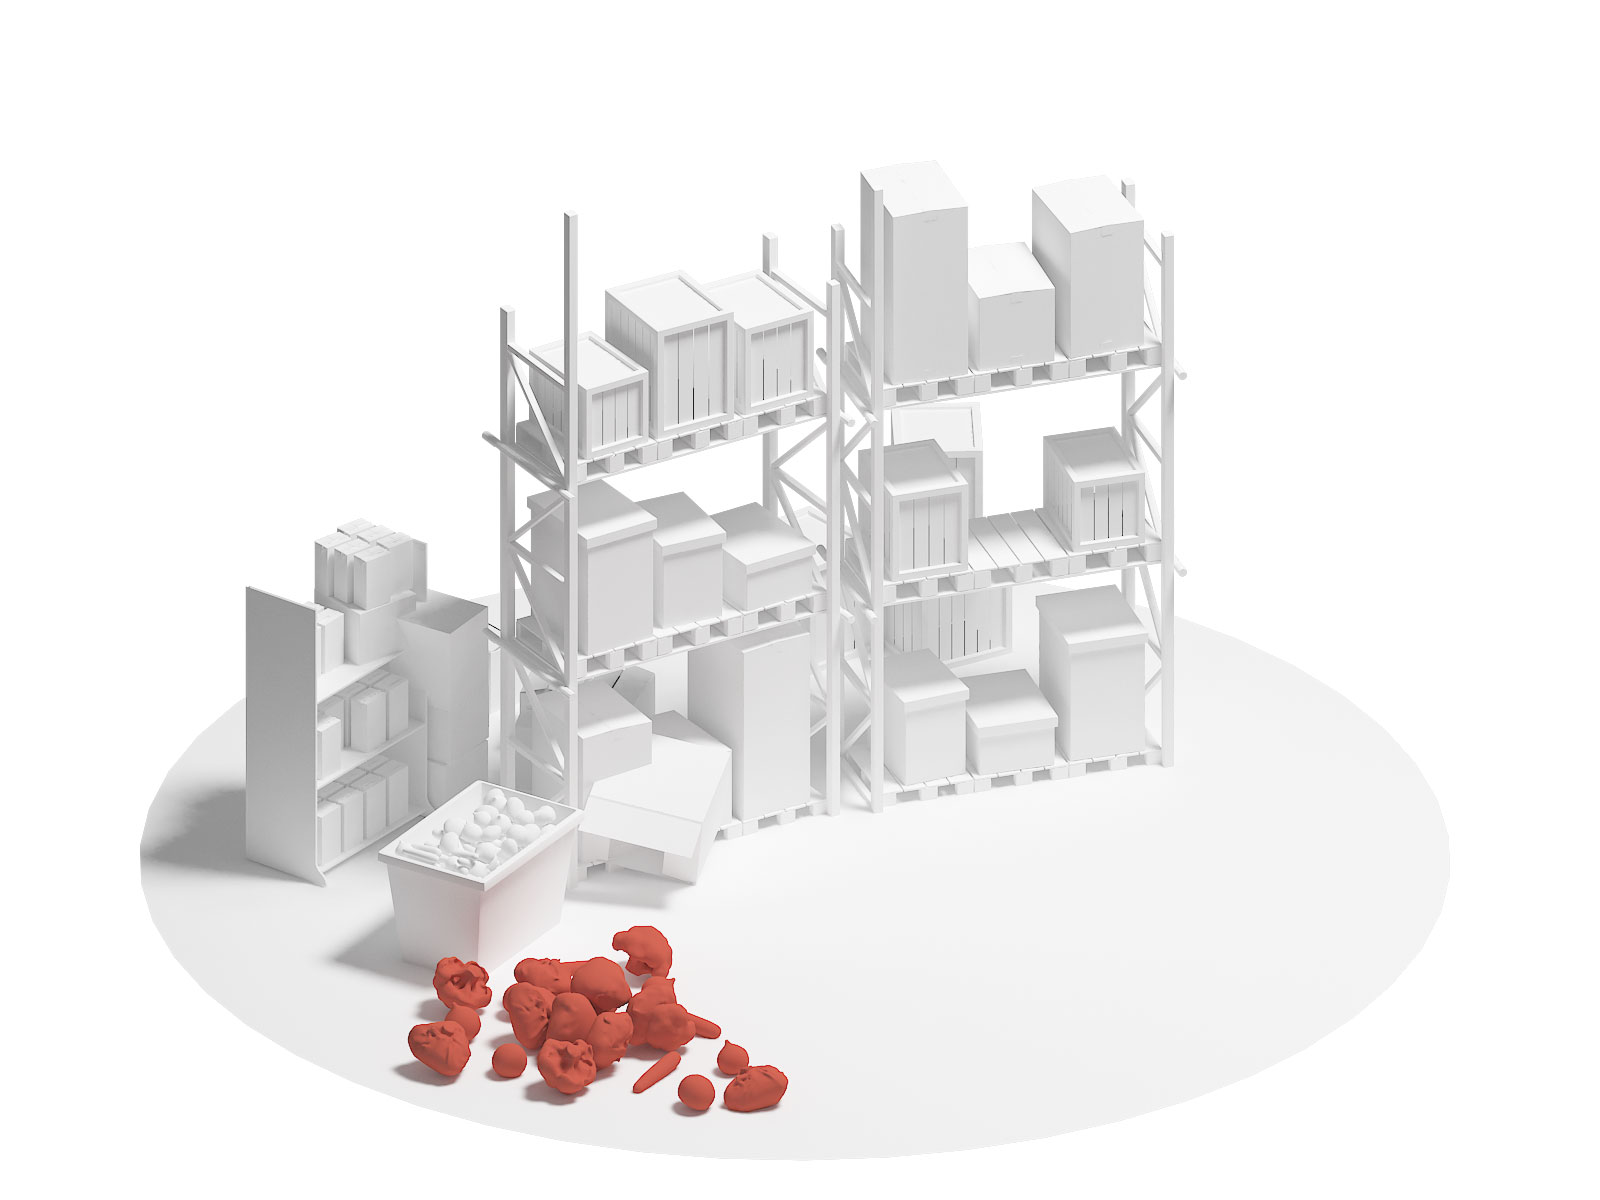
In storage
Significant losses are caused by inadequate storage, as well as decisions made at earlier stages of the
supply chain that cause products to have a shorter shelf life.
In transit
Good infrastructure and efficient trade logistics are key to preventing food loss. Processing and
packaging
play a role in preserving foods, and losses are often caused by inadequate facilities, technical
malfunction
or human error.
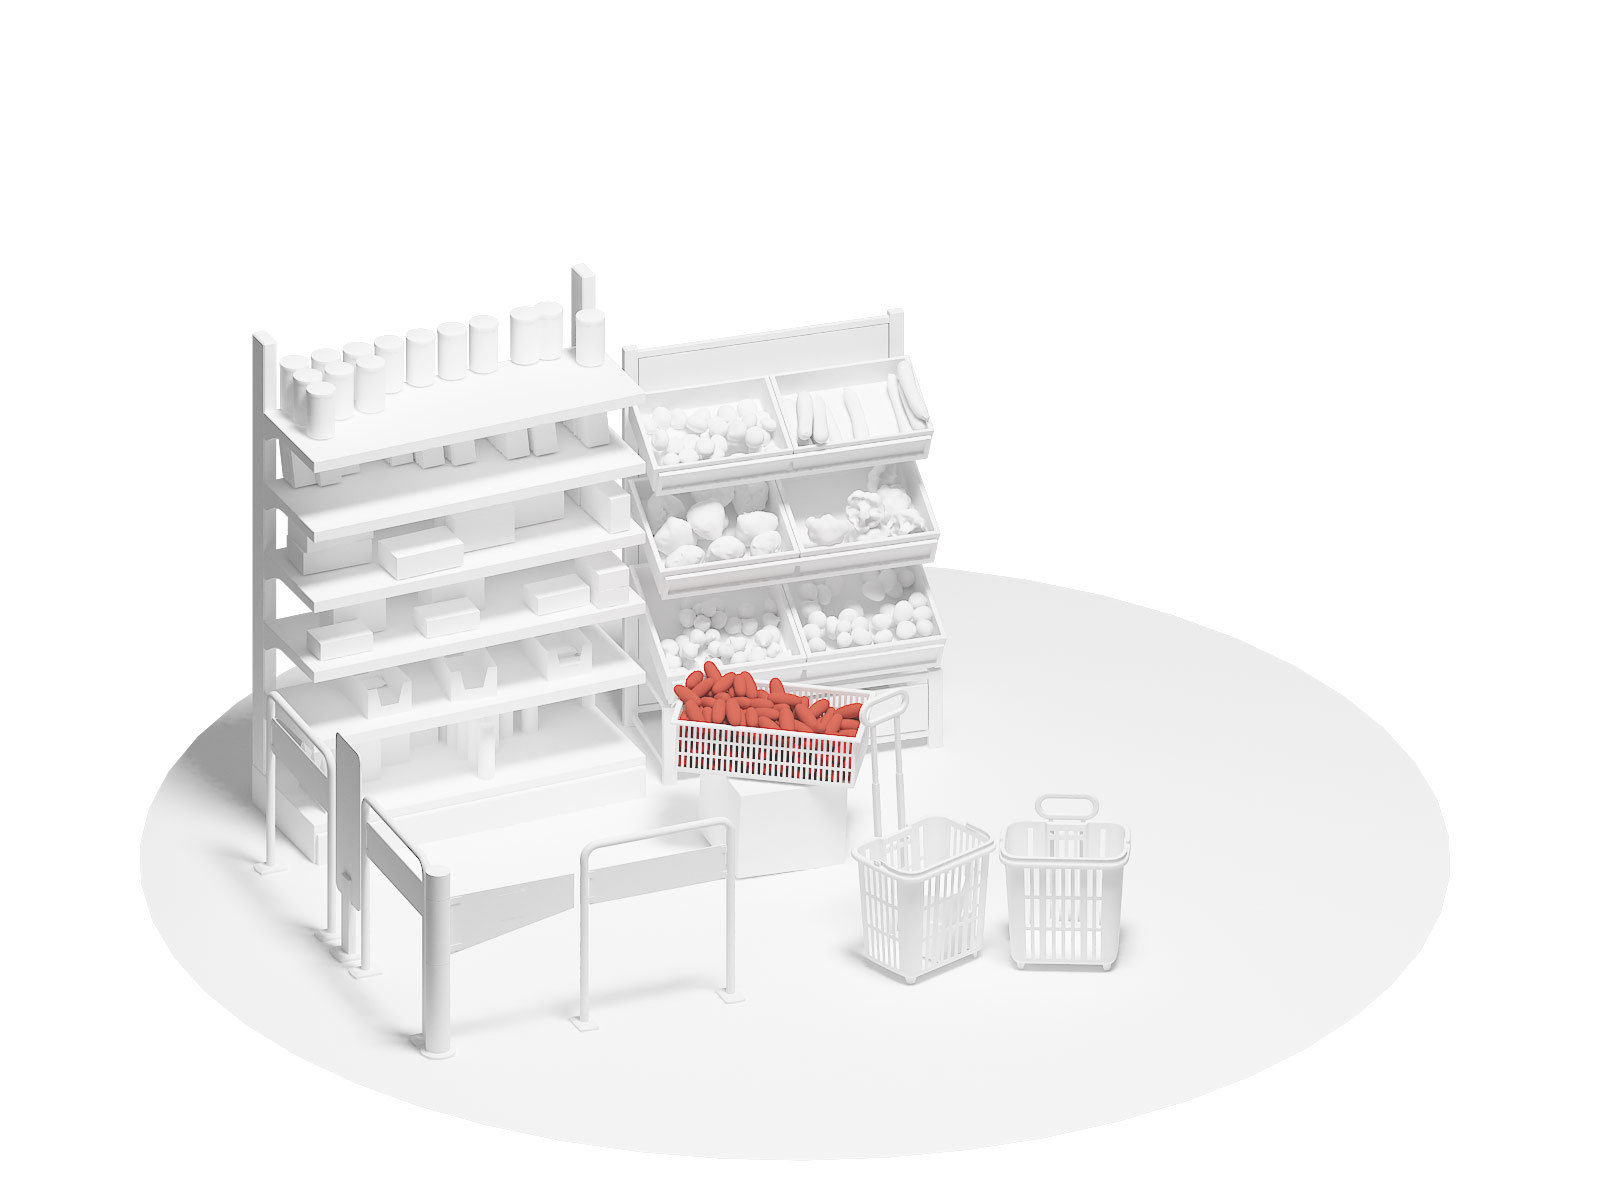
In the shop
The causes of food waste at the retail level are linked to limited shelf life, the need for food products
to
meet aesthetic standards in terms of colour, shape and size, and variability in demand.
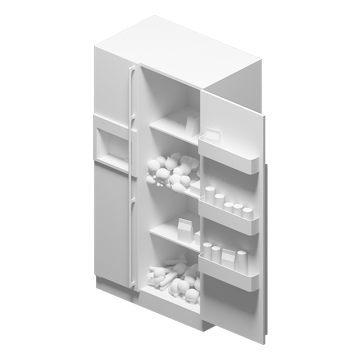
In the home
Consumer waste is often caused by poor purchase and meal planning, excess buying (influenced by
over-large
portioning and package sizes), confusion over labels (best before and use by) and poor in-home storing.
Food loss and waste along the supply chain - A meta-analysis
If we want to reduce food loss and waste, then we need to know where it occurs and where interventions
will
be the most impactful.
To gain further insight into the location and extent of food loss and waste across stages in the food
supply
chain, as well as between regions and commodity groups, FAO conducted the below meta-analysis of
existing
food loss and waste studies all over the world.
Range of reported food loss and waste percentages by supply chain stage, 2000–2017
Cereals and pulses
Fruits and vegetables
Central and Southern Asia
Eastern and South-eastern Asia
Sub-Saharan Africa
NOTE: The number of observations is shown in brackets. The dates, 2000–2017, refer to the dates
the
measurements were taken; however the publication date was used if the study dates were
unavailable
or unclear. For a more detailed explanation on how to interpret the diagrams, see Box 7.
SOURCE: FAO 2019 2
Actions and consequences: food loss and waste reduction beyond SDG12
Impact on global food security and nutrition
Measures designed to combat the problem of food loss and waste can have varying effects on food security
and
nutrition. What the impacts are, and who is affected, depends on where in the food supply chain the
reduction in losses or waste takes place and where nutritionally vulnerable and food-insecure people are
located.
Potential effects of reduction initiatives include changes in food availability, access, utilization and
stability.
Importantly, not everybody stands to gain as these scenarios
show:
Scenario one
At the farm
By reducing on farm losses, farmers can improve their diets due to increased food
availability and gain
higher incomes if selling part of their produce.
It can lead to increased supply and lower prices further along the food supply
chain
and eventually for
consumers.
Scenario two
At the processing stage
If a processor reduces losses this will lead to increased supply and lower prices
further down the food
supply chain and eventually for consumers.
However, it may also result in farmers seeing a reduced demand for their produce,
thus lowering income and
worsening food security.
Scenario three
At the consumption stage
Reducing consumers’ food waste may improve their food availability and access, in
addition to that of
possible direct beneficiaries of food redistribution schemes.
However, farmers and other supply chain actors may be worse off as they are
selling
less and/or at lower
prices.
Potential price and income effects of food loss and waste reductions at various points in the
food
supply chain
AGRICULTURAL PRODUCTION AND HARVEST, SLAUGHTER OR CATCH
POST-HARVEST, SLAUGHTER OR CATCH OPERATIONS
PROCESSING
WHOLESALE AND RETAIL
CONSUMPTION: HOUSEHOLDS AND FOOD SERVICES
AGRICULTURAL PRODUCTION AND HARVEST, SLAUGHTER OR CATCH
POST-HARVEST, SLAUGHTER OR CATCH OPERATIONS
PROCESSING
WHOLESALE AND RETAIL
CONSUMPTION: HOUSEHOLDS AND FOOD SERVICES
Point of loss or waste reduction
Lower prices, more disposable income for food and other goods
Demand shrinks and production falls, income is affected
SOURCE: FAO 2019
Impact on a geographical level
Any initiative designed to significantly reduce food loss or waste will affect prices all along the
supply
chain. These changing prices are known as price transmission. The exact impact of a food loss and waste
reduction will depend on how closely markets are integrated and how effectively price changes are
transmitted.
A key factor is distance or proximity to the location of the reduction.
For example, reducing losses on small farms in lower-income countries may have a strong local food
security
impact, as surplus food will be available in the local area. But reducing food waste from consumers in
high-income countries does not mean that the surplus food is then available for poor and food-insecure
people in a distant country, meaning their level of food insecurity remains the same.
The level of food insecurity a country faces can be relevant for determining their food loss and waste
reduction strategies.
FOOD SECURITY LEVEL
Higher income countries
In higher-income countries, the problem of access is relevant for a much smaller
share of
the
population; for many, the priority is nutrition and quality of diet.
More targeted interventions, like food redistribution, can contribute to access to
food;
however,
eliminating remaining levels of food insecurity will also have to rely on a broader
set
of social
policies.
FOOD SECURITY LEVEL
Lower income countries
In lower-income countries food insecurity is often severe. Increasing access to food
is
critical and
access itself is likely to be closely associated with availability.
Preventing food losses at the local level in smallholder production would have the
biggest impact,
alleviating food shortages, increasing farmers’ incomes, and improving access.
If reductions in losses are large enough to affect prices beyond the local area, the
urban food
insecure could also benefit.
Food loss and waste entails poor use of resources and negative environmental impacts. It is forecast that
a
growing population and rising incomes will lead to increased demand for agricultural products, putting
more
pressure on natural resources.
This is why reducing food loss and waste is crucial. Not only will it improve our use of natural
resources,
but it will directly contribute to lower GHG emissions per unit of food consumed. This is because more
food
reaches the consumer for a given level of resources used.
However, it is worth remembering that improved efficiency does not necessarily reduce the total resources
used or GHGs emitted. The environmental impact will ultimately be the result of price changes associated
with the reduction of food loss and waste, which will indirectly determine its effect on natural
resource
use and GHG emissions.
When designing interventions, clarity in the environmental
objectives
is key
An environmentally oriented policymaker should first consider which environmental objective to target
(carbon, land or water footprints) and define which commodities to focus on.
If you were a policymaker, which environmental objective would
you
like to target? Choose below and see where best to focus your efforts.
Scenario one
Land
60%
If the aim is to reduce land use, the focus should be on meat and animal products,
which account for
60 percent of the land footprint associated with food loss and waste.
Scenario two
Water
70%
If the aim is to target water scarcity, cereals and pulses make the largest
contribution (more than
70 percent), followed by fruits and vegetables.
Scenario three
Carbon
60%
In terms of GHG emissions associated with food loss and waste, the biggest
contribution is from
cereals and pulses (more than 60 percent), followed by roots, tubers and oil-bearing
crops.
Relative contributions of the main food groups to overall food loss and waste and their
carbon,
blue-water and land footprints
Cereals and pulses
Fruits and vegetables
Roots, tubers and oil-bearing crops
Meat and animal products
Note: The environmental footprints are calculated by multiplying the amount of food lost and
wasted
by its environmental impact factors. The carbon, blue-water and land impact factors were taken
from
FAO (2013), which provides environmental impact factors for different products, regions and
supply
chain stages. For a breakdown of the impact factors by region and food group, see Tables A7–A9
in
the Statistical Annex. The carbon impact factor expresses tonnes of CO2 equivalent emitted, the
land
impact factor indicates hectares of land used, and the blue-water impact factor indicates cubic
metres of water used, all per tonne of food lost or wasted. The stacked bars present the
relative
contribution of a food group to total food loss and waste and to each of the environmental
footprints of food loss or waste. The estimations of food loss and waste differ from the ones
presented in Figure 4 with respect to the inclusion of the retail level, the share of food loss
and
waste being measured in terms of quantity (rather than economic value), and the use of loss and
waste data for only those commodities for which an impact factor was available. Thus, food
products
that do not belong to any of the groups included in the figure (e.g. coffee beans) are excluded
from
the graph due to the lack of data for impact factors, despite contributing around 20 percent to
food
loss and waste. These data refer to 2015.
SOURCE: FAO, 2013 and 2019
How to interpret Figure 13
This figure provides estimates of the relative contribution of the main food groups
to
global food loss and waste in terms of quantities (first bar on the left), as well
as to
the associated carbon, blue-water and land footprints.
The blue-water footprint considers the primary production stage and not water used
during
processing. The estimates include loss and waste from post-harvest up to the retail
level, excluding consumption. Preharvest and harvest losses are also excluded.
Since the figure is based on worldwide averages, country-specific data for particular
supply chains may differ. Despite this, Figure 13 presents an indication of the food
products which should be targeted if food loss and waste reduction is to contribute
to
environmental sustainability.
The effectiveness of reducing food loss and waste in generating
desirable environmental outcomes depends on how it affects prices
An intervention to reduce food loss or waste, if sufficiently large, will affect prices upstream and
downstream in the supply chain relative to where the intervention occurs.
These changing prices, and the stage at which the initiative takes place, will determine the overall
environmental impact.
Because of these price effects, to reach environmental objectives, food loss and waste reductions need to
take place downstream in the supply chain relative to where the environmental impact occurs.
Land use and water:
Since the environmental impact on land and water occurs mostly in primary production, no matter which
area of
the supply chain the initiative targets there will always be a positive impact. This is because they are
right at the beginning of the chain, and subsequent lower prices will encourage producers to decrease
production and consequently their use of natural resources.
Carbon reductions:
If the aim of the initiative is to reduce the carbon footprint, interventions at the consumption stage
will
have the biggest effect. This is because the emission of greenhouse gases increases throughout the
supply
chain.
As a rule of thumb, interventions have the biggest impact if they target critical loss points that come
immediately after environmental damage.
A. Carbon impact factor (tonne CO2 eq./tonne maize)
Europe
Western Africa
South-eastern Asia
South America
B. Land use impact factor (ha/tonne maize)
Europe
Western Africa
South-eastern Asia
South America
C. Blue-water impact factor (m3/tonne maize)
Europe
Western Africa
South-eastern Asia
South America
Note: Regions were selected based on the availability of region-specific data for impact
factors.
On-farm operations include pre-harvest, harvest and post-harvest operations.
SOURCE: FAO, 2013
What is blue-water?
In agricultural terms, blue water is defined as ground and surface water. This is
to
differentiate it from green water (rain) and grey water (water used to dilute
pollutant concentrations to acceptable levels).
How to make change happen
This report is based on an incremental approach that supports the business case for private investments
and
efforts to reduce food loss and waste through private incentives. It expands the rationale to one for
public
interventions to reduce some of the barriers that prevent producers and consumers from reducing food
loss
and waste, provide public goods or reduce negative externalities.
With this, it is possible to provide some guiding principles for policymakers to intervene.
A focus on food security will tend to favour interventions early in the food supply chain, where
positive food security impacts will be felt throughout the rest of the supply chain.
For environmental sustainability, it is better to intervene at critical loss points that occur
downstream of where most of the environmental damage takes place on a given supply chain. Actions
later
in the supply chain have the effect of reducing demand for the output coming from the
environmentally
damaging part of the chain, for environmental damage associated with:
Excessive water use at the farm level, any reduction
of losses or waste after the farm level (transportation, processing, storage etc.) can have
a
positive
effect on water demand.
GHG emissions from transport and storage, then
interventions at wholesale, retail, and consumer level have a positive effect.
Location matters when pursuing food security and nutrition or environmental objectives, the only
exception being a fall in GHG emissions, which has the same impact on climate change wherever it
occurs.
Objectives of loss and waste reduction measures and their entry points along the food supply
chain
UPSTREAM
DOWNSTREAM
Increase water quality and reduce water scarcity
GHG emission reduction
Preserving land
Plastics reduction
Farmer income generation
Increased quality and nutritional food content
Food redistribution
Post-harvest loss reduction for increased food availability
Reduced prices for consumers
Environmental sustainability objectives
Food security and nutrition objectives
SOURCE: FAO 2019
Different countries will have different objectives to guide their choices.
Low-income countries will likely focus on improving food security and nutrition, in addition to the
sustainable management of land and water resources. This calls for a focus on reducing food loss and
waste
early in the supply chain, including at farm level, where losses tend to be the largest and impacts will
be
strongest.
High-income countries with low levels of food insecurity will likely place the emphasis on environmental
objectives, in particular reducing GHG emissions. This will call for interventions later in the supply
chain, in particular retail and consumption, where levels of loss or waste are expected to be the
highest.
There may be trade-offs between objectives, and choices may have to be made about which objectives to
prioritize. A critical issue is that of policy coherence, which requires that all options are weighed
together for their impact so that solutions which promote one objective do not unintentionally harm
another.
From school nutrition to soil biodiversity and beyond, FAO’s interactive stories give you an engaging,
close-up look at important issues affecting food and agriculture around the world.