The main indicator for monitoring progress on the eradication of hunger in the world reported here is the
prevalence of undernourishment, or PoU (SDG Indicator 2.1.1).
Beginning in 2017, the prevalence of severe
food insecurity based on the Food Insecurity Experience Scale (FIES) was also included in the report as
another, complementary indicator of hunger using a different approach.
This year’s report now takes a step forward by also including, for the first time, estimates of the
prevalence of moderate or severe food insecurity based on the FIES (SDG Indicator 2.1.2).
This indicator
provides a perspective on global food insecurity relevant for all countries of the world: one that looks
beyond hunger towards the goal of ensuring access to nutritious and sufficient food for all. As estimates of
SDG Indicator 2.1.2 refer to the total number of people suffering from food insecurity, including at
moderate levels, it should come as no surprise that they correspond to a much higher number of people than
those who suffer from hunger.
Monitoring progress on ending hunger and ensuring access to food for
all
The Sustainable Development Goals (SDG) framework includes two indicators for monitoring SDG Target 2.1: the
prevalence of undernourishment
(SDG Indicator 2.1.1)
and prevalence of moderate or severe food insecurity based on the Food Insecurity
Experience Scale – FIES (SDG Indicator 2.1.2)
.1
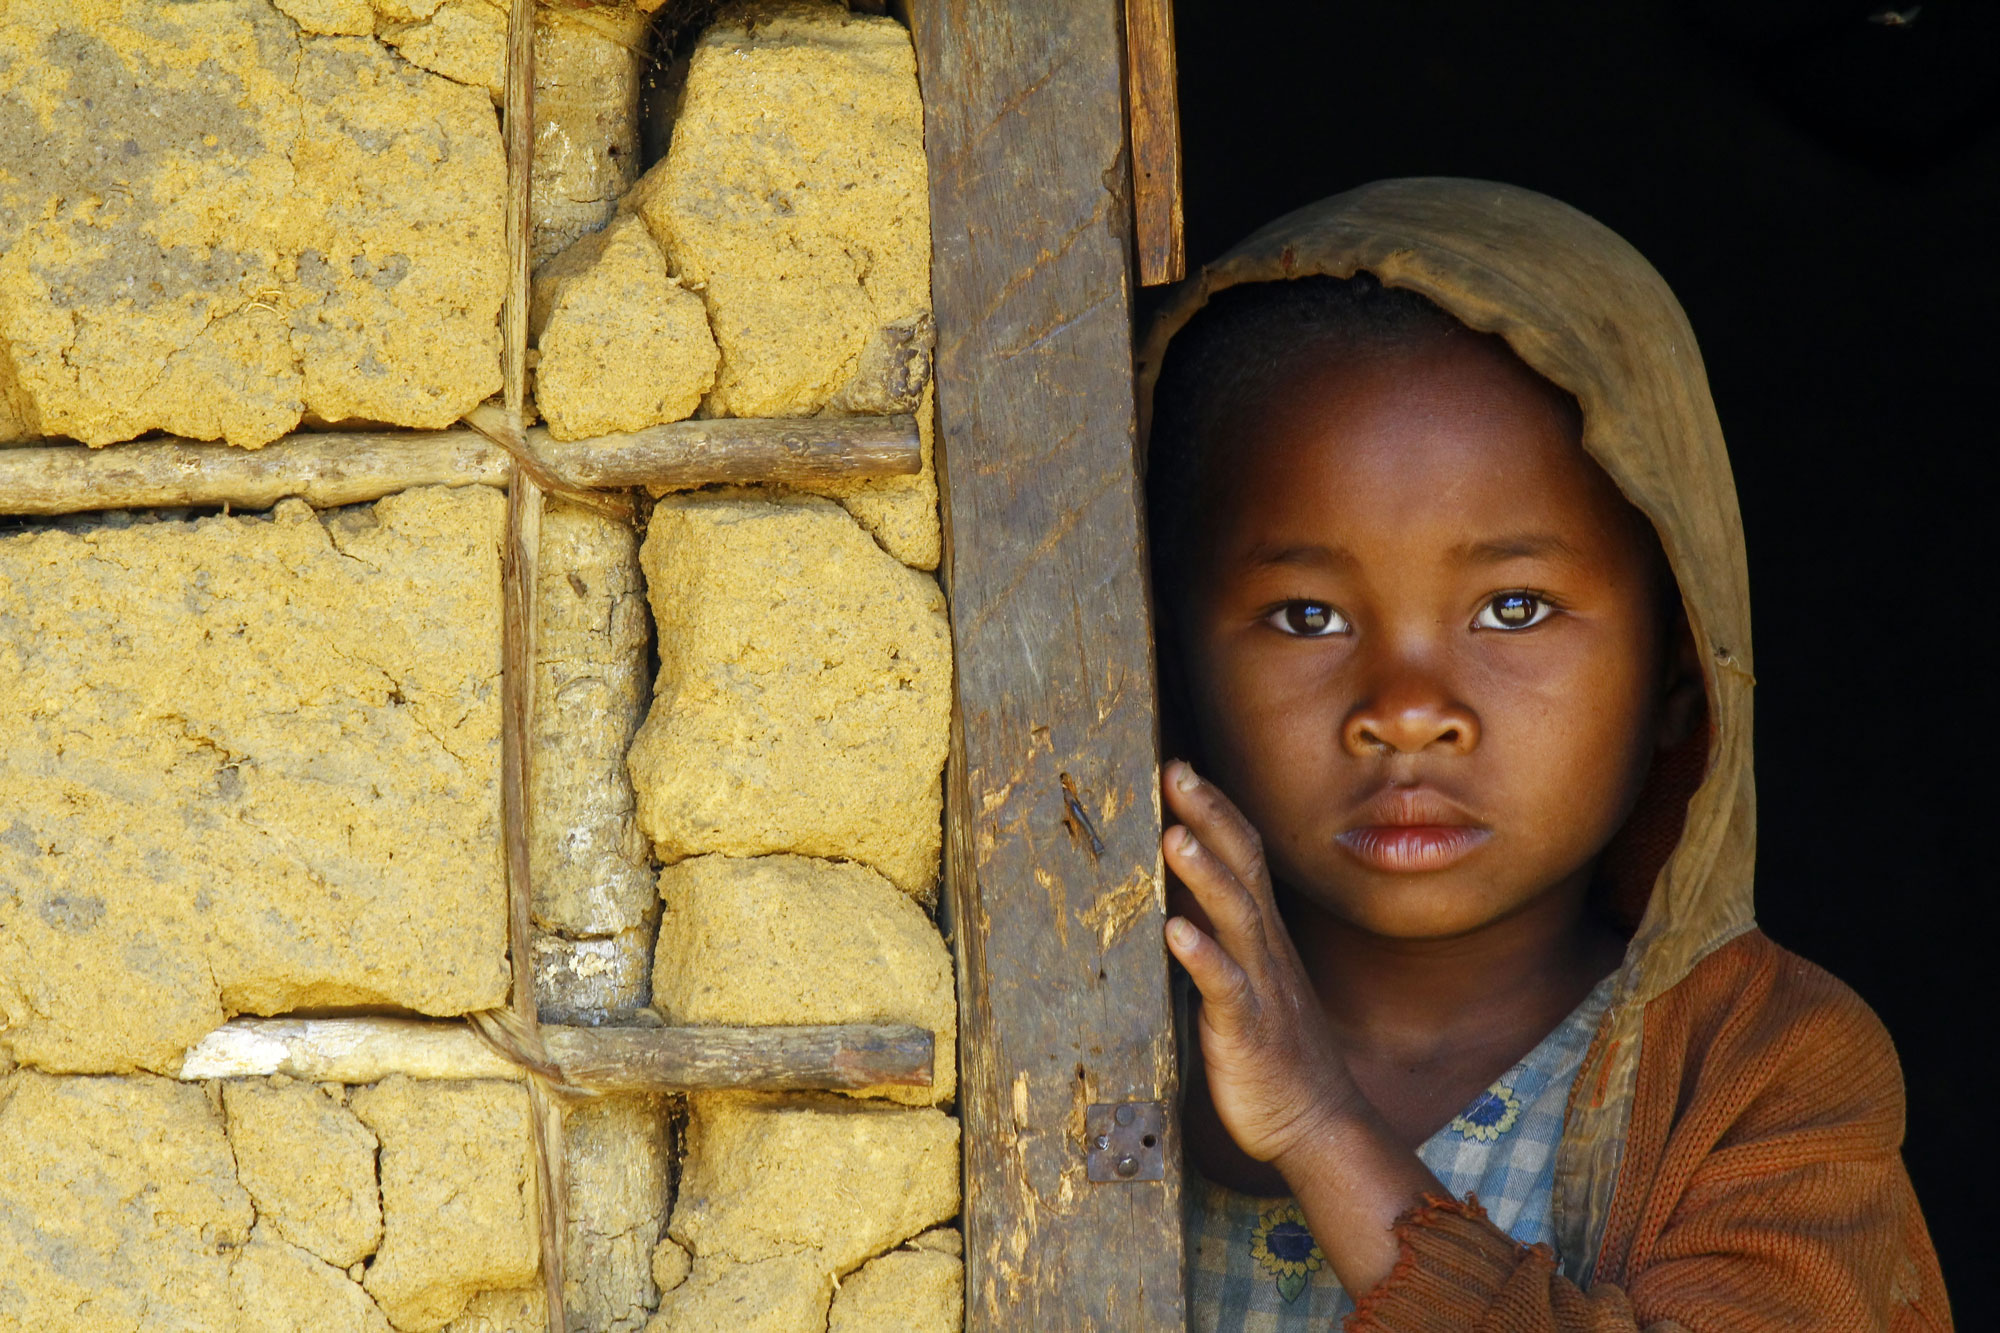
People experiencing moderate food insecurity face uncertainties about their ability to obtain food and
have
been forced to reduce, at times during the year, the quality and/or quantity of food they consume due to
lack of money or other resources. It thus refers to a lack of consistent access to food, which diminishes
dietary quality, disrupts normal eating patterns, and can have negative consequences for nutrition, health
and well-being. People facing severe food insecurity, on the other hand, have likely run out of food,
experienced hunger and, at the most extreme, gone for days without eating, putting their health and
well-being at grave risk.
Explanation of food-insecurity severity levels measured by the FIES in SDG Indicator 2.1.2
FOOD SECURITY
Adequate access to food in both quality and quantity.
MODERATE FOOD INSECURITY
People experiencing moderate food insecurity face uncertainties about their ability to
obtain food, and have been forced to compromise on the quality and/or quantity of the
food they consume.
SEVERE FOOD INSECURITY
People experiencing severe food insecurity have typically run out of food and, at worst,
gone a day (or days) without eating.
SDG Indicator 2.1.2
The prevalence of moderate or severe food insecurity in the population based on the FIES
Food security
Adequate access to food in both quality and quantity.
People experiencing moderate food insecurity have reduced the quality and/or quantity
of food
they eat and are uncertain they will be able to obtain food.
1 UN. 2017. United Nations Statistical Commission – 48th Session (2017). In: UNSD -
United Nations
Statistical Commission [online]. New York, USA. [Cited 4 April 2019].
https://unstats.un.org/unsd/statcom/48th-session;
and UN. 2017. Indicator 2.1.2: Prevalence of
moderate or severe food insecurity in the population, based on the Food Insecurity Experience Scale
(FIES). [Cited 4 April 2019] https://unstats.un.org/sdgs/metadata/files/Metadata-02-01-02.pdf 2 The other three dimensions of food security are food availability, utilization and stability.
Prevalence of undernourishment (PoU)
The two most recent editions of this report already offered evidence that the decades-long decline in the
prevalence of undernourishment in the world had ended and that hunger was slowly on the rise.
Additional evidence available this year confirms that the global level of the PoU has remained virtually
unchanged at a level slightly below 11 percent, while the total number of undernourished (NoU) has been
slowly increasing for several years in a row. This means that today, a little over 820 million people suffer
from hunger, corresponding to about one in every nine people in the world.
HUNGER - In the past three years, the number of people who suffer from hunger has slowly increased, with
more than 820 million people in the world still hungry today.
Prevalence of undernourishment (PoU) in the world, 2005–2018
Prevalence of undernourishment (%)
2005
2010
2015
2016
2017
2018*
World
14.5
11.8
10.6
10.7
10.8
10.8
Africa
21.2
19.1
18.3
19.2
19.8
19.9
Northern Africa
6.2
5.0
6.9
7.0
7.0
7.1
Sub-Saharan Africa
24.3
21.7
20.9
22.0
22.7
22.8
Eastern Africa
34.3
31.2
29.9
31.0
30.8
30.8
Middle Africa
32.4
27.8
24.7
25.9
26.4
26.5
Southern Africa
6.5
7.1
7.8
8.5
8.3
8.0
Western Africa
12.3
10.4
11.4
12.4
14.4
14.7
Asia
17.4
13.6
11.7
11.5
11.4
11.3
Central Asia
11.1
7.3
5.5
5.5
5.7
5.7
Eastern Asia
14.1
11.2
8.4
8.4
8.4
8.3
South-eastern Asia
18.5
12.7
9.8
9.6
9.4
9.2
Southern Asia
21.5
17.2
15.7
15.1
14.8
14.7
Western Asia
9.4
8.6
11.2
11.6
12.2
12.4
Western Asia and Northern Africa
8.0
7.1
9.2
9.5
9.8
9.9
LATIN AMERICA AND THE CARIBBEAN
9.1
6.8
6.2
6.3
6.5
6.5
Caribbean
23.3
19.8
18.3
18.0
18.0
18.4
Latin America
8.1
5.9
5.3
5.5
5.7
5.7
Central America
8.4
7.2
6.3
6.1
6.1
6.1
South America
7.9
5.3
4.9
5.3
5.5
5.5
OCEANIA
5.5
5.2
5.9
6.0
6.1
6.2
NORTHERN AMERICA AND EUROPE
< 2.5
< 2.5
< 2.5
< 2.5
< 2.5
< 2.5
NOTES: * Projected values.
SOURCE: FAO.
The situation is most alarming in Africa, where since 2015 the PoU shows slight but steady increases in
almost all subregions. In Asia, the PoU has been steadily decreasing in most regions, reaching 11.4 percent
in 2017. In Latin America and the Caribbean (LAC), rates of undernourishment have increased in recent years,
largely as a consequence of the situation in South America.
Prevalence of moderate or severe food insecurity
The 2019 edition of the report introduces for the first time estimates of the prevalence of food insecurity
combining moderate and severe levels. This indicator refers to an expanded range of food-insecurity severity
that encompasses moderate levels.
According to the latest estimates, 9.2 percent of the world population (or
slightly more than 700 million
people) were exposed to severe levels of food insecurity in 2018, implying reductions in the quantity of
food consumed to the extent that they have possibly experienced hunger.
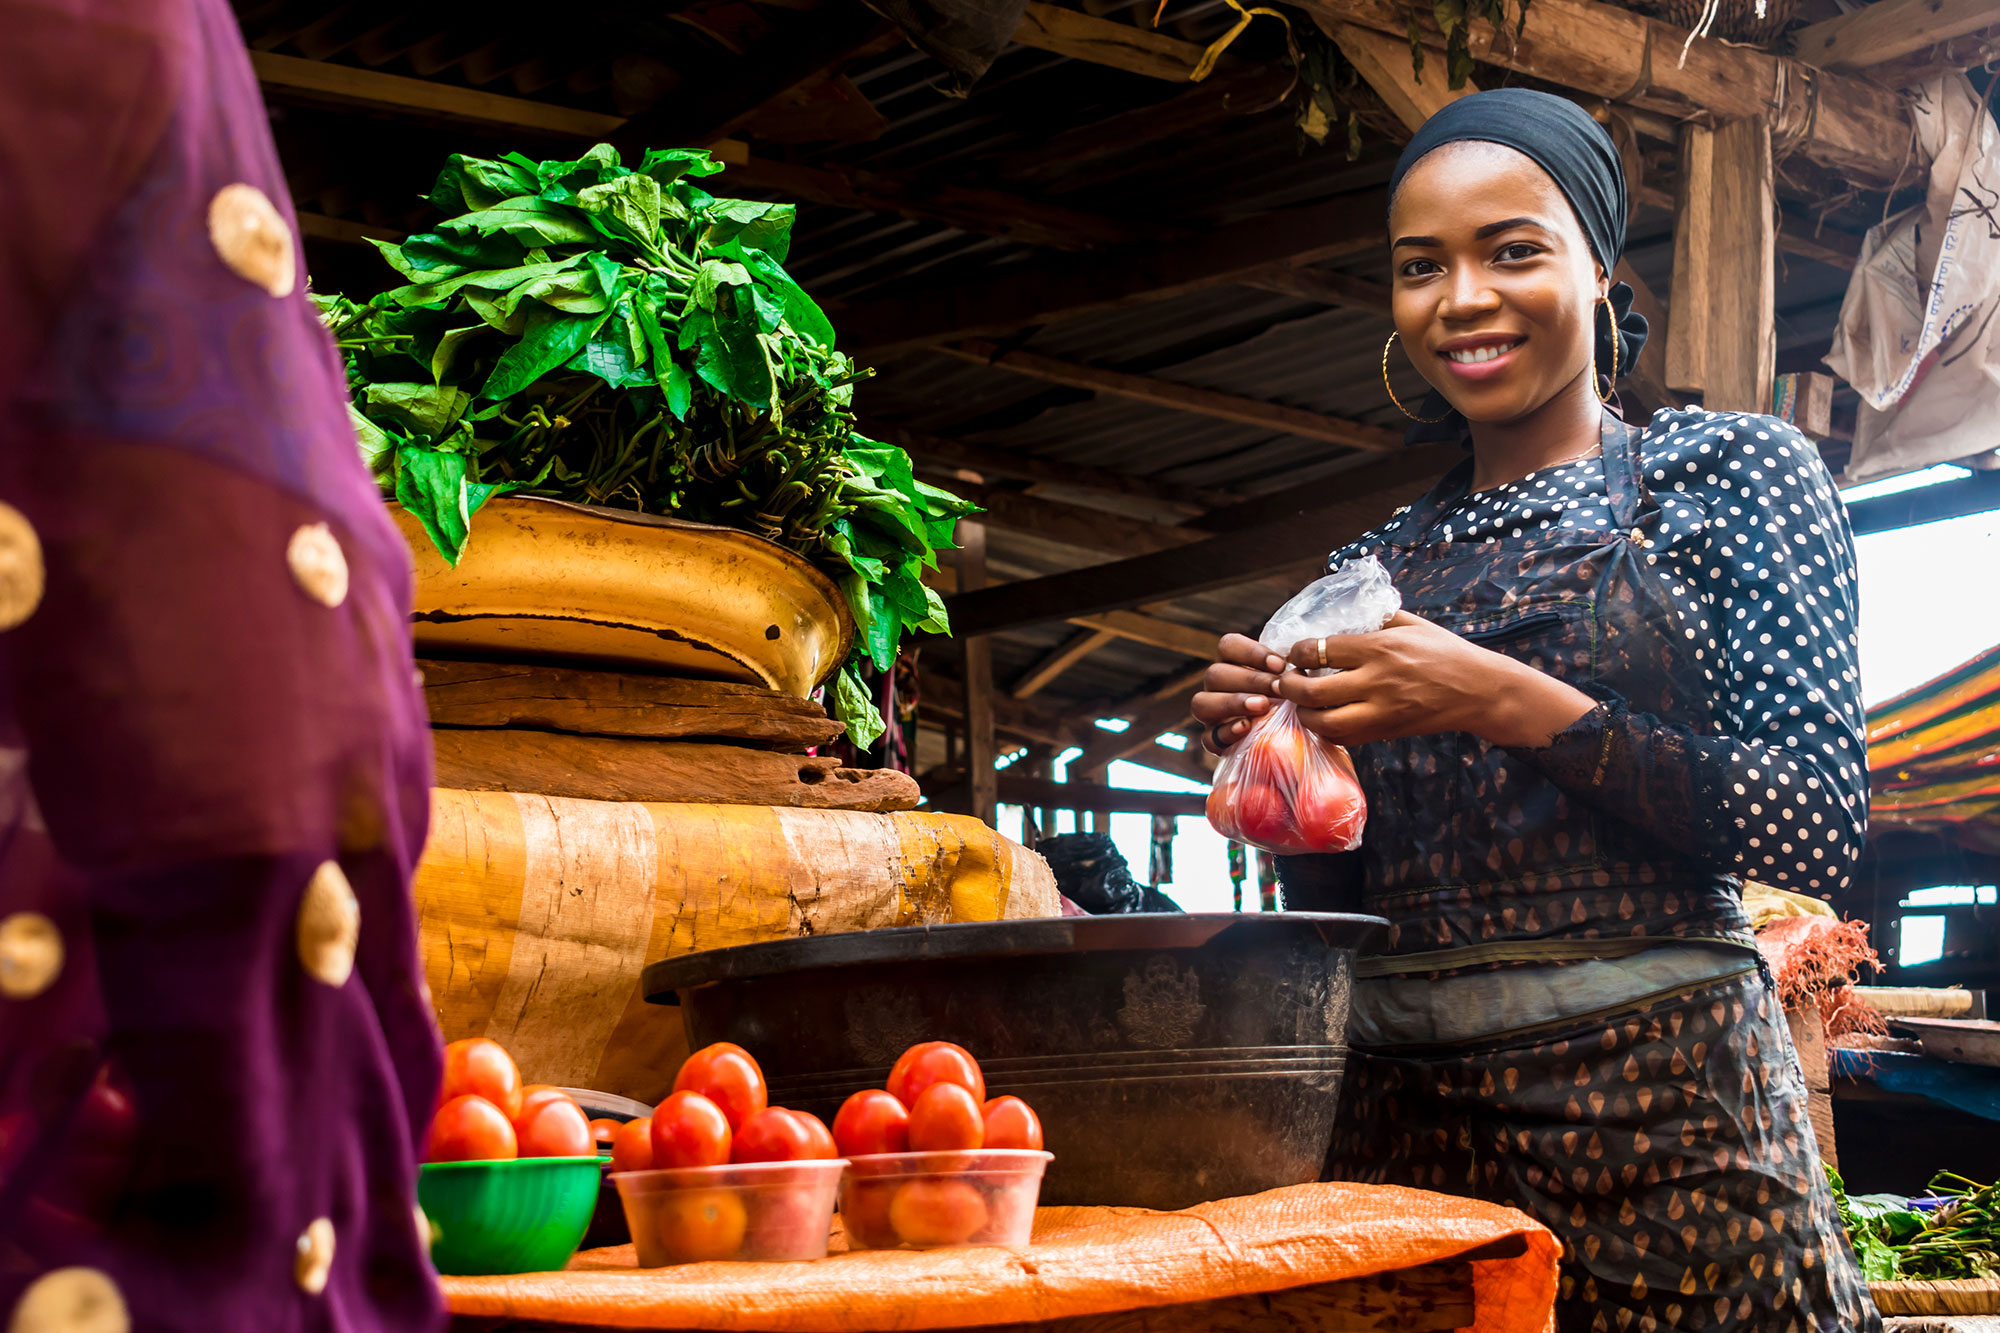
FOOD SECURITY - We estimate that over 2 billion people do not have regular access to safe, nutritious
and sufficient food.
A broader look at the extent of food insecurity beyond severe levels and hunger reveals that an additional
17.2 percent of the world population, or 1.3 billion people, have experienced food insecurity at moderate
levels, meaning they did not have regular access to nutritious and sufficient food.
The combination of moderate and severe levels of food insecurity brings the estimated total to 26.4 percent
of the world population, amounting to about 2 billion people.
The concentration and distribution of food insecurity by severity
differs greatly across the regions of the world
World
Total population
7 633 million
Asia
Total population
4 545 million
Africa
Total population
1 288 million
Northern America and Europe
Total population
1 106 million
Latin America
Total population
608 million
Total population
Moderate or severe food insecurity
Severe food insecurity
SOURCE: FAO.
Progress towards global nutrition targets
Malnutrition exists in multiple forms. Maternal and child undernutrition contributes to 45 percent of deaths
in children under five. Overweight and obesity are on the rise in almost all countries, contributing to 4
million deaths globally. The various forms of malnutrition are intertwined throughout the life cycle, with
maternal undernutrition, low birthweight and child stunting giving rise to increased risk of overweight
later in life.
This section assesses global and regional trends and patterns to track progress towards seven nutrition
indicators used to monitor global World Health Assembly targets for nutrition.
Global and regional trends
Low birthweight estimates indicate that one in seven live births, or 20.5 million babies globally, suffered
from low birthweight in 2015. If current trends continue, the 2025 World Health Assembly target of a 30
percent reduction in the prevalence
of low birthweight will not be met.
BIRTHWEIGHT – New low birthweight estimates indicate that one in seven live births were characterized by
low birthweight in 2015.
Estimates of exclusive breastfeeding reveal 41.6 percent of infants under six months being exclusively
breastfed in 2018 compared with 37 percent in 2012. In 2018, Africa and Asia had the highest prevalence of
exclusive breastfeeding. Conversely, however, these two regions have the highest prevalence of anaemia among
women of reproductive age.
Globally, the prevalence of stunting among children under five years is decreasing, while the number of
stunted children has also decreased from 165.8 million in 2012 to 148.9 million in 2018.
Globally, 7.3 percent (49.5 million) children under five years of age are wasted, two-thirds of whom live in
Asia.
In 2018, childhood overweight affected 40.1 million children under five worldwide; while in 2016, nearly two
in five adults (38.9 percent) were overweight, representing 2 billion adults worldwide. The prevalence of
overweight is increasing in all age groups and in all regions.
A closer look at the SDG indicators of wasting, stunting, and childhood overweight reveal striking regional
differences. In 2018, Africa and Asia bear the greatest share of all forms of malnutrition by accounting for
more than nine out of ten of all stunted children, over nine out of ten of all wasted children, and nearly
three-quarters of all overweight children worldwide.
OBESITY - Overweight and obesity continue to increase in all regions, particularly among school-age
children and adults.
Progress on malnutrition is too slow to achieve the 2025 and 2030 Global Nutrition Targets
Low birthweight
Exclusive breastfeeding
(< 6 months)
Stunting
(under 5 years)
Wasting*
(under 5 years)
Overweight
(under 5 years)
Anaemia
(women of reproductive age)
Obesity
(adults)
2025 WHA Global Nutrition Targets
2025 targets extended to 2030 to be aligned with the SDG timeline
NOTES: * Wasting is an acute condition that can change frequently and rapidly over the course of a
calendar year. This makes it difficult to generate reliable trends over time with the input data
available and, as such, this report provides only the most recent global and regional estimates.
SOURCES: Data for stunting, wasting and overweight are based on UNICEF, WHO and International Bank for
Reconstruction and Development/World Bank. 2019. UNICEF-WHO-The World Bank: Joint child malnutrition
estimates - Levels and trends (March 2019 edition) [online]. https://data.unicef.org/topic/nutrition,
www.who.int/nutgrowthdb/estimates, https://data.worldbank.org; data for exclusive breastfeeding are
based on UNICEF. 2019. Infant and Young Child Feeding: Exclusive breastfeeding, Predominant
breastfeeding. In: UNICEF Data: Monitoring the Situation of Children and Women [online].
https://data.unicef.org/topic/nutrition/infant-and-young-child-feeding;
data for anaemia are based on
WHO. 2017. Global Health Observatory (GHO). In: World Health Organization [online]. Geneva, Switzerland.
[Cited 2 May 2019]. http://apps.who.int/gho/data/node.imr.PREVANEMIA?lang=en;
data for adult obesity are
based on WHO. 2017. Global Health Observatory (GHO). In: World Health Organization [online]. Geneva,
Switzerland. [Cited 2 May 2019]. http://apps.who.int/gho/data/node.main.A900A?lang=en;
and data for low
birthweight are based on UNICEF and WHO. 2019. UNICEF-WHO Low Birthweight Estimates: levels and trends
2000–2015, May 2019. In: UNICEF data [online]. New York, USA, UNICEF [Cited 16 May 2019].
https://data.unicef.org/resources/unicef-who-low-birthweight-estimates-levels-and-trends-2000-2015
Towards an integrated understanding of food security and nutrition
for health and well-being
To accelerate progress towards ending hunger and achieving food security and improved nutrition it is
important to fully grasp the connections between food insecurity and malnutrition, and the drivers
underlying both.
This section presents new evidence from two analyses of the links between moderate or severe food insecurity
and various forms of malnutrition.
Results of the first analysis of country-level indicators show that, if one focuses attention on countries of
similar levels of undernourishment and poverty, obesity rates are higher in those countries where moderate
food insecurity is also higher.
As national economies grow, people facing difficulties in accessing food, as captured by an experience-based
indicator of food insecutiy, have a higher risk of obesity.
CONNECTIONS - Countries with higher prevalence of moderate or severe food insecurity tend to have higher
rates of adult obesity.
Results of an analysis of micro-level data obtained from nationally representative surveys reveal that living
in a household classified as food insecure contributes to explain the status of being affected by one or
another form of malnutrition in seven of the eight countries studied. Household food insecurity is
associated with indicators of child undernutrition in most of the countries.
The association of food insecurity with overweight and obesity (across different age groups) varies depending
on the income level of the country. In the low- and lower-middle-income countries considered, living in a
food-insecure household either decreases the likelihood of being overweight or obese or has a very weak or
no association. In upper-middle- and high-income countries, food insecurity increases the likelihood of
being overweight or obese in some age groups.
Sustained escapes from food insecurity and malnutrition in the face
of economic slowdowns and downturns
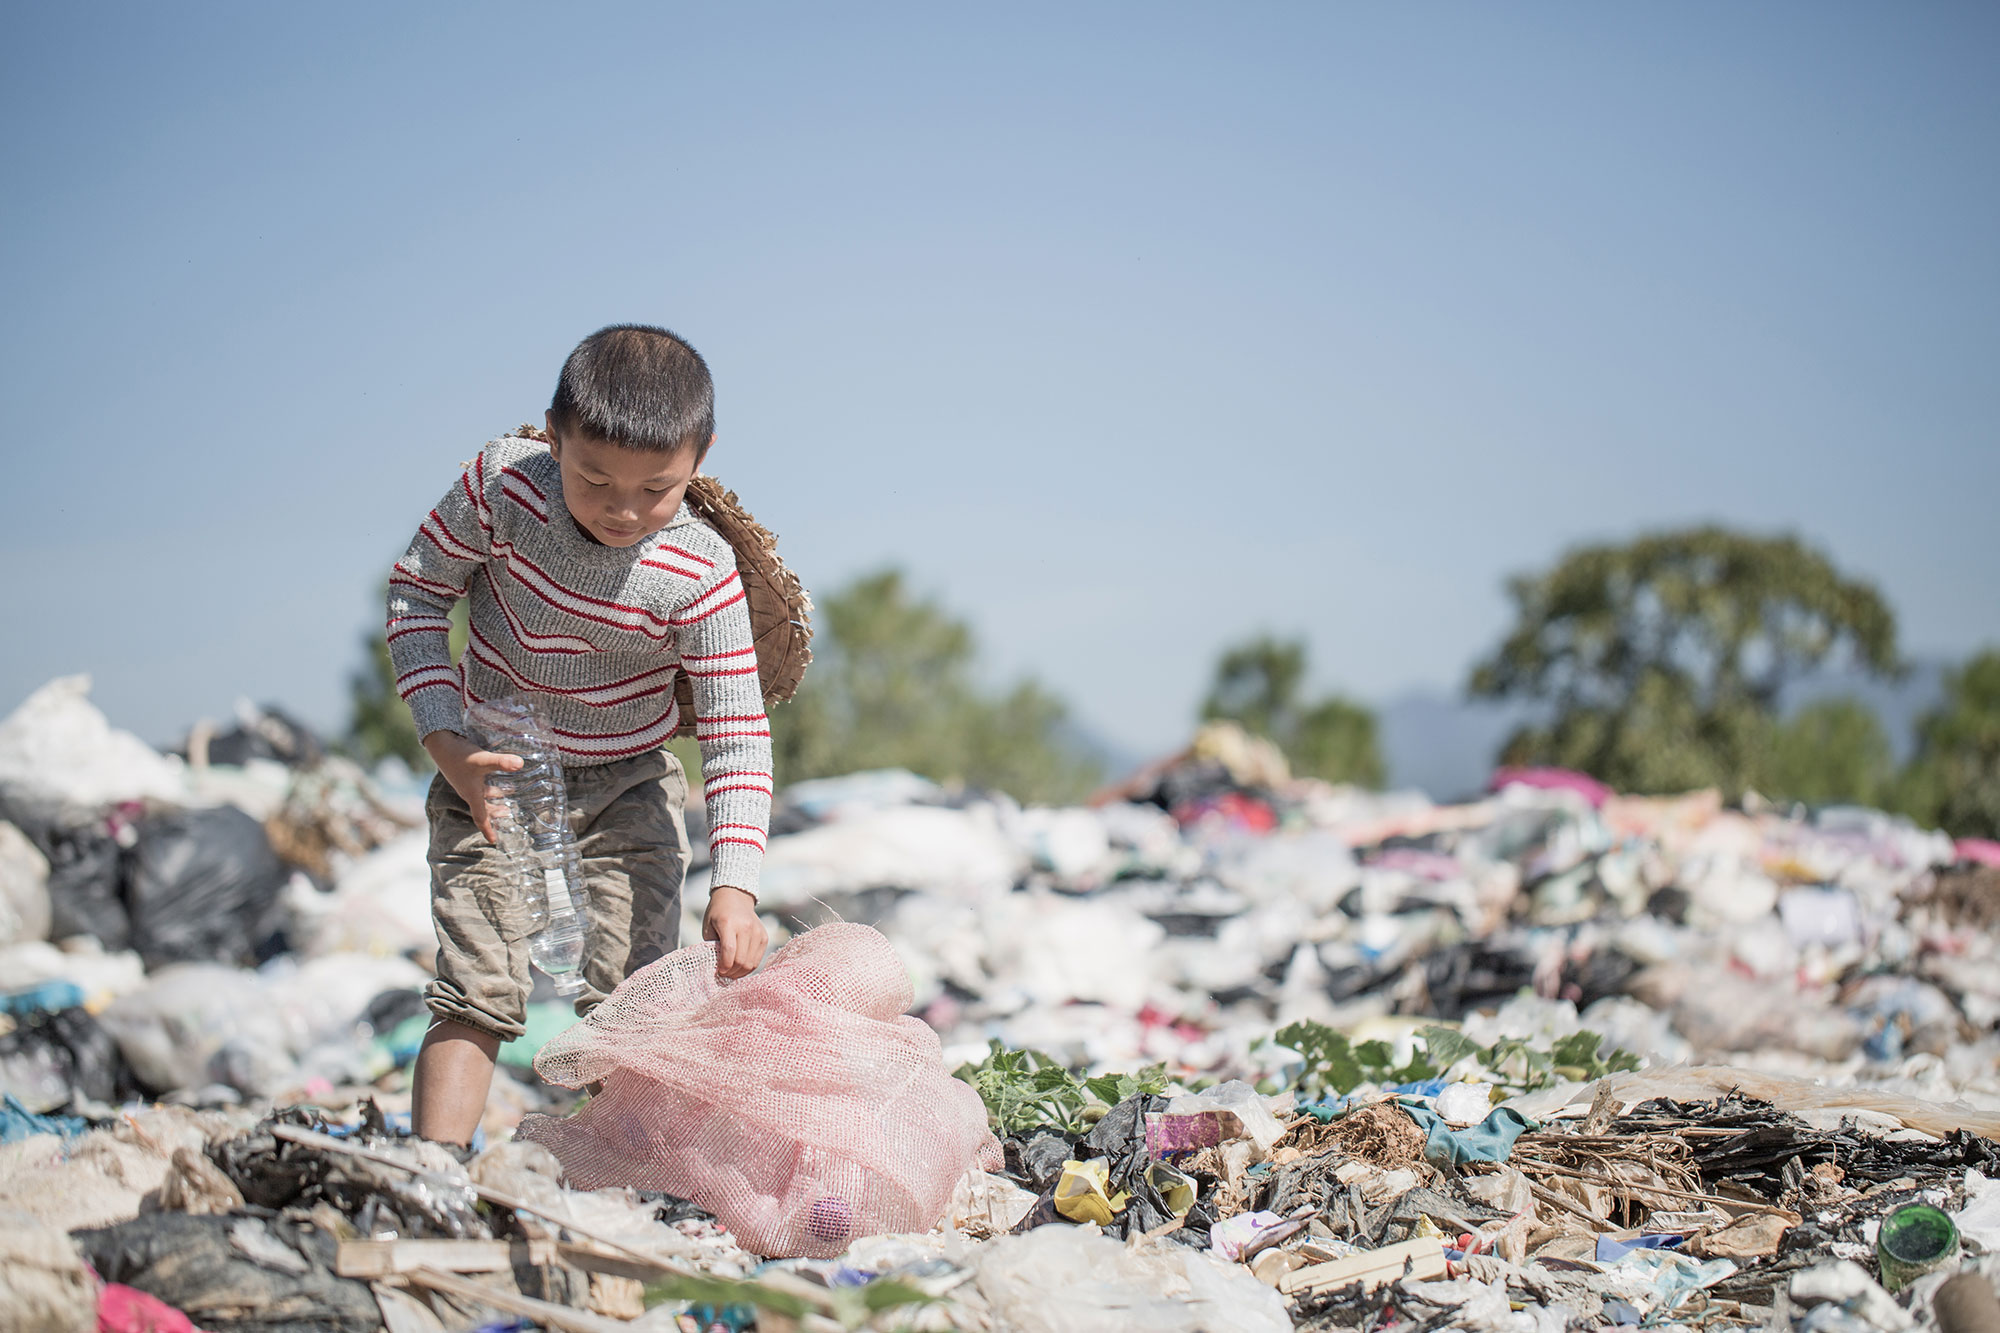
UNEVEN - The uneven pace of global economic recovery raises concerns regarding prospects for ending
hunger and malnutrition in all its forms.
This year’s report looks closely at the role that economic slowdowns and downturns have played in recent food
security and nutrition trends. This is critical to understanding future trends in hunger and malnutrition,
especially given the dark predictions of the latest global economic prospects, with slowing and stalled
economic growth in many countries, including emerging and developing economies.
The impact of economic slowdowns and downturns on food security and nutrition cannot be separated from the
root causes of hunger and malnutrition: poverty, inequality and marginalization.
Ultimately the analysis points to policies and programmes that can protect the most vulnerable from the
impact of economic slowdowns and downturns, while fostering food security and nutrition from a perspective
of more inclusive economic growth. Ending hunger and malnutrition by 2030 will require greater efforts and
integrated approaches to eradicate extreme poverty, ensure decent work and inclusive economic growth, and
reduce inequalities.
Economic slowdowns and downturns and their impact on food security
and nutrition
How are economic slowdowns and downturns relevant to the quest to
eradicate hunger and malnutrition?
Hunger has been on the rise in many countries where the economy has slowed down or contracted. Between 2011
and 2017, this increase coincided with an economic slowdown or downturn in 65 out of 77 countries.
Furthermore, economic shocks tend to be significant secondary and tertiary drivers that prolong and worsen
the severity of food crises, especially in countries experiencing acute food insecurity requiring urgent
humanitarian assistance.
Economic slowdowns and downturns often lead to a rise in unemployment and decline in wages and incomes,
challenging access to food and essential social services for the poor. People’s access to high-quality,
nutritious food can be affected, as can access to basic services such as health care.
in focus
What are economic slowdowns and downturns?
An economic slowdown is when economic activity is growing at a slower pace. An economic slowdown
occurs when real GDP growth declines from one period of time to another but is still positive.
An economic downturn is when there is no growth, but rather a period of decline in economic activity.
It refers to a period of economic contraction or negative economic growth as measured by the growth
rate in real GDP.
An economic shock is an unexpected event that is external to the specific economy and can either harm
or boost it. A global financial crisis causing bank lending or credit to fall, a steep rise in oil
and gas prices, or natural disasters that result in sharp falls in production, are examples of
economic shocks.
Recent world economic reports highlight that slowdowns, stagnation and outright recessions are evident in
several economies and already leading to increased unemployment and declines in income. There may soon be
yet another global economic downturn.
SLOWDOWN - Most countries (84 percent) that experienced a rise in undernourishment between 2011 and 2017
simultaneously suffered an economic slowdown or downturn – and the majority of these are middle-income
countries.
Trends in economic slowdowns and downturns
In most regions, the economy rebounded after the sharp 2008–2009 global economic downturn. But the recovery
was uneven and short lived – real GDP per capita growth is being challenged particularly in regions with
some of the highest levels of food insecurity and malnutrition.
Within subregions, the situation is worse. In the last few years, real GDP per capita growth on average
declined in seven subregions, five of which experienced negative growth in different years. In 2018, these
five subregions combined were home to almost 263 million undernourished people.
Real GDP per capita growth has been uneven since the 2008–2009 sharp global downturn
Africa
Asia
Latin America and the Caribbean
Northen America and Europe
Oceania
NOTES: Annual rate of per capita GDP growth at constant 2010 prices that occurred in the five
regions during the period 1996–2017.
SOURCES: UN. 2019. National Accounts – Analysis of Main Aggregates. In: UNSTATS [online]. New York,
USA. [Cited 6 May 2019] https://unstats.un.org/unsd/snaama; and for North America and Europe UNCTAD.
2019. Gross domestic product: Total and per capita, growth rates, annual. In: UNCTADSTAT [online].
New York, USA. [Cited 14 May 2019].
https://unctadstat.unctad.org/wds/TableViewer/tableView.aspx?ReportId=109
Rises in undernourishment in places where the economy slowed down
or contracted
Hunger, as measured by the prevalence of undernourishment (PoU), has been on the rise in many countries where
the economy has slowed down or contracted. Strikingly, the majority of the countries (44 out of 65) are
middle-income countries. Only 19 (out of 65) are low-income countries, of which 17 are located in
Africa (see figure 24).
Economic slowdowns and downturns worsen global food crises
While economic shocks are rarely the primary drivers of food crises, in many instances, they worsen the
severity of acute food insecurity, as well as prolonging the duration of the crisis.
In fact, more than 96 million people in 33 countries who suffered from acute food insecurity in 2018 lived in
places where the economy was undergoing economic shocks of rising unemployment, lack of regular work,
currency depreciation and high food prices. The economy of most of these countries (27 out of 33) was
contracting, according to their real GDP per capita growth for 2015–2017.
In food crisis contexts, the interaction between conflict and economic slowdowns and downturns is
particularly important. In 2018, conflict and insecurity were the major driver of food crises in 21
countries – 14 of them experienced deep economic recessions with an average negative difference of 2.4
percentage points in economic growth between years 2014 and 2017.
Economic slowdowns and downturns also lowers the resilience capacity of households to respond to other shocks
– including climate shocks.
Commodity dependence and its relevance for food security and
nutrition
DEPENDANT - Eighty percent of the countries with a rise in hunger during recent economic slowdowns and
downturns are highly dependent on primary commodities for export and/or imports.
Commodity price trends and booms
Low- and middle-income countries are exposed to external vulnerabilities. A key vulnerability arises relating
to what these countries produce and what they trade with the rest of the world: essentially, primary
commodities.
International commodity price shocks and volatility can create harmful impacts for food security and
nutrition in all combinations of high commodity dependence. The trend in rising commodity prices that
started in 2003 and the period of extreme price volatility in 2008 have been followed by largely declining
global commodity prices for five consecutive years from 2011 to 2016.
Why does commodity dependence matter?
Commodity dependence matters because it increases the vulnerability of countries to world price swings.
Recent slowdowns and downturns in economic growth in many regions are largely explained by marked declines
in commodity prices. This is mainly affecting countries dependent on primary commodity exports, particularly
in South America, but also other regions including Asia and some countries in Africa.
Countries from these regions are commodity-export-dependent as they derive the bulk of their export earnings
from primary commodities. Many of these countries also show commodity-import dependence having a high ratio
of commodity imports to total import merchandise traded. This includes essential goods, such as food items
and fuel.
Out of a total of 134 low- and middle-income countries studied for the period 1995–2017, 102 countries are
classified according to three types of high commodity dependence, whereas the remaining 32 are low commodity
dependent.
Most of the countries (52 out of 65) that experienced rising undernourishment in correspondence with
economic deceleration during 2011–2017 are highly dependent on primary commodity exports and/or
imports.
In 2018 most (27 out of 33) of the food crisis countries where economic shocks worsened the severity of acute
food insecurity are high primary commodity-dependent countries. Most are also net food-import dependent (25
out of 33), where inflationary pressure stemming from the depreciation of national currencies against the US
dollar was a key factor that contributed to an escalation in domestic food prices.
Many high commodity-dependent countries (67 out of 102) witnessed a rise in hunger or a worsening food crisis
situation during 2011–2017. Twenty-three high commodity-dependent countries underwent two or more
consecutive years of negative growth and most of these (15 countries) also saw rises in undernourishment or
a worsening food crisis situation in 2018.
Commodity dependence and food security and nutrition:
transmission channels
Designing policies to help offset the vulnerability that arises with high commodity dependence requires
direct and indirect channels that link global commodity markets with domestic economic, social and human
development outcomes, including food security and nutrition.
The transmission channels are complex, and a given commodity price change does not affect all
commodity-dependent countries in a uniform manner.
There are direct impacts emanating as the change in commodity prices affects terms of trade, exchange rate
adjustments and the balance of payments; and secondary indirect effects of these macroeconomic impacts on
domestic prices, including food; unemployment, declining wages and loss of income; and health and social
services.
Terms of trade, exchange rate and balance of payments
Sharp and continuous declines in international commodity prices from 2011 to 2016 led to substantial shifts
in the terms of trade (TOT) and a sharp deterioration of GDP growth in commodity-dependent countries.
Declines in commodity prices since 2011 led to a deterioration in public finances for many
commodity-export-dependent countries (oil and non-oil exporters) in Asia, Africa, North Africa and the
Middle East, and in Latin America and the Caribbean.
For many commodity-dependent countries that experienced an increase in undernourishment or worsening food
crises, the decline in commodity prices from 2011 to 2016 is associated with significant currency
depreciations.
Rising domestic prices, including food
The pass-through of international commodity price developments to local domestic prices can be particularly
challenging for food security and nutrition, as it can affect people’s access to food, care and feeding, as
well as access to health services.
Declining commodity prices may result in depreciation and devaluation of currencies that may pass through the
system resulting in domestic price increases, including food prices.
In these situations, households that need to buy food are immediately affected by higher domestic retail
prices as the cost of food relative to their incomes increases.
Unemployment and loss of income and wages
Sluggish economic activity as a result of falling commodity prices can lead to unemployment, loss of wages
and, consequently, loss of incomes.
The impacts can be felt particularly hard in agriculture, both because of what happens within the sector and
because of urban-rural linkages.
Where export crops are grown by smallholder producers, the impacts can be more widely spread.
Health and social intersectoral effects
For high commodity-dependent countries reductions in fiscal revenues in the wake of low or declining
commodity prices can threaten the continuity of social programmes, safety nets, and other components of
economic and social development plans. Cuts to health and social sector spending can have negative impacts
on food security and nutrition, with potentially lifelong and intergenerational implications for health and
development.
IMPACTS - Cuts to health and social sector spending can have negative impacts on food security and
nutrition.
Health expenditure as a percentage of total government expenditure in high commodity-dependent countries
during the 2008-2015 period contracted by 1.3 percent for low-income countries (compared with an increase
for this specific period in other low-income countries), by 0.6 percentage points for lower-middle-income
countries, and by 0.3 percentage points for upper-middle-income countries.
Similarly, reduced education expenditure means less investment in school infrastructure relevant to health,
such as for safe water and sanitation, which affects the risk of infectious disease, such as diarrhoea, that
can exacerbate or be exacerbated by undernutrition.
How households cope and when they fail
Households facing a reduction in purchasing power as a result of economic events have to look for ways to
cope with these shocks to maintain food security and consumption, but many coping strategies that are used
during single shocks are ineffective.
Households might have to take up lower paying jobs, often in the informal sector, or try to make use of any
savings or insurance mechanism at their disposal.
However, with increased prices, savings will buy less food than before and households might find it more
difficult to borrow from family members or access informal insurance groups such as village funds. Also,
public spending on safety nets might decrease during economic slowdowns, thereby leaving behind many
households in need.
Nexus between economic growth, poverty, and food security and
nutrition: the role of inequality
Poverty and socio-economic inequalities also matter
Economic slowdowns and downturns generate a number of direct and indirect impacts that flow through different
transmission channels and challenge food security and nutrition. The final impact on food security and
nutrition, however, depends on how many poor people live in the country and the extent to which they face
exclusion due to inequalities.
On the one hand, economic slowdowns and downturns tend to be correlated with increases in poverty and
inequality. On the other hand, poverty, inequalities and marginalization are some of the underlying causes
of hunger and malnutrition in all its forms. But the relationships between these factors are not so simple,
for a number of reasons.
First, it is not always true that robust economic growth helps to reduce poverty and improve food security
and nutrition. Economic growth, although necessary, may not be sufficient to ensure poverty reduction, food
security and nutrition. Second, poverty, food security and nutrition do not always move in unison. Countries
can achieve robust economic growth and poverty reduction, but this does not always translate into improved
food security and nutrition. Third, when poverty reduction does result in increased food security, this does
not necessarily mean nutritional status will be improved as well.
The role of inequalities and marginalization in shaping
food-security and nutrition outcomes
Economic growth alone is not sufficient to reduce extreme poverty or improve food security and nutrition.
Inequality, not only in the distribution of income, but also in access to nutrition-relevant services and
social and health infrastructure, is critical in understanding why this is so. In fact, evidence indicates
that in countries that have greater levels of inequality, economic slowdowns and downturns have a
disproportionately negative effect on food and nutrition security.
POVERTY - Economic events will ultimately affect food security and nutrition, depending on extreme
poverty levels and the extent to which the poor face exclusion due to different inequalities.
Income inequality is rising in nearly half of the countries in the world, including many low- and
middle-income countries. Notably, several countries in Africa and Asia have seen large increases in income
inequality over the last 15 years. Inequality increases the likelihood of severe food insecurity, and the
prevalence of severe food insecurity is almost three times higher in countries with high income inequality
(21 percent) compared with countries with low income inequality (7 percent).
The greater the inequality in asset distribution such as land, water, capital, finance, education and health,
the more difficult it is for the poor to participate in economic growth processes. This then slows the
progress in reducing food insecurity and malnutrition. Socially excluded and marginalized groups are likely
to be hit particularly hard by economic downturns.
Policies for achieving sustainable escapes from food insecurity and
malnutrition in the context of economic slowdowns and downturns
The imperative of safeguarding food security and
nutrition
Economic slowdowns and downturns pose challenges for food security and nutrition; creating sustained escapes
requires safeguarding against these and tackling increasing inequalities.
This report calls for action on two fronts: the first, safeguarding food security and nutrition through
economic and social policies that help counteract the effects of economic slowdowns or downturns, including
guaranteeing funding of social safety nets and ensuring universal access to health and education; and, the
second, tackling existing inequalities at all levels through multisectoral policies that make it possible to
more sustainably escape from food insecurity and malnutrition.
Acting on these two fronts requires short- and long-term policy responses that will depend on institutional
capacity and availability of contingency mechanisms and funds to support them.
In the short term, countries need to protect incomes so as to counteract economic adversity. It is
critical to strengthen savings capacity when the economy is growing, using available instruments (automatic
fiscal stabilizers, stabilization funds, sovereign wealth funds, macro-prudential norms, and the like), so
as to make countercyclical policies feasible.
In the longer term, countries need to invest wisely during periods of economic booms to reduce
economic vulnerabilities and inequalities; build capacity to withstand shocks; maintain health and other
social expenditures; use policy tools to create healthier food environments; and quickly recover when
economic turmoil erupts. This requires balancing a set of policies and investments to achieve an inclusive
structural transformation that diversifies the economy away from commodity dependence, while also fostering
poverty reduction and more egalitarian societies.
Conclusions
This year’s report continues to signal the significant challenges that remain in the fight against hunger,
food insecurity, and malnutrition in all its forms.
Short- and medium-term policies should aim at achieving a pro-poor and inclusive transformation, but this
will not be possible by focusing on economic growth alone. It will require tackling existing inequalities at
all levels, through multisectoral policies that keep these inequalities as the central focus.
Ultimately, this kind of transformation will only materialize if policies effectively strengthen the economic
resilience of countries to safeguard food security and nutrition at those times when the economy slows or
contracts.