by
A.B. Thompson and A. Bulirani
UK/SADC Pelagic Fish Resource Assessment Project
P.O. Box 311
Salima
Malawi
ABSTRACTThe Usipa, Engraulicypris sardella, is an exploited pelagic cyprinid, endemic to Lake Malawi/Niassa, which reaches a maximum length of about 130 mm. Records of its growth rate are scarce in the literature. Growth rates of this species were therefore estimated by two methods. Firstly, the number of rings on the astericus and sagitta otoliths was counted, using the Bioscan Image analysis system, to give the age of the fish in days. Secondly, length-frequency modes were followed in unpublished historical data using the Length Frequency Distribution Analysis computer package sponsored by the Overseas Development Administration. The preliminary results are presented and discussed in this paper. RESUMEL'Usipa, Engraulicypris sardella, est un cyprinidé pélagique exploité, endémique du lac Malawi/Nyassa, dont la longueur atteint au maximum 130 mm environ. Il est rare de trouver dans les ouvrages spécialisés des précisions sur son taux de croissance. On l'a donc estimé par deux méthodes: premièrement, on a compté le nombre d'anneaux sur l'asteriscus et les sagitta otoliths à l'aide du système Bioscan d'analyse de l'image, pour obtenir l'âge du poisson en nombre de jours. Deuxièmement, on a suivi les fréquences de longueusr d'après des données en utilisant le logiciel d'analyse de la distribution des fréquences de longueurs établi sous l'égide de l'Overseas Development Administration. Les premiers résultats sont présentés et discutés dans cette communication. |
The Usipa, Engraulicypris sardella, is a pelagic cyprinid endemic to Lake Malawi/Niassa which supports a substantial fishery using open water and beach seines. Between 1975 and 1985 the annual landings of Engraulicypris in the Malawian sector of the lake have ranged from 143 to 3273 tonnes (Malawi Fisheries Department statistics). It has been suggested that the actual landings could be as much as ten times higher than the reported estimates because of the great difficulty in obtaining accurate catch statistics (Tweddle and Lewis, 1990). Engraulicypris grows to a maximum length of 120–130 mm and is known to occur throughout the lake from very close to the edge to the centre and down to depths of 200 m. Small larvae, less than 5 mm in length, have also been seen in the centre of the lake (FAO, 1982). Jackson et al. (1963) reported that they laid “large numbers of floating eggs” but, unfortunately, attached no description or citation to this statement. Extensive sampling of surface waters with a neuston net during the present study found no evidence of floating eggs and it is likely that the earlier observations were of the moulted integument of the eyes of Chaoborus which occasionally appear in large numbers floating on the surface (A. Thompson, personal observation). Engraulicypris eggs have still to be positively identified and their spawning sites are presently unknown.
The standard techniques for the estimation of growth parameters from a time series of length-frequency distributions are well discussed in many fisheries textbooks (e.g. Ricker, 1975; Pitcher and Hart, 1990). The more recent method of counting daily rings on otoliths has been applied mainly to larval fish from temperate climates (Campana and Nielson, 1985; Campana et al., 1987) although some studies have been done in the tropics (Ntiba and Jaccarini, 1988). Validation experiments on the rate of ring deposition in otoliths (usually assumed to be daily) with UV fluorescent stains have been done in some species of fish (Tsukamoto, 1988), but this has not yet been done for Engraulicypris in Lake Malawi/Niassa. This work is currently in progress.
Engraulicypris has three pairs of otoliths which form at different times. The astericus and lapillus are seen in larvae less than 15 mm long, whilst the sagittae can only be seen in fish above 15 mm. Furthermore, the astericus is slightly larger than the lapillus and has rings that are easier to see in small larvae (FAO, 1982) so it is the otolith of choice for age determination in this species. However, the astericus develops two prominent projections as the fish grow, which makes ring deposition irregular and counting difficult. It is therefore necessary to use the sagittae for age determination of larger fish as the rings are deposited in reasonable concentric circles.
The use of modal progression in length-frequency plots of sequentially sampled fish populations is also a well-established method of determining growth rates, although precise ages can only be determined if the cohort is followed from first hatching (Pauly and Morgan, 1987). Unpublished length-frequency distributions of Engraulicypris collected on the vicinity of Monkey Bay (14° 04'S: 34° 55'E) and Nkhata Bay (11° 36'S: 34° 18'E) were available for analysis and the results of the two approaches were compared.
A sample of 56 Engraulicypris, ranging from 33–101 mm total length, was collected at Senga Bay (13° 43'S: 34° 39E) during August and September 1991 and frozen for storage. A further sample of 40 fish, measuring from 4–14 mm total length, was collected in the northern part of the lake on 28 August 1992 and preserved in 90% alcohol. In the laboratory, the sagittae were removed from fish in the first sample and the astericus otoliths from the second. The otoliths were placed on a glass microscope slide and mounted in glass bond glue. Sagittae were ground with 30 μm and 3 μm grit grinding paper and viewed at 400x magnification. Asterici were mounted in glass bond but it was not necessary to grind them because of their small size and they were viewed under an oil immersion objective at 1000x magnification. Images were displayed on a monitor using the Optimas Bioscan Image Analysis package. Computer enhancement was used to improve image contrast when necessary.
Samples of Engraulicypris were collected with beach seines lined with either a fine mesh or mosquito netting; the actual size of the mesh is unknown but it is likely to have been from 2–10 mm stretched. Time series were available from the Monkey Bay fisheries station and the Nkhata Bay areas (lles, 1960) (Table 1). The samples were grouped into 10-day sample periods. Von Bertalanffy growth functions were fitted to selected modes using the ELEFAN programme supplied with the Length Frequency Distribution Analysis (LFDA, 1992) computing package. When several pairs of L∞-K parameter estimates were identified by the programme the pair with the value of L∞ nearest to 130 mm was chosen, as this value is known to be near the maximum observed length of Engraulicypris. A straight line equation was fitted to the means of the length-frequency distributions when growth appeared to be linear rather than asymptotic in form. The growth rates were then derived from the fitted growth curve.
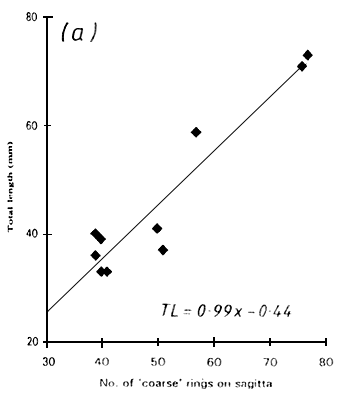
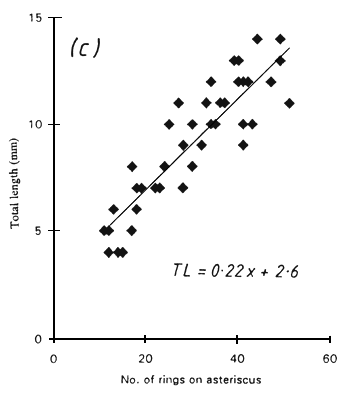
Two types of rings were visible on the sagittae, and were referred to as “coarse” and “fine” rings. The coarse rings were most apparent when the image was slightly out of focus were about 3–8 μm in width. The fine rings were most obvious when the image was in sharp focus and were about 1–2 μm wide. It was not always possible to see both ring types in a single sagitta preparation but both types could sometimes be seen clearly by altering the focus whilst viewing exactly the same region of the otolith. Only fine rings could be seen in asterici with a width of 0.5–1.3 μm. There was a linear relationship between the number of rings and the total length of the fish in all cases (Fig. 1) but a considerable scatter was evident. This produced a wide range of growth rate estimates, as follows:
| growth rate (mm day-1 with 95% confidence limits | |
| Sagitta “coarse” | 0∙99 (0∙75–1∙23) |
| Sagitta “fine” | 0∙35 (0∙26–0∙44) |
| Astericus | 0∙22 (0∙18–0∙25) |
The estimated growth rates did not vary in relation to the length of the fish (Fig. 2).
The choice of modes to use in the analysis was, in most cases, relatively easy as far as the Monkey Bay samples were concerned. Those peaks which did not look as if they arose from the same cohort were excluded (Fig. 3). The peaks in the samples from Nkhata Bay were less obvious (Fig. 4) and so their identification was much more subjective. The von Bertalanffy parameter estimates ranged from L∞=108–135 mm an K = 0∙0013–0∙0045 day-1. In two cases a von Bertalanffy curve could not be fitted to the Nkhata Bay data and a linear growth pattern was fitted instead (Table 2). Estimated values of to were not meaningful because the birthdate of the cohorts were unknown.
The growth rates of Engraulicypris ranged from above 0.4 mm day-1 for the Nkhata Bay samples down to 0∙02 mm day-1 for those of 100 mm or more collected in 1974 and 1976 (Fig. 5). The growth rate was closely related to size in the 1976 Monkey Bay series but was less apparent in the others. A straight line could be fitted equally well to them, and was indeed done so on two occasions.
Previous estimates of Engraulicypris growth, based on daily rings in the astericus, were around 0.4 mm day-1 (FAO, 1982) which was about twice the rate observed in this study (from the astericus). The FAO study also gives two growth rate estimates derived from the sagittae; their Table 5.1 (p. 90) gives a growth rate of 0∙5–1∙7 mm day-1 whilst their Table 5.3 (p. 91) gives a rate of 0∙2–0∙7 mm day- 1. The situation is further complicated by their statement “for a 6-month old Usipa, we counted 180 rings/mm near the nucleus of the sagittae, but at the edge of the otolith there was a density of 480 rings/mm” (p. 87). These ring densities correspond to ring widths of 5 μm and 2μm respectively, which lie within the range of widths given earlier for “coarse” and “fine” rings. It is possible that they counted a mixture of these ring types in the sagittae, which may explain why the growth rates they obtained from sagittae were faster than those from asterici, or from those obtained from asterici or fine rings on the sagittae in the present study.
The growth rates obtained from the length-frequency data have been recorded in two previous studies. FAO (1982) followed an Nkhata Bay cohort from May to September 1979 during which time the fish grew from about 50 to 100 mm, giving an average growth rate of 0∙42 mm day-1, with a range of 0∙7–0∙27 mm day- 1 according to the fitted von Bertalanffy curve. Lewis and Tweddle (1990) followed the growth of a cohort at the Nankumba peninsula, near Monkey Bay, from 13 August 1985 to 14 January 1986. During this time the fish grew from 42 to 81 mm, giving an average growth rate of 0∙25 mm day-1. The growth rates obtained from length-frequency analysis in this study ranged from 0∙02–0∙43 mm day-1, with the slowest rates being observed in fish over about 90 mm total length.
Most of the growth rate estimates were below 0.4 mm day-1, declining to less than 0.1 mm day-1 in large fish. The exceptions are the rates derived from the “coarse” rings on the sagittae and those obtained by FAO (1982) from rings on the sagittae. The exact nature of these rings is unknown and they may be an optical artifact. It is likely that they are not deposited daily and that they caused confusion in the FAO study because a mixture of rings was probably counted.
Campana, S.E., J.A. Gagne and J. Munro, 1987. Otolith microstructure of larval herring (Clupea harengus); image or reality? Can. J. Fish. Aquat. Sci., 44: 1922–29.
Campana, S.E. and J.D. Nielson, 1985. Microstructure of fish otoliths. Can. J. Fish. Aquat. Sci., 42:1014–32.
FAO, 1982. Malawi: biological studies on the pelagic ecosystem of Lake Malawi. FI:DP/MLW/75/019 Tech. Rept., 1: 182 pp. Rome;FAO.
lles, T.D., 1960. Usipa (Engraulicypris sardella). Joint Fish. Res. Org., Ann. Rept., 9: 8–9, 17–24. Lusaka; Government Printer.
Jackson, P.B.N., T.D. lles, D. Harding and G. Fryer, 1963. Report on the survey of northern Lake Nyasa. Zomba, Nyasaland; Government Printer, 171pp.
Lewis, D.S.C. and D. Tweddle, 1990. The yield of Usipa (Engraulicypris sardella) from the Nankumba Peninsula, Lake Malawi (1985–1986). Coll. Repts Fish. Res. Malawi, Ocass. Pap. 1:57–66.
LFDA (S. Holden and M.V. Bravington), 1992. The LFDA package. Length Frequency Distribution Analysis version 3.10. User manual. London; Overseas Development Administration and MRAG Ltd.
Ntiba, M.J. and V. Jaccarini, 1988. Age and growth parameters of Siganus sutor in Kenyan marine waters, derived from numbers of otolith microbands and fish lengths. J. Fish Biol., 33: 465–70.
Pauly, D. and G.R. Morgan (eds), 1987. Length-based methods in fisheries research. Manila; ICLARM and Kuwait; KISFR, 468 pp.
Pitcher, T.J. and P.J.B. Hart, 1990. Fisheries ecology. London; Chapman and Hall, 414pp.
Ricker, W.E., 1975. Computation and interpretation of biological statistics of fish populations. Bull. Fish. Res. Bd. Can., 191: 382pp.
Tsukamoto, K., 1988. Otolith tagging of Ayu embryos with fluorescent substances. Nippon Suisan Gakkaishi, 54: 1289–95.
Tweddle, D. and D.S.C. Lewis, 1990. The biology of Usipa (Engraulicypris sardella) in relation to fluctuations in productivity of Lake Malawi and species introductions. Coll. Repts Fish. Res. Malawi, Occas. Pap., 1: 67–72.
Table 1. Sampling details for the historical length-frequency data used to estimate
the growth of Engraulicypris sardella.
N(S) = number of samples; N(F) = number
of fish per sample; N(T) = the total number of fish measured.
| Location | Dates | N(S) | N(F) | N(T) |
| Monkey Bay | 30/01/69–06/10/69 | 20 | 117–773 | 7457 |
| 17/08/74–04/03/75 | 9 | 141–1879 | 4025 | |
| 22/01/76–10/12/77 | 38 | 169–3555 | 25954 | |
| Nkhata Bay | 16/03/56–17/01/57 | 14 | 20–4113 | 9209 |
| 12/02/57–25/05/57 | 11 | 7–1877 | 5637 | |
| 27/07/57–11/11/57 | 11 | 60–2968 | 7696 | |
| 06/01/58–31/05/58 | 12 | 14–19277 | 36039 | |
| 03/06/59–22/09/59 | 8 | 82–2335 | 5408 | |
| 21/09/60–10/03/61 | 11 | 11–989 | 2844 |
Table 2. Estimates of the von Bertalanffy growth parameters and linear growth functions for the length-frequency data collected at Monkey Bay (MB) and Nkhata Bay (NB).
| Sample | Size range(mm) | L∞ (mm) | K (day-1) | to (days) | Growth (mm day-1) |
| MB, 1969 | 15–52 | 129 | 0.0013 | 95 | 0.10–0.15 |
| MB, 1974 | 94–103 | 108 | 0.0045 | 252 | 0.02–0.06 |
| MB, 1976 | 45–107 | 113 | 0.0036 | 77 | 0.02–0.24 |
| NB, 1956 | 30–95 | 135 | 0.0026 | 62 | |
| NB, 1957* | 35–80 | 0.43 | |||
| NB, 1958* | 35–65 | 0.17 |
* these data fitted a linear relationship and so von Bertalanffy parameters could not be calculated.
 |  |
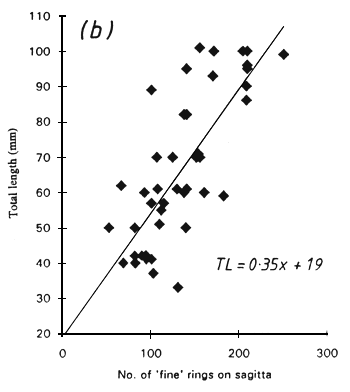 | |
Figure 1. The total length of Engraulicypris sardella in relation to (a) the number of “coarse” rings and (b) the number of “fine” rings on the sagittae and (c) the number of rings on the astericus.
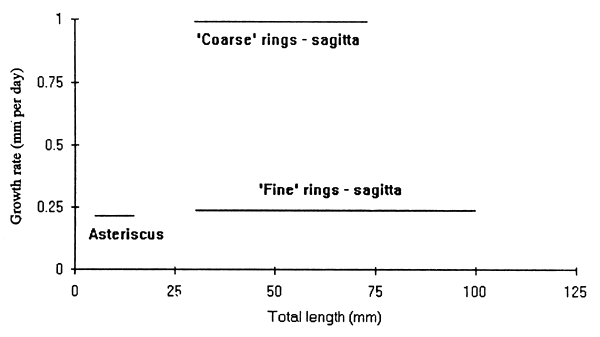
Figure 2. The growth rates of Engraulicypris sardella in relation to their total length, estimated by the number of rings on the sagittae and asterici. See text for explanation.
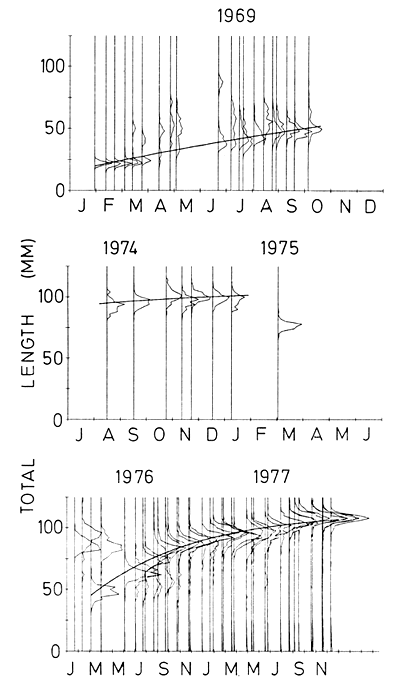
Figure 3. Length-frequency distributions of Engraulicypris sardella collected at Monkey Bay between 1969 and 1976. The vertical lines reresent the sampling dates whilst the frequencies have been scaled to arbitrary units. The growth curves have been fitted by the von Bertalanffy equation.
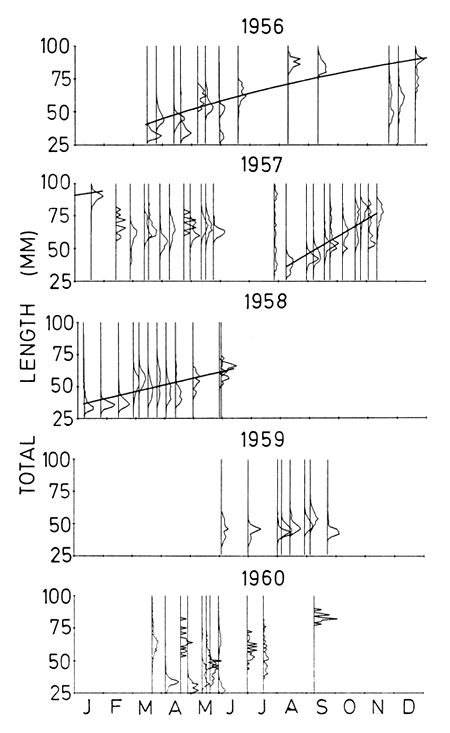
Figure 4. Length-frequency distributions of Engraulicypris sardella collected at Nkhata Bay from 1956 to 1960. The curves are either von Bertalanffy or linear fits, modes not close to the fitted line were not included in the analysis.
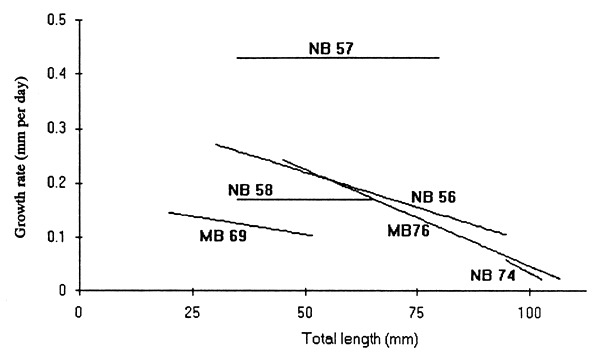
Figure 5. The growth rates of Engraulicypris sardella in relation to their total length, estimated from analysis of length-frequency distributions of fish collected ant Monkey bay (MB) and Nkhata bay (NB).