 |
 |
COMMITTEE ON COMMODITY PROBLEMS |
SUB-GROUP ON TROPICAL FRUITS |
First Session |
Pattaya, Thailand, 25-28 May 1998 |
SUPPLY AND DEMAND PROSPECTS |
1. This document presents an overview of factors affecting supply of fresh tropical fruits in major producing regions, and factors affecting demand in the major import markets. A review of demand developments for processed tropical fruits is provided in document CCP: SG TF 98/CRS.1 prepared by the International Trade Centre (UNCTAD/WTO).
2. Socio-economic factors influencing demand decisions have important implications in the formulation of production and marketing policies and strategies, and this paper attempts to discuss some of these. This document should be read in conjunction with documents CCP: SGTF 98/2 which reviews the current market situation and short-term outlook, and CCP: SGTF 98/4 which provides a quantitative assessment of medium-term demand prospects for tropical fruits. Other considerations are also important when discussing issues affecting international trade, such as the sanitary and phytosanitary framework under which trade takes place. Documents CCP: SGTF 98/6 and CCP: SGTF 98/7 deal with these issues.
3. There are three major regions that produce and export fresh tropical fruits (Charts 2 and 3); Africa, Asia, and Latin America and the Caribbean. Smaller quantities are produced in Oceania, North America, and Europe. Asia is by far the largest producing region with 4 million ha harvested in 1996 (Chart 1). It accounted for 69 percent of global tropical fruit output, but its share of the world's fresh tropical fruit exports was much lower at about 26 percent. The bulk of output in Asia is consumed domestically, and policies in the main exporting countries favour value-added industries. Asia accounts for over 85 percent of world exports of processed tropical fruit (85 percent of processed pineapples and 98 percent of processed mangoes). Although the Latin America and Caribbean region accounted for only 20 percent of global production, a harvested area of 821 000 ha in 1996, its share of the world's fresh tropical fruit exports was 38 percent. Africa with 9 percent of the world's output from a harvested area of 636 000 ha in 1996, accounted for 15 percent of fresh fruit exports. Moreover, most of the balance of processed tropical fruits exported globally is accounted for by Africa. Exports of processed tropical fruits from Latin America and the Caribbean to world markets are not significant.
4. In Asia, production and trade of tropical fruits are well established. They play an important role in national nutrition, particularly in Southeast Asia, and have contributed to achieving self-sufficiency objectives of governments (as well as providing substitutes for temperate fruit imports). Tropical fruits have been considered ideal diversification crops, particularly for smallholders. The region leads in varietal selection and breeding activities, particularly for the "lower volume" traded tropical fruits such as lychees, longans, rambutan, durian etc., and in recent years processing technology has advanced significantly, contributing to the region's dominance in the production and trade of processed tropical fruits. Finally, with the recent currency devaluation in certain Southeast Asian countries and reductions in freight rates to Europe, tropical fruit exports (both fresh and processed) from this region are expected to increase.
5. Tropical fruit production and trade in Latin America and the Caribbean is relatively well developed. Also in this region, tropical fruits are increasingly being used for diversification. The major difference with Asia is that the region specializes in the export of fresh tropical fruits. Processing is a very young industry which could develop with the expansion in production of fruit for export. The development of the tropical fruit industry in the region is likely to benefit from the existence of the highly developed banana industry, as many of the companies involved are the same. In their quest for premium quality products at competitive prices, production and marketing activities carried out by these companies are vertically integrated, with maximum control maintained from farm to shelf.
6. Africa has a less well developed production and marketing infrastructure for tropical fruits, mainly because of the economic difficulties of the 1980s and early 1990s. However, recently, stronger growth rates have stimulated investment in agriculture. Diversification into tropical fruit for exports, value-added processing (Africa is the second largest exporting region for processed pineapples and mangoes), and the building and upgrading of production and marketing infrastructure on all areas which have benefited from the improved economic environment.
7. However, smallholders have found the call for diversification very difficult to answer. Factors affecting their ability to produce premium quality tropical fruits in significant volumes include high input costs (particularly for fertilisers and agro-chemicals), and high freight rates due to the lack of suitable transport and transportation infrastructure to facilitate both domestic and export marketing, add to an already relatively high cost of production. Moreover, when small-holders receive cash advances from large production or exporting companies, the advance is often at the cost of lower farm-gate prices. To promote a dynamic future for tropical fruits in Africa, steps need to be taken to ensure the competitiveness and efficiency of the fruit production sector.
8. The three major import markets for fresh tropical fruits are the European Community, the United States, and Japan. Together, these markets account for more than 75 percent of world fresh tropical fruits imports, with the EC being the largest import market, both in terms of total and per caput import volumes, followed by the United States, and Japan (Chart 4). The recent trend is for an expansion in import volumes with the growth in consumer awareness, per caput GDP increases, and rising demand by recent immigrants.
9. Studies1 estimate elasticity (own-price, cross-price, and income) for the three major fresh tropical fruits traded (mangoes, avocados, and papayas) indicate that consumers in all three markets react quite strongly to changes in prices of these fruits. On the contrary, for fruits with smaller volumes (mangosteens, longans, lychees etc.), consumption was price inelastic in most markets. Similarly, substitution and income effects of the fruits were significant. The factors affecting consumption in the individual markets are summarized below.
10. The per caput import of tropical fruits in the EC is 1.83 kg, which compares with apparent per caput consumption levels of 9 kg for bananas and 19 kg for apples.
a) Prices
11. As mentioned above, consumer purchases are responsive to changes in prices of the individual tropical fruit, as well as the price of the tropical fruit compared to other fruits. Estimated own price and cross-price elasticities in the EC for avocados, mangoes and papayas are shown on Table 1. Of the three fruits, papaya was the most responsive to a change in its own price (own price elasticity of -2.73), and also its price compared to other fruits (cross-price elasticity of 1.92), i.e., as the price of papaya decreases, demand for the fruit increases substantially; and if the price of papaya increases relative to other fruit, demand for the other fruit decreases.
b) Incomes
12. It is usually expected that income elasticities for most fresh fruits are greater than units. In the EC, the demand response to an increase in income is strong for avocados and mangoes but not for papayas (Table 1).
c) Seasonality
13. Consumption of tropical fruits is highest during the holidays , although the increasing availability of tropical fruits on a year-round basis has promoted consumption throughout the year.
d) Distribution
14. The largest importing countries in the EC are France, Germany, the Netherlands, and the United Kingdom. Belgium also imports sizeable quantities of pineapples and with the Netherlands, is important as an entry point and a re-exporting centre (intra-EC trade of tropical fruits in 1996 amounted to 55 percent of total imports).
15. Large retail chains are prominent in the distribution of tropical fruits in Europe. In France, hypermarkets and supermarkets together accounted for around 70 percent of sales in 1995 (Table 2). The dominance of large-scale retailing is stronger for tropical fruits than for most other fresh fruits (only 58 percent of temperate fruit sales in France in 1995 were through supermarkets). The marketing of tropical fruits requires more advertising and stronger organization and logistics than the marketing of temperate climate fruits, as in many cases the former are relatively new to consumers.
e) Demographics
16. Consumer research indicates that in the EC, consumers that are the most likely to purchase tropical fruits were generally aged between 30 and 58 years, and usually housewives. The younger and older age-groups were less likely to purchase tropical fruits.
17. The per caput import of tropical fruits by the United States is 1.64 kg (Chart 5). However, it should be noted that 59 percent of consumption is sourced from domestic production (Chart 6). The per caput consumption of bananas and apples are about 11 kg and 15 kg, respectively.
a) Prices
18. Consumer response to prices in the United States was different from other markets. Own-price elasticities were much lower for papayas (-0.07) indicating that reaction to price increases would be more modest than to avocados (-1.48). Cross-price elasticities for mangoes were surprisingly high at 5.59, indicating perhaps a problem with missing variables during the estimation (Table 1).
b) Incomes
19. As expected, the income effect was low for papayas and highest for avocados, with mangoes in between (Table 1).
c) Distribution
20. The distribution system in the United States, like that in the EC, is highly integrated. Generally, the same marketing channels for bananas are used for the distribution of tropical fruits. The trend in the last 5 years has been towards direct sales from grower/exporter to large retail chains, cutting out the intermediaries. Therefore, successful marketing is becoming increasingly dependent on building strategic alliances with major distribution firms. This is particularly challenging to producers of minor tropical fruits where low volumes are typical.
d) Demographics
21. Health consciousness has been an important factor enhancing fruit consumption in the United States, and tropical fruits (especially the major 4) have begun to reap the benefits as consumer awareness expands. In addition, the novelty effect has played a role in the younger, higher income bracket segment of the population. The population of the United States, was estimated at almost 270 million in 1996, and consumer research has shown that the highest per caput consumption occurs with the 25 to 55 years age group.
22. The per caput import of tropical fruits in the Japan is 0.92 kg, which compares with apparent per caput consumption levels of 4 kg for bananas and 5 kg for apples.
a) Prices
23. Own price elasticities suggest that demand for avocados, mangoes and papayas are highly sensitive to price changes, particularly papayas (-2.95). Of the three major markets, the Japanese market shows the lowest cross-price effects, indicating that these fruits have few substitutes (Table 1).
b) Incomes
24. The income effect is highest for mangoes and lowest for papayas. Similar results were observed for papayas in all three markets. However, for avocados and mangoes, the demand response to increases in income differed for the three markets. The demand response for mangoes was highest in Japan while in the United States it was avocado, and in the EC, the effect was similar for mangoes and avocados.
c) Seasonality
25. Although tropical fruits are available on a year-round basis, consumption is highest during the holidays (gift-giving seasons in July/August and December/January).
d) Distribution
26. The bulk of fresh fruit imported into Japan is handled by major importers. Roughly half of imported fruits goes to wholesale markets, and the other half goes mainly to commission agents and supermarkets. Besides the quantities imported by importers, a certain amount of fresh fruit are imported by supermarkets directly from abroad.
e) Demographics
27. In Japan, the younger generation consumes less fresh fruit (tropical or otherwise) than the rest of the population. Comparing per caput consumption of fresh fruit by age-groups, data from the Ministry of Agriculture indicate that of the total fruits consumed, about 60 percent is consumed by the 35 to 39 and 55 to 59 years age groups. The 25 to 29 years and 45 to 49 years consume almost 40 percent of the quantities consumed by the above age groups, and the balance by the other age groups.
28. The major constraints to increased trade in tropical fruits are related to growth in demand, as supply is deemed sufficient to meet current and future needs. However, to promote a dynamic future for tropical fruits, particularly in Africa, production has to be better organized, not only for the improvement of quality, but also to ensure competitiveness and efficiency of fruit production. On the demand side, other than economic factors, the improvement of packaging, transportation, and market promotion are specific requirements for the expansion of markets for tropical fruits. In addition, exporters need to create strategic alliances to ensure the acceptance, wide diffusion and efficient distribution of their products.
Chart 1 - Harvested Area of Tropical Fruits in 1996, by Region ('000 Ha)
| AFRICA | 636 |
| N. AMERICA | 35 |
| ASIA | 4,134 |
| EUROPE | 21 |
| LAT. AM. & CAR. | 821 |
| OCEANIA | 24 |
| WORLD TOTAL | 5,672 |
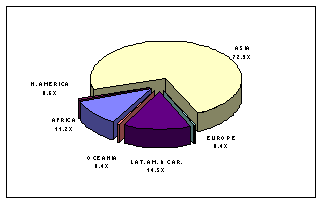
Chart 2 - Production of Tropical Fruits in 1996, by Region ('000MT)
| AFRICA | 5,214 |
| N. AMERICA | 508 |
| ASIA | 38,709 |
| EUROPE | 79 |
| LAT. AM. & CAR. | 11,253 |
| OCEANIA | 280 |
| WORLD TOTAL | 56,043 |
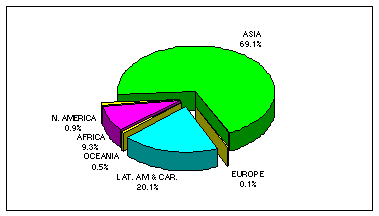
Chart 3 - Exports of Fresh Tropical Fruits in 1996, by Region ('000 MT)
| AFRICA | 276 |
| N. AMERICA | 73 |
| ASIA | 462 |
| EUROPE (*) | 283 |
| LAT. AM. & CAR. | 690 |
| OCEANIA | 17 |
| WORLD TOTAL | 1,801 |
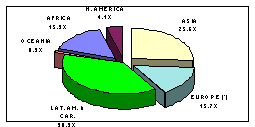
Chart 4 - Imports of Fresh Tropical Fruits in 1996 ('000 MT)
| EC (15) | 698 |
| UNITED STATES | 389 |
| JAPAN | 119 |
| OTHERS | 469 |
| WORLD TOTAL | 1675 |
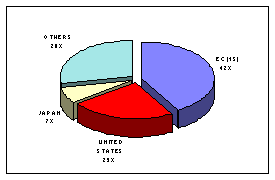
Chart 5 - Per Caput Imports of Fresh Tropical Fruits in 1996 in Selected Markets (kg/head/year)
| EC (15) | 1.83 |
| UNITED STATES | 1.44 |
| JAPAN | 0.92 |
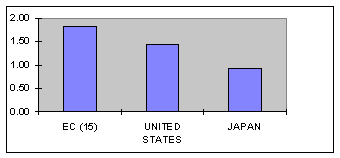
Chart 6 - Consumption of FreshTropical Fruits in United States in 1996, by origin
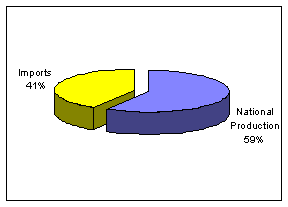
Table 1
| Estimated Own-Price, Cross-Price and Income Elasticities | ||||
| for the EC's Import Demand | ||||
| Avocados | Own-price | Cross-Price | Income | |
| Mangoes | -2.58 | 1.07 | 1.74 | |
| Papayas | -2.49 | 1.78 | 1.73 | |
| -2.73 | 1.92 | 0.66 | ||
| Estimated Own-Price, Cross-Price and Income Elasticities | ||||
| for the United States Import Demand | ||||
| Avocados | Own-price | Cross-Price | Income | |
| Mangoes | -1.48 | 0.34 | 3.23 | |
| Papayas | -0.74 | 5.59 | 1.39 | |
| -0.07 | 2.20 | 0.91 | ||
| Estimated Own-Price, Cross-Price and Income Elasticities | ||||
| for Japan's Import Demand | ||||
| Avocados | Own-price | Cross-Price | Income | |
| Mangoes | -2.01 | 0.20 | 1.22 | |
| Papayas | -1.41 | 0.34 | 3.23 | |
| -2.95 | 0.95 | 0.4 | ||
Table 2 - Shares of Different Distribution Channels of Tropical Fruits Sales, France 1995
| Hyper-market | Super market | Open Air Markets | Fruit and Vegetable Stores | Others |
| 33% | 37.3% | 14% | 5.9% | 9.8% |
Source: FLD/CTIFL
1 Document CCP:CI 96/6, "Review of Policy Developments Affecting Banana Trade" and "Prospects for Non-Traditional Agricultural Commodities," S.Koroma , ESC, FAO 1997.