| Regular Programme | US$ `000 | |
| Appropriation | 21 698 | |
| Expenditure | 20 179 | |
| Over/(Under) Spending, US$ `000 | (1 519) | |
| Over/(Under) Spending, % | (7%) | |
| Field Programme | US$ `000 | |
| Extra-Budgetary TF and UNDP Delivery | 1 620 | |
| Extra-Budgetary Emergency Project Delivery | ||
| TCP and SPFS Delivery | 245 | |
| Total Field Programme Delivery | 1 865 | |
| Ratio of Field to Regular Programme | 0.1 | |
| Technical Support Services, Prof. Staff Cost | ||
| Technical Support Services, % of delivery |
Achievements
272. The Major Programme continued to assist developing countries and countries in transition by providing a range of investment-related services. Most resources were concentrated on helping countries to formulate investment projects to attract funding from multilateral lending institutions lending for agriculture and rural development. The investment support services to Member Nations are carried out by the Investment Centre Division (TCI) in close cooperation with a wide range of financing institutions including the World Bank, IFAD, the Regional Development Banks, the European Bank for Reconstruction and Development (EBRD), the United Nations Capital Development Fund (UNCDF) and sub-regional development banks.
273. The Major Programme encompasses Programme 3.2.1: FAO/World Bank Cooperative Programme (CP), which prepares projects for financing by the World Bank/International Development Association (IDA), and Programme 3.2.2: Investment Support Programme (ISP), which helps countries formulate projects for funding by all other associated financing institutions. Under current arrangements, 75 percent of the costs of the assistance provided by FAO through the CP are paid by the World Bank, while missions carried out through the ISP are partly reimbursed under specific cost-sharing agreements with the institutions concerned. For the purposes of reporting on achievements the two programmes are considered together.
274. An increase in the number of Investment Centre-assisted projects approved for financing was recorded in 1996-97, mainly as the result of increases in the approval of projects by the World Bank and Regional Banks (see Table 3.2-1). In 1996-97, a total of 86 projects were approved for financing, in comparison to 55 in 1994-95. Total investments exceeded US$ 5 billion in both 1994-95 and 1996-97 with a steady growth in external financing, as indicated in Chart 3.2-1.
| World Bank | IFAD | Regional Development Banks | UNCDF | Other | Total | |
| Number of Projects | ||||||
| 1992-93 | 32 | 17 | 12 | 10 | 3 | 74 |
| 1994-95 | 29 | 20 | 2 | 0 | 4 | 55 |
| 1996-97 | 44 | 19 | 13 | 1 | 9 | 86 |
| External Finance, US$ '000 | ||||||
| 1992-93 | 2 149 600 | 300 440 | 244 650 | 42 440 | 118 570 | 2 855 700 |
| 1994-95 | 2 697 910 | 306 510 | 78 800 | 0 | 36 210 | 3 119 430 |
| 1996-97 | 2 506 660 | 356 770 | 457 090 | 5 550 | 69 480 | 3 395 550 |
| Government Funds, US$ '000 | ||||||
| 1992-93 | 1 282 070 | 137 750 | 36 850 | 7 970 | 29 380 | 1 494 020 |
| 1994-95 | 2 089 690 | 137 050 | 118 350 | 0 | 11 480 | 2 356 570 |
| 1996-97 | 1 401 110 | 246 860 | 164 750 | 420 | 51 170 | 1 864 310 |
| Total Investment, US$ '000 | ||||||
| 1992-93 | 3 431 670 | 438 190 | 281 500 | 50 410 | 147 950 | 4 349 720 |
| 1994-95 | 4 787 600 | 443 560 | 197 150 | 0 | 47 690 | 5 476 000 |
| 1996-97 | 3 907 770 | 603 630 | 621 840 | 5 970 | 120 650 | 5 259 860 |
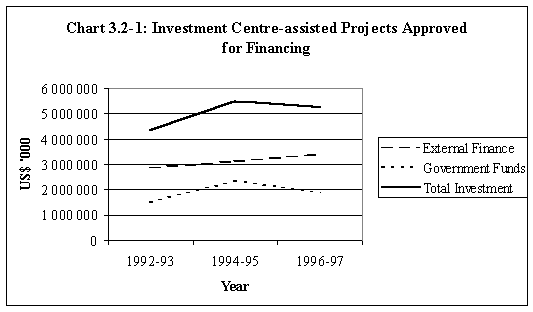
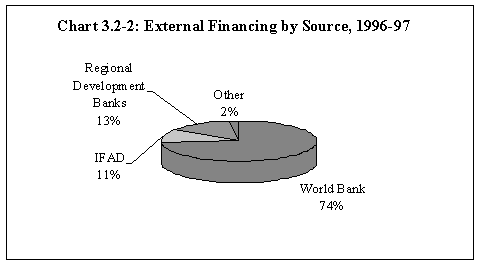
275. The external financing by source of funds for 1996-97 is shown in Chart 3.2-2. The proportion of project budgets financed from external sources has remained relatively stable, being 65 percent in 1992-93 and 1996-97 and 57 percent in 1994-95. Similarly, the share of the World Bank within the total external financing has remained at about 75 percent.
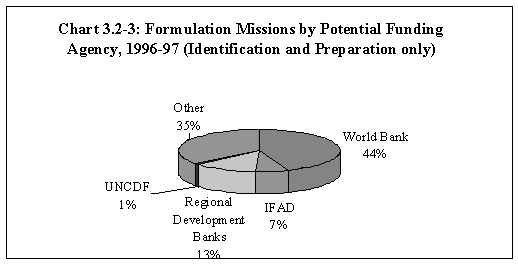
276. The conventional staged approach to investment projects, with its distinctive phases of identification, preparation and appraisal, is giving way to a more continuous process through which a project moves from an initial idea to an approved financial package. At the same time, with the growth in national project preparation capacities, the frequency with which the Investment Centre assumes full responsibility for project preparation is diminishing. Instead, more resources are used in backstopping national preparation teams, requiring shorter, smaller and more frequent missions. As a result, the number of missions rose dramatically from 548 in 1992-93 to 903 in 1996-97, as shown in Table 3.2-2. The distribution of missions by potential funding source is shown in Chart 3.2-3.
| Sub-Sector Analysis | Project Identification | Project Preparation | Assessment of Project Results | Other, Appraisal and Supervision | Total | |
| Number of Missions | ||||||
| 1992-93 | 49 | 99 | 265 | 58 | 77 | 548 |
| 1994-95 | 45 | 103 | 324 | 71 | 135 | 678 |
| 1996-97 | 61 | 163 | 322 | 60 | 297 | 903 |
| Number of Person Days | ||||||
| 1992-93 | 3 534 | 7 411 | 28 012 | 4 125 | 3 152 | 46 234 |
| 1994-95 | 2 105 | 5 924 | 25 590 | 4 160 | 3 775 | 41 554 |
| 1996-97 | 2 844 | 5 826 | 20 770 | 3 361 | 14 834 | 47 635 |
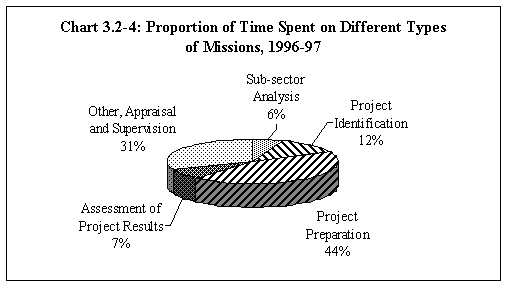
277. The range of services offered by the Investment Centre was broadened, including support to the SPFS. This explains the sharp increase under the "project preparation" and "other" categories in Table 3.2-2 and illustrates the need to move away from the number of projects formulated as the main measure of performance. The number of investment projects for which formulation was completed, as shown in Table 3.2-3, declined from 96 projects in 1992-93 to 64 in 1996-97. This reflected the greater reliance of countries on their own resources for project formulation, greater emphasis on assisting national efforts and delegating work to national teams, more frequent formal collaboration with NGOs, and the attention given to the SPFS. The proportion of time spent on different types of missions in 1996-97 is shown in Chart 3.2.4.
| World Bank | IFAD | Regional Development Banks | UNCDF | Other | Total | |
| 1992-93 | 49 | 27 | 20 | 6 | 4 | 96 |
| 1994-95 | 45 | 25 | 18 | 0 | 7 | 95 |
| 1996-97 | 36 | 12 | 12 | 1 | 3 | 64 |
278. Project design methodology was adapted to the changing priorities of countries and the requirements of financing institutions. Particular attention was given to promoting the fuller participation of beneficiaries in both the identification and implementation of projects with the aim of improving project relevance, impact and sustainability. There was also increased focus on assessing the environmental impact of projects. The main areas in which projects were formulated were: natural resources management, including forestry development, provision of improved agricultural inputs and services, soil conservation and optimizing the use of water resources, including through irrigation schemes. In addition, a growing number of projects had important privatization, as well as private sector development components.
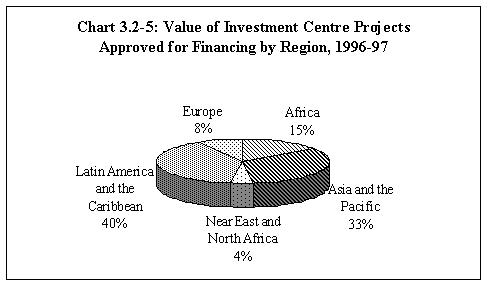
279. There was a significant change in the regional distribution of projects approved for financing in 1996-97, as shown in Table 3.2-4. In terms of percentage of the total, projects in the Africa Region accounted for 36 percent of the projects approved in 1996-97, compared with 50 percent in 1992-93. The share of the Near East and North Africa also declined from 12 to 6 percent. In contrast, the share of Latin America and the Caribbean increased from 12 to 24 percent. The resources approved showed a similar change with Africa declining from 21 percent in 1992-93 to 15 percent in 1996-97, the Near East and North Africa declining from 16 percent to 4 percent and Latin America and the Caribbean increasing from 22 percent to 40 percent. The distribution of investment by region in 1996-97 is shown in Chart 3.2-5.
| Africa | Asia and the Pacific | Near East and North Africa | Latin America and the Caribbean | Europe | Total | |
| Number of Projects | ||||||
| 1992-93 | 37 | 17 | 9 | 9 | 2 | 74 |
| 1994-95 | 24 | 12 | 6 | 10 | 3 | 55 |
| 1996-97 | 31 | 16 | 5 | 21 | 13 | 86 |
| External Finance, US$ `000 | ||||||
| 1992-93 | 599 370 | 911 780 | 459 650 | 641 000 | 243 900 | 2 855 700 |
| 1994-95 | 449 600 | 1 531 900 | 394 230 | 640 600 | 103 100 | 3 119 430 |
| 1996-97 | 524 270 | 1 115 460 | 137 170 | 1 340 650 | 278 000 | 3 395 550 |
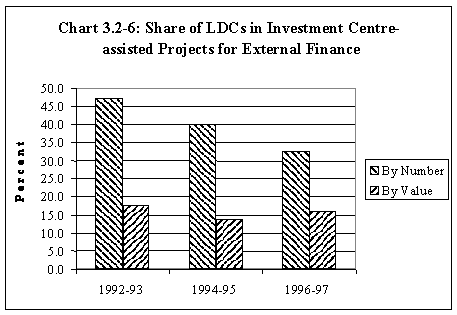
280. The share of Least Developed Countries (LDCs) in external financing has tended to remain relatively steady, while there has been a steady decline in the number of projects (Chart 3.2.6), largely reflecting the fall in funding approved for Africa. In this regard, projects in the LDCs, particularly those in Africa, were generally smaller than projects in Latin America and the Caribbean and Europe.
Investment Centre Contribution to
Decentralized Rural Development
|