![]()
![]()
![]()
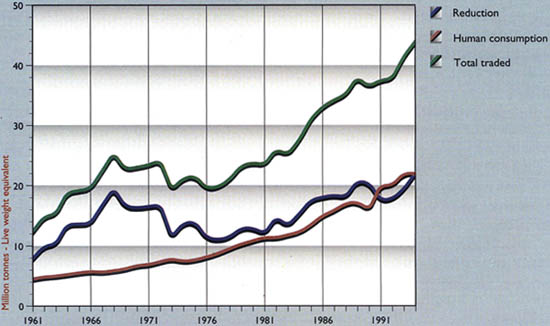
Figure 18 shows the trends in total fish trade since 1961 according to end use. The total quantity of fish traded has increased from about 13 million tonnes live weight equivalent in 1961 to about 43 million tonnes in 1994, always ranging between 30 and 40% of the total landings. The increase in the value of the world trade in fish and fishery products is increasingly being driven by the demands of developed countries for higher value species and the ability of developing countries to provide them. The trade deficit (net imports) of developed countries increased from US$ 3060 million in 1977 to 6417 million in 1985 and 19000 million in 1994. During the same time, the trade surplus (net exports) of developing countries increased from US$ 2434 million to US$ 5007 and US$ 14,000 respectively. Figure 18 also shows that in the 1960s the quantities of fish traded for non-food use (following reduction into fish meal and oil) far exceeded the quantities traded for human consumption, accounting for about 80% of the total fish traded (all expressed as live-weight equivalent). The difference subsequently declined markedly as food fish trade grew, and since the 1980s the quantities traded for human consumption and for non-food use have been fairly similar.
Figure 18. Traded quantities of world fish landings for human consumption and reduction
Figure 19 shows the total quantities of fish destined for reduction for fish meal and other non-food uses, with the contribution of various species which are almost entirely or exclusively utilised for non-food purposes. The figure shows this contribution by major fish species and includes a category “unidentified”. These quantities were derived as follows. The total landings for reduction (in live-weight equivalent) were calculated based on the quantities of fish meal produced, using standard conversion factors. Then, the landings of species which are known to be entirely or almost entirely utilised for fish meal were accounted for. The residual quantities are those not accounted for by landings of such species and are labelled in Figure 19 as “unidentified” species. The most notable feature is the highly variable species composition of landings destined for conversion to fish meal which is determined mainly by the availability of these highly fluctuating small pelagic stocks which support opportunistic fisheries subject to “boom and bust” cycles. There has clearly been an overall increase in fishing effort directed towards fish for reduction with the development of several new fisheries entirely for this purpose such as those for Chilean jack mackerel and sandeels.
Figure 19. Species composition of landings destined for reduction
By far the most important product of fish reduction is fish meal which is used in the production of animal feeds for livestock and aquaculture. Fish meal is usually considered as a substitute for soybean meal but it fetches a higher price due mainly to its richer protein content (64% protein compared to 44% for soybean meal) and its particular amino acid and fatty acid profiles, and so is now more a complement to soybean meal. Nevertheless, prices of fish and soybean meals have shown similar trends in the past (Figure 20) and are statistically correlated. Given that soybean meal production is much greater than fishmeal production, it is usually assumed that the price of fishmeal would be determined mainly by the price for soybean meal on the world market. This assumption that fishmeal is a “price taker” implies that there should be no supply/price relationship for fishmeal and that fish meal prices should be independent from supplies. The following shows that this assumption may not be entirely correct.
Figure 21 shows the supply of fish for reduction plotted against the price of fish meal and it appears that the relation has changed since 1950. The figure shows that three different relationships can be identified corresponding to 1950-64, 1965-72, 1973-93. Linear regression was undertaken for each period and showed increases in both the intercept and slope between successive time periods (Table 3). This indicates that the demand is becoming increasingly inelastic, and that prices are reacting more to variations in supply.
Figure 21. Relationship between deflated fish meal price and quantity of fish destined for reduction
Table 3: Results of linear regressions of deflated fish meal price (US$/tonne) on landings for reduction (million tonnes) for three time periods.
|
Period |
Slope |
Intercept |
Significance (P=) |
|
1950-1964 |
-10.5 |
446 |
0.003 |
|
1965-1972 |
-21.1 |
852 |
0.007 |
|
1973-1993 |
-23.2 |
1113 |
0.0003 |
In 1993, aquaculture feeds used 16% and 29% of the world production of fish meal and fish oil respectively and Tacon (in prep.) has estimated that, by the year 2000, aquaculture will use 25-30% of the world’s fish meal supply. With the rapid growth in aquaculture production of valuable carnivorous species which at present is totally dependent on the use of fish meal and fish oil as the major source of dietary protein and lipids with compounded feeds comprising 50-70% fish meal and oil (Tacon 1995), the demand for fish meal may increase. However, other sectors of the fishmeal market such as poultry and pig growing and finishing diets, which account for a much greater share of the market, are still very elastic and could switch away from fish meal (Ian H. Pike, pers. comm.; Barlow and Pike (1994)). Thus the price of fish meal may increase further, although not dramatically.
The increase in slope and intercept values may indicate that a fish-meal market has been developing rapidly, independent of the market for soya bean meal, possibly supported by the development of aquaculture, particularly in Asia and especially in China. If the supply/demand relationship becomes even less inelastic with increasing demands for aquaculture but without reduced demand from agriculture (which may be unlikely), two counter-acting phenomena could happen. On the one hand, as prices offered for fish meal species (sometimes also used for food by poor coastal communities) increase, requirements of aquaculture for small pelagic resources and low value demersal species could start competing seriously with poor people in the developing world. On the other hand, improved handling and utilisation for human food would probably also increase the price of species used up to now for fish meal. In either case, however, it is likely that the poorest people will encounter greater difficulty in satisfying their demand for food-fish.
![]()
![]()
![]()