![]()
![]()
![]()
ABSTRACT
The aquarium export fishery started in 1979 exporting mainly to Sri Lanka at the time. At present the fishery is centered around the International Airport where the fish are air freighted to Sri Lanka, Europe, USA and the Far East. In 1994 more than 300,000 fish were exported earning more than MRf. 7 million. About 100 species of fish are now being exported, with 20 species comprising over 75% of the trade. Some of the species exported are very rare in the Maldives and are very vulnerable to overexploitation. The fishery is reviewed and management issues are discussed. The options for monitoring and regulations are also discussed.
1. INTRODUCTION
The aquarium fishery appears to have started in 1979, mainly exporting to Sri Lanka at the time. At present there are 17 licensed exporters. More than 100 species of fish are being exported, which includes species that are very rare in the Maldives and are very vulnerable to over exploitation. The tourism and fishing industries provide perhaps more than 70% of the total government revenue, and both depend heavily on coral reefs. Tourism which is the most important source of foreign exchange earnings has a major attraction for the coral reefs and its associated colourful fishes which are exported in the aquarium fish trade. The pole and line tuna fishery, which exploits surface swimming tunas requires a daily supply of livebait fish, some of which are exploited in the aquarium fish trade.
Since its inception, the aquarium fish trade has been monitored by the Government. Exporters are required to have an export license issued from the Ministry of Trade and Industries. Export statistics are collected by the Customs and compiled by Ministry of Fisheries and Agriculture. Based on a study carried out by Edwards (1988) blanket quota of 100,000 fish were set for 1988 and 1989 by the Ministry of Fisheries. However, the quota seems to have not been implemented effectively. A species based quota was also set for certain species that were thought to be subjected to local over exploitation or were close to maximum sustainable level of exploitation at the time. Although these quotas were in place since 1988, they were not being properly reviewed and the quotas were not adequately implemented, largely due to lack of coordination among the responsible authorities.
The aquarium fish industry has expanded during recent years and companies have started to spread out around Malé and even to nearby atolls. Conflicts between tourist dive operators and collectors often arise when collectors collect aquarium fish from popular boat dive sites. Until June 1995 aquarium fish could be collected from any reef except from the tourist resort "house reefs". Aquarium fish collection is now also prohibited from the 15 protected marine areas proclaimed in June 1995.
2. STATUS OF THE TRADE
Even though there are 17 licensed companies in the export business a great majority of the aquarium fish are exported by only two companies. In 1993 these two companies exported about 60% of the aquarium fish and earned over 70% of the total revenue (Adam, 1995).
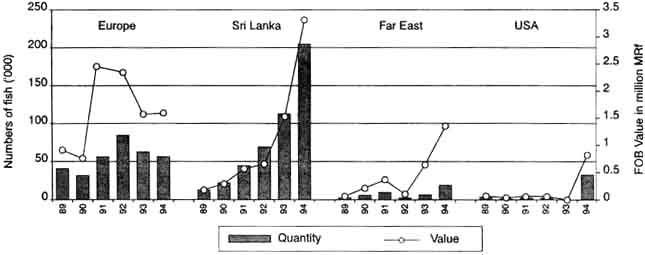
Relatively few people are employed in the aquarium fish export business. The majority of the work force are Sri Lankan expatriates working mainly as divers. It is estimated that at present about 80-100 people are employed in this industry. These include fish collectors, boat handlers, aquarium staff and managerial staff. From an economic point view aquarium fish exports accounts about 1.6% of the total marine export value at present (see Table 1). The value of aquarium fish exported in 1994 was 7.03 million Rufiyaa. In 1994 major exports were to Sri Lanka (65.2%) followed by Europe (17.4%), USA (10.6%) and the Far East (6.4%) (see Fig. 2 and Table 6). Exports to Sri Lanka are mostly re-exported to more lucrative markets of Europe, American and Far East, to which there are good flight connections.
2.2. Recent Trends in the Trade
The quantity offish exports has risen steadily since 1980 except for the late 1980's. The decline in the export in these years could be due to the political problems in Sri Lanka which may have made it difficult for easy export to Sri Lanka. From 1980 to 1994 a seven fold increase in the quantity of fish exported and 45 fold increase in the export value has occurred (Table 1 and Figure 1). In 1994 a record level of 312,483 fish were exported which was about 70% more than the amount in 1993. It is expected that more than 400,000 fish will be exported in 1995.
At the start of the business in the early 1980's exports were mainly to Sri Lanka. Edwards and Shepherd (1992) noted that from 1983-1986 about 83% of the fish were exported to Sri Lanka followed by Europe (13.3%) and small numbers were also exported to USA, Japan and Singapore. Maldives now exports to more than 20 countries around the world but the majority of countries take less than 1% of the total. The most important markets are Sri Lanka, UK, Netherlands, Germany, Belgium, Japan and USA. Figure 2 gives a year-wise breakdown of the quantity exported and their FOB values to major destinations for 1989-1994. Table 6 and 7 give country-wise breakdown of the quantity exported and their values for 1989-1994.
Unlike the situation in mid 1980's, it appears that the situation had changed in the late 1980's. In 1989 the majority of fish were exported to Europe (70.12%) earning about 80% of the total value. From 1989-1994, even though the annual quantity exported to Europe increased (largely due to increase in the volume exported by the companies), the quantity in terms of percentage however, have declined. Figures for Sri Lanka shows a dramatic increase in 1993 and in 1994 (Fig. 1 and Tables 5 and 6). The explanation for this rapid increase could be recent increase of new comers to the business who are exporting mainly to the easily accessible Sri Lankan market. In recent years the USA and Far Eastern markets have become important destinations. In 1994, 33,023 fish were exported to USA alone (10.6% of total) earning MRf. 831,341 (11.8%).
The unit prices for aquarium fish exports by major destinations for 1989-1994 are given in Table 2. The average unit price per fish offered for European markets were in the range of MRf. 25- 44, the highest were during 1991 with an average of MRf. 43.76. Average prices for Sri Lanka remained more or less same throughout the period, but showed an increase in 1994. The highest prices offered were from the Far Eastern markets, notably by the Japanese buyers.
2.3. Methods of Collection
Aquarium fish collection, is carried out by snorkeling and using SCUBA. Most collectors are from Sri Lanka. They are often paid on piece rate basis and are employed directly by the company. Fish are normally collected using hand nets. When collection is carried out using SCUBA, each diver carries a small net (about 10cm mouth diameter) and a large net (about 50 cm in the mouth diameter). Mesh sizes may vary from 3-5 mm. Fish are driven in to which ever net is the most appropriate. As the fish are collected they are transferred to a plastic bag secured at the diver's waist. When fish are collected by snorkeling, a large plastic container is towed behind the divers to which the collected fish are transferred. The container is holed, and has a rubber tyre attached mid-container to keep it upright and afloat. More valuable fish are kept in polythene bags secured to the snorkeller's waist. Sessile organisms and invertebrates are taken by hand, if necessary being prized apart or dug out in the case of soft coral and sea anemones.
Recently some companies started using "moxy" nets, a new technique that is being introduced to the Maldives by Sri Lankan divers. This cone shaped net (more like the traditional cast net Laandhaa) is closed at the top. The bottom is about a metre or more in diameter. A float is attached on the top and lead weights are fastened around the perimeter of the base. Moxy nets are often used on shallow reef tops by snorkelers. The net is spread on top of coral heads where the fish take refuge. Fish are then chased out by banging the coral heads with a tickler stick until they are caught in the net. Fish caught using this technique are severely stressed and more often die in the first few days of capture than fish caught by hand nets. It is thought the use of this method of collection now is only minimal after the Ministry sent a circular to all exporters discouraging its use.
2.4. Holding facilities
Most holding facilities have purpose-built concrete holding tanks but a few have large plastic tanks. The tanks are piped with compressed air which is centrally connected to an electric blower. Water in the tanks are renewed weekly or as often as required depending on the numbers of fish in the tanks and quantity of through put. Most companies have semi-open systems where by overflow water is thrown out as required and replaced by fresh sea water. Operators who use complete open systems have sand filters and paper cartridges attached to the incoming pipe line to filter debris and bacteria. One company (the largest) has a modern central circulatory filtration system whereby the overflowed water from the tanks is skimmed to remove nitrogenous waste and then is filtered through an ultra violet sterilization system before the water goes to the tanks again. All the facilities have smaller glass tanks and plastic containers for keeping aggressive species in isolation. At the holding facility fish are generally not fed. They may sometimes be fed lobster eggs if they were to stay longer periods before being exported.
Recently some companies have started to extend the area of collection to nearby atolls. As a result they have started using holding cages at the out stationed collection sites. Once enough fish are collected, they are packed and brought back to the central holding facility (located close to airport) for conditioning before being exported. These cages which are framed in PVC pipes (2.5" and 1.5" dia.) are about 10'x5'x5' in size, rigged with plastic netting. The air tight PVC piping help the cages to keep afloat.
Conditioning of fish at the holding facilities prior to export is a general practice carried out by all exporters. Most companies collect fish to meet a specific requirement for a client. Few companies collect fish routinely and stock them at holding facilities. The companies that do this appear to be exporting mainly to Sri Lanka where the importers have no particular preference of species.
2.5. Packaging and Exporting
Fish are starved for about 2-3 days before being exported. A small amount of fresh water is added to the packing water and chemicals may be added to tranquilize for longer journeys. Packing starts just in time for the flight. Fish are packed with oxygen and a little water singly in double polythene bags to ensure that fish are not stranded without water should one bag be holed. Polythene bags are packed in cardboard boxes for short journeys (mainly to Sri Lanka). For European and other long haul journeys they are packed in styrofoam boxes with some ice to keep the temperature down. Layers of paper may be inserted between plastic bags in the box to avoid catching sight of aggressive species. Packaging methods have improved considerably over the years mainly due to feed back from the customers and many exporters now guarantee almost 100% survival for most destinations provided that good connecting flights are available.
2.6. Species Composition in the Trade
Customs require that all export shipments have detailed packing lists, including value and destination of export. Some companies provide the detailed list of species, its quantity and value, while others provide only the number of boxes and quantity of fish in each box. In every case the exact number offish in each shipment, the destination and its value are known.
From a sample of 29 invoices picked at random from the available detailed packing lists, estimates have been made on the quantity offish exported by species for 1993 (Adam 1994). A great difficulty was faced in sorting out proper species names as companies have their own trade names. About 100 species offish and invertebrates from 23 families were exported. Commonest ones include of wrasses (Fam: Labridae, 20 species), butterflyfish (Fam: Chaetodontidae, 17 species), damselfishes (Fam: Pomacentridae, 7 species), and angelfishes (Fam: Pomacanthidae, 8 species).
Exported species are listed in Table 3 along with the number of each species in the sample of 29 packing lists and estimates of numbers (to nearest fifty) exported in 1993 and 1994. Among the 14,645 "fish" in the sample were 143 invertebrates. Most of these were sea urchins (Echinodermata: Echinoidea), starfish (Echinodermata: Asteroidea) which includes Linkia, Fromia and Culcita and sea anemones (Class Anthozoa, Radianthus and Stoichactis)
3. STOCK ASSESSMENT
Little work has been done on the biology of the aquarium fish in the Maldives. Crude estimates of potential yield for 65 species within a radius of 7 nautical miles (13 km) around Malé were made by Edwards and Shepherd (1992). They used underwater visual assessment count data from virgin fish populations to translate the abundance to maximum potential yield in a given area of reef using the equation of Gulland (1971). Their results showed that some species were locally overexploited or were close to maximum sustainable yields. Calculations of Edwards and Shepherd (1992) have been extended by Adam (1995) for North and South Malé Atolls and Vaavu Atoll based on the assumption that only 15% of the reef area is exploited by the collectors. Present levels of exploitation is no way near to the estimated amounts from these three atolls. However, as collection effort is not evenly spread out, local overexploitation may occur in some places as observed by Edwards and Shepherd (1992).
4. MANAGEMENT ISSUES
4.1. Monitoring of the Trade
From the beginning of the aquarium fish trade, the government authorities have closely monitored the levels of export. The Customs authorities collect the information from the export invoices and are sent to the Economic, Planning and Coordination Section (EPCS) of the Ministry of Fisheries and Agriculture (MOFA). The data are compiled by the EPCS and annual summaries are published in the "Basic Fisheries Statistics" booklet.
Recently MOFA has initiated a programme for strengthening the data collection system based on the studies of Edwards and Shepherd (1992) and Adam (1995). One major difficulty in getting reliable information is the lack of proper identification guides for the Customs officers and for the exporters. At present, information on species level data is poor as exporters use more than one name for several species. MRS is preparing a catalogue of the aquarium fishes which will be made available to Customs officials and exporters.
Since the beginning of the aquarium fish trade, hand nets have been used for collection of the aquarium fish. This method of collection does not appear to have a detrimental impact to the reef habitat as these nets do not get caught up in the corals. Recently, however, some companies have started using moxy nets for collection which not only damage the reef habitat but also causes heavy mortality to the captured fish. MOFA has recently issued a circular to all exporting companies informing of the destructive nature of this collection method and urging them to stop or discourage the use of such destructive method by their collectors. The response appears to have been positive as many exporters have dismissed the collectors who happen to be using these destructive methods.
4.2. Regulation of the Trade
Ministry of Trade and Industries (MTI) is the government body responsible for regulation of the export trade. MTI issues export licenses which are based on export value. These licenses are generally valid for one year and the value offish exported under the license should not exceed the export value of the license (generally in the range of 200-300 thousand Rufiyaa). The export value is determined by the exporters themselves. A nominal charge of MRf. 1/- in the form of revenue stamp is levied for each MRf. 1 000/- worth of exports. This system of licensing has been misinterpreted as an export quota by Edwards (1988) and Edwards and Shepherd (1992).
In response to the findings of a preliminary report by Edwards (1988) on the aquarium fish trade, MOFA set a blanket quota of 100,000 fish for export in 1988. At the same time a species quota was introduced based on the findings of Edwards and Shepherd (1992). However, there appear to have been no change brought to the regulatory system to enforce the 100,000 fish quota. But since then MTI have issued a list of the species subject to quota and the allocated number for export with every new license issued. In allocating the quantity of species quota, due consideration is given to the numbers of people applying for export licenses and the export volumes of the companies. Customs officials were to keep running totals of the quota species and stop any exports of that species when the allocated amount have been reached. However, that the blanket quota and the species based quota were not enforced or reviewed adequately.
To overcome the problems of data collection and timely monitoring of the trade, it has been suggested to introduce "Proforma Aquarium Fish Export Forms" and "Daily Log Forms" which have to be filled by the exporters. Proforma aquarium fish export forms will have the names of all fish species that are likely to be exported. The exporter will have to write the corresponding numbers and their prices of the fish. This will be used as the packing list. Day forms will have the information on collection sites, numbers collected, time spent on collection, etc. which are vital information to detect early symptoms of overexploitation. It is thought that these improvement on the data collection system will be introduced soon.
4.3. Potential conflicts
As a general rule it is prohibited to carry out any form of fishing on the house reefs of tourist resorts and these areas are protected from any such activities. Both tourism and aquarium fish export business require the close proximity of an international airport and therefore it is not surprising that most of the holding facilities are centered close to the airport and in the tourism zone. At present most collection occurs in north and south Malé Atolls, where the highest concentration of tourists also occurs. Conflicts occur when aquarium fish collectors happen to collect fish from a popular boat dive sites. In the recent past there have been such conflicts between dive operators and the aquarium fish collectors. It is likely this problem will be exacerbated in the future if the necessary regulatory measures are not taken now. 15 popular dive sites have been declared in June 1995 as protected marine areas, banning all forms of fishing activities except bait fishing.
Pole and line tuna fishing requires a daily supply of small reef fish which are collected from the reef. Even though the export of bait varieties are banned, one species of bait which is of minor importance is being exported in the aquarium fish trade. This is the Pomacentrid, Chromis viridis which is of minor importance as a bait (Anderson and Saleem, 1994). It is estimated about 0.5% of the total live bait requirement is of this species, which is estimated as under 100 tonnes per year (Anderson and Saleem, 1994; Anderson, 1994). 10,000 individuals collected in 1994 in the aquarium export business constitute an insignificant number compared to this quantity.
Edwards and Shepherd (1992) note five species of edible reef fish of minor importance which are also being collected by the aquarium fish exporters. These are Plectorhincus orientalis, Chelinus trilobatus, Cephalopholis miniata, Parupaneus cyclostomus and Variola louti. The amount collected by the aquarium fish collectors is very small compared to the quantity of fish species landed in Malé and therefore should not be problem.
4.4. Regulation of the Holding Facilities
Regulating the standards of the holding facilities and of standards of packing is important to ensure minimum mortality offish at holding facilities and in transport. At present there is no official requirement for a standard of the holding facilities. Preliminary findings in 1994 shows that few facilities are not adequately maintained (Adam 1995). Mortalities rates at collection and at the holding facilities are poorly known. However, interviews with the exporters and collectors indicate that at both these stages mortality may be as little as 3-5%. (Adam 1994). Compared to the mortality figures for Sri Lanka these are quite low (Wood, 1985). She estimated mortalities before arrival in the country of destination approached 25% with 15% dying at holding facilities in the country of origin and 10% dying during transport. Fortunately the fish collected from the Maldives do not require long domestic transport times as in Sri Lanka as the collecting areas and the airport are very close to the holding facility.
4.5. Endemic and Rare Species
Aquarium fish collection is a selective exploitation process of well sought after species that fetch high prices in the market. Of the 100 or so species exported in the trade, 20 species make more than 75% of the total numbers exported.
Some of the species that are being exported are quasi-endemic with only limited geographic distribution, Maldives being the centre of abundance. Therefore, these populations are extremely important reserves for maintaining biodiversity. One of the species commonly exported in the Maldives is the Clown Fish (Amphiprion nigripes) which fits well under this category. Although this species occurs in the neighboring Sri Lanka and Laccadives, it is considered rare in these areas. Anemone fish have only limited larval dispersal and as a result show the phenomenon of local endemism. For this reason anemone fish are particularly susceptible to local over exploitation. In 1994 it is estimated that about 8000 Maldives Clown Fish and about 500 anemones were exported.
There may be several other species which are rare in the Maldives which warrant strict control on numbers collected. The recently "discovered" angel fish, Apolomithchthys armitagei is also very rare in the Maldives and should be included in the species quota list. It is thought that some species of Wrasses (fam: Labridae) and Gobies (fam: Gobiidae) that are popular among the collectors are not fully described from the Maldives and therefore the extent of the distribution or abundance in Maldives are not known (R.C. Anderson, pers. comm.). One way to avoid heavy exploitation of deep sea wrasses may be to have maximum collection depth, that is to have a strict rule maximum dive depth. This may also prevent serious dive accidents that have happened in the past.
4.8. Economic Considerations
The management of the aquarium fish trade should not be taken only from a biological point of view. Economic considerations should also be taken in to account when rules and regulations are being made to manage the fishery. In 1994 the export business earned about US$ 0.67 million which is about 1.6% of the total marine exports value. It is worth noting that from 1989-1994 the value of total export earning increased 1.7% where as in the same period the value of aquarium fish export earnings increased almost 65% (Anon, 1994). The aquarium fishery in the Maldives could be expanded without potential conflict among other reef resource users. Collection areas have to be widened to include other atolls. To avoid conflict with the tourist dive operators, area restrictions can be enforced in the tourism zone.
It has been recommended that when developing and expanding the aquarium fishery, consideration should be given (together with biological and environmental points discussed) to the relatively large capital cost required to setup the holding facility, the ongoing costs of packaging and the necessity of competitive freight charges for the consignment. For the exporting companies which have invested large amounts of capital in terms of holding facilities, collecting gear and transport vessels, a restrictive quota system may discourage them. If more "small timers" were to enter the business the quota has to be distributed among all parties reducing the numbers that can be allocated for exporters with considerable capital tied up in their business. Therefore, it has been suggested that in the future, consideration may be given to licensing of the exporters and assigning designated areas for collection which could be closely monitored.
The costs of packaging are high, especially for the European markets and USA markets. Packaging requires styrofoam boxes, oxygen, high quality polythene bags which all have to be imported for re-exportation within a very short period. A sample of invoices with full information (i.e. with breakdowns of packaging and freight costs) for 1993 shows that packaging costs about 11% of the total for Sri Lanka and about 6% for Europe. However, the average packaging cost per box is about a dollar more for the European market (Table 5).
Waiving of import duties on these exported items of packaging would partly solve the high packaging cost problem. Alternatively, styrofoam box manufacturing could be started in Malé. The demand for styrofoam boxes is high at the moment as many of the reef fish exporters use them. One major Singapore manufacturer considers that this could be manufactured in the Maldives quite cheaply.
Freight cost also takes a considerable amount of the total FOB value. Average freight costs for Europe are in the range of 3 8% and that of Sri Lanka is about 21%. Exporters claim that freight charges are not very competitive due to limited choice they have. As the chartered flights which fly direct to Europe do not carry any consignments they are limited to only few air lines. It is thought that special discounted rates from the air lines may be bargained for through an Exporters Association. But it appears that freight charges will come down as more air lines start to operate and direct connections to European destinations improve.
At present about 63% of the total exports are being exported to Sri Lanka gaining only 40% of the total value. These figures are likely to go higher in the future as new exporters join the industry. The new comers often do not have access to European markets and their exports are mainly to Sri Lanka. MOFA with close collaboration with the proposed Aquarium Fish Exporters Association can play an active role in trade promotions and finding new markets (e.g. by participating in international trade fairs such as the Aquarama and Interzoo held annually). It is estimated that if the 1994 Sri Lankan exports had been exported to European markets there would have been a gain of extra 43% of the total export value.
5. SUMMARY OF RECOMMENDATIONS
Following is a summary of the recommendations that have been made by Edwards and Shepherd (1992) and Adam (1995):
1. Use of destructive methods of fish collection should be completely banned.2. The present system of value based quotas should be abolished and quotas based on numbers should be introduced.
3. Coordination between MOFA, Customs Authority and Ministry of Trade and Industry should be strengthened in order to better regulate the fishery.
4. Proforma Aquarium Fish Export Forms should be introduced as soon as possible in order to monitor the numbers of fish exported by species. This will considerably ease the burden of monitoring exports and provide systematic information on the trade.
5. Collection of rare and quasi-endemic species should be banned or controlled.
6. The present list of species subjected to quota should be reviewed urgently. The list should include rare and quasi-endemic species and species that survive poorly in aquaria.
7. Daily Log Forms of aquarium fish collection should also be introduced to obtain detailed information on collection areas, hours spent on collection etc. The data generated by this form will be vital in detecting the symptom of overexploitation at an early stage.
8. Assigning of designated areas for aquarium fish collection should be initiated in consultation with the aquarium fish exporters, MATI and relevant government authorities.
6. ACKNOWLEDGMENTS
I am grateful to Dr. Charles Anderson for his critical comments and valuable suggestions. I thank Mr. Maizan Hassan Maniku - the Director General of the Ministry of Fisheries and Agriculture for his encouragement to the study. I also thank Ms. Donna Nickerson for proofreading the final draft.
7. PREFERENCES
Adam, M.S. (1994). Report of the preliminary assessments of the status of some of the ornamental fish holding facilities. Marine Research Section, Ministry of Fisheries and Agriculture, 14pp [Unpublished].
Adam, M.S. (1995). Review of the aquarium fish trade of the Maldives with proposals for monitoring and regulation. Marine Research Section, Ministry of Fisheries and Agriculture, 29pp. [Unpublished].
Anderson, R.C. (1994). The size of the Maldivian tuna livebait fishery. Rasain 14: 208-203.
Anderson, R.C. and Saleem, M.R. (1994). Seasonal and regional variation in live bait utilization in the Maldives. Rasain 14: 182-160
Anon (1994). Fisheries Statistics 1989-1993. Economic Planning and Coordination Section, Ministry of Fisheries and Agriculture, Malé. 23 pp.
Edwards, A.J. (1988). Preliminary report on the aquarium fish export trade in the Republic of Maldives. Centre for Tropical Coastal Management Studies, University of Newcastle upon Tyne, Newcastle upon Tyne, UK. 22pp. [Unpublished].
Edwards, A.J. and Shepherd, A.D. (1992). Environmental implications of aquarium fish collection in the Maldives with proposals for regulation. Env. Conser. 19 (I): 61-72.
Gulland, J. (1971). The Fish Resources of the Oceans. Fishing News Books Ltd., West Byfleet, Surrey, England, xi + 253pp; ilust.
MPHRE (1995). Statistical Year Book of the Maldives. Ministry of Planning, Human Resources and Environment, 292pp.
MRS (1994). Executive review of the status of Maldivian fishery resources. Marine Research Section, Ministry of Fisheries and Agriculture, Malé, 25pp. [Unpublished]
MRS (1995). Executive review of the status of Maldivian fishery resources 1994-1995. Marine Research Section, Ministry of Fisheries and Agriculture, Malé. 21 pp. [Unpublished]
Wood, E. (1988). Exploitation of coral reef fishes for the aquarium trade, Marine Conservation Society, Ross on Wye, UK. 86 pp.
Table 1. Quantity of live tropical fish exported and their FOB value (1980-1994).
|
Year |
Nos. of Fish Exported |
FOB Value (MRf.) |
FOB Value (US$)* |
% Tot. Mar. Exp. Value |
|
1980 |
42,128 |
153,958 |
n/a |
0.53 |
|
1981 |
43,929 |
214,607 |
n/a |
0.78 |
|
1982 |
38,322 |
242,014 |
n/a |
0.96 |
|
1983 |
44,921 |
372,699 |
53,243 |
0.75 |
|
1984 |
37,255 |
296,823 |
42,102 |
0.50 |
|
1985 |
65,065 |
555,290 |
78,231 |
0.50 |
|
1986 |
86,312 |
805,078 |
112,587 |
0.69 |
|
1987 |
69,216 |
902,758 |
97,882 |
0.52 |
|
1988 |
68,102 |
1,589,212 |
180,909 |
0.60 |
|
1989 |
53,925 |
1,312,037 |
145,124 |
0.42 |
|
1990 |
54,572 |
1,216,000 |
127,873 |
0.35 |
|
1991 |
112,918 |
3450,000 |
336,500 |
0.92 |
|
1992 |
161,918 |
3,156,000 |
298,603 |
0.95 |
|
1993 |
184,233 |
3,746,171 |
341,901 |
1.19 |
|
1994 |
312,483 |
7,028,295 |
606,630 |
1.65 |
*Note: Annual average exchange rates obtained from the Statistical Year Book of Maldives, 1995.
Source: Customs, Complied by EPCS/MOFA
Table 2- Average Unit Prices for aquarium fish offered for major destination (prices in MRf.)
|
Destinations |
1989 |
1990 |
1991 |
1992 |
1993 |
1994 |
|
Europe |
27.82 |
28.14 |
43.76 |
26.66 |
25.73 |
30.52 |
|
Sri Lanka |
11.63 |
11.56 |
12.40 |
9.41 |
13.11 |
15.75 |
|
Far East |
30.75 |
39.90 |
46.68 |
42.47 |
96.91 |
66.16 |
|
USA |
27.60 |
67.74 |
18.95 |
47.54 |
- |
25.17 |
|
Others |
- |
- |
- |
- |
- |
9.09 |
Source: Customs, Compiled by EPCS/MOFA
Table 3. List of species exported in the trade with estimated numbers (nearest 50) exported in 1993 and 1994.
Column A = number of species in the sample of 29 packing lists picked at random from detailed invoices.
|
Species |
Local name |
A |
1993 |
1994 |
|
CHAETODONTIDAE, Butterflyfishes |
||||
|
Chaetodon auriga |
Threadfin |
173 |
2150 |
3700 |
|
C. collare |
Collare or Pakistani |
27 |
350 |
600 |
|
C. falcula |
Saddleback |
426 |
5350 |
9100 |
|
C. guttatissimus |
Spotted |
135 |
1700 |
2900 |
|
C. kleinii |
Klein's or Sunburst |
141 |
1750 |
3000 |
|
C. lunula |
Racoon |
8 |
100 |
150 |
|
C. madagascariensis |
Madagascar or Pear Scale |
38 |
500 |
800 |
|
C. melannotus |
Black-backed |
163 |
2050 |
3450 |
|
C. meyeri |
Meyer's |
32 |
400 |
700 |
|
C. unimaculatus |
Teardrop |
26 |
350 |
550 |
|
C. xanthocephalus |
Yellowhead or Goldring |
265 |
3350 |
5650 |
|
Forcipiger spp. |
Long-nosed |
73 |
900 |
1550 |
|
Hemitaurichthys zoster |
Pyramid |
10 |
150 |
200 |
|
Chaetodon mitratus |
- |
72 |
900 |
1550 |
|
Chaetodon lineolatus |
- |
7 |
100 |
150 |
|
Chaetodon bennetti |
- |
7 |
100 |
150 |
|
Chaetodon oxycephalus |
- |
83 |
1050 |
1750 |
|
POMACANTHIDAE, Angelfishes |
||||
|
Apolemichthys trimaculatus |
Flagfish |
32 |
400 |
700 |
|
Centropyge multispinis |
Bluefin Dwarf |
75 |
950 |
1600 |
|
Pomacanthus imperator |
Emperor |
86 |
1100 |
1850 |
|
P. xanthometopon |
Yellow-faced |
1 |
<50 |
<50 |
|
Pygoplites diacanthus |
Royal |
321 |
4050 |
6850 |
|
Centropyge spp. |
- |
11 |
150 |
250 |
|
Apolemichthys xanthurus |
- |
47 |
600 |
1000 |
|
A. armitagei |
- |
2 |
50 |
50 |
|
SCORPAENIDAE, Lionfishes |
||||
|
Dendrochirus brachypterus |
Shortfin |
2 |
50 |
50 |
|
Pterois antennata |
Broadbarred Firefish |
23 |
300 |
500 |
|
P. miles |
Devil Firefish |
20 |
250 |
450 |
|
P. radiata |
Radial Firefish |
179 |
2250 |
3800 |
|
Dendrochirus zebra |
- |
1 |
<50 |
<50 |
|
GOBIIDAE, Gobies |
||||
|
Gobiodon citrinus |
Poison or Yellow Goby |
1346 |
16900 |
28700 |
|
Paragobiodon microlepis |
Green Goby |
5 |
50 |
100 |
|
Nemateleotris magnifica |
Fire (tail) Goby |
28 |
350 |
600 |
|
Valenciennea strigata |
Watchman Goby |
11 |
150 |
250 |
|
Nemateleotris decora |
Decora |
199 |
2500 |
4250 |
|
Fusigobius spp. |
- |
8 |
100 |
150 |
|
Unspecified gobies |
- |
30 |
400 |
650 |
|
BLENNIDAE, Blennies |
||||
|
Cirripectes stigmata |
- |
3 |
50 |
50 |
|
Unspecified blennies |
- |
8 |
100 |
150 |
|
POMACENTRIDAE, Damselfishes |
||||
|
Amphiprion nigripes |
Maldives Clown |
358 |
4500 |
7650 |
|
A. clarkii |
Sebae Clown |
54 |
700 |
1150 |
|
Clown Fish |
Clown Fish |
263 |
3300 |
5600 |
|
Chromis viridis |
Green Damsel |
451 |
5650 |
9600 |
|
Dascyllus aruanus |
Three-stripe Damsel |
673 |
8450 |
14350 |
|
Pomacentrus pavo |
Jade Damselfish |
385 |
4850 |
8200 |
|
MONACANTHIDAE, Filefishes |
||||
|
Oxymonacanthus longirostris |
Longnose |
479 |
6000 |
10200 |
|
CIRRHITIDAE, Hawkfishes |
||||
|
Cirrhitichthys oxycephalus |
Coral Hopper |
2 |
50 |
50 |
|
Oxycirrhites typus |
Longnose Hawkfish |
17 |
200 |
350 |
|
Unspecified hawkfishes |
- |
2 |
50 |
50 |
|
SERRANIDAE, Anthias, groupers |
||||
|
Pseudanthias dispar |
Longfin Wreckfish |
373 |
4700 |
7950 |
|
P. evansi |
Purple Wreckfish |
1200 |
15050 |
25550 |
|
P. kashiwae |
Silver-streak Goldie |
80 |
1000 |
1700 |
|
Nemanthias carberryi |
- |
304 |
3800 |
6500 |
|
Variola louti |
Lyretail Grouper |
16 |
200 |
350 |
|
Anthias sp. |
- |
678 |
8500 |
14450 |
|
BALISTIDAE, Triggerfishes |
||||
|
Balistoides conspicillum |
Clown Trigger |
37 |
450 |
800 |
|
Rhinecanthus aculeatus |
Picasso |
511 |
6400 |
10900 |
|
ACANTHURIDAE, Surgeonfishes |
||||
|
Acanthurus leucosternon |
Powder Blue |
1347 |
16900 |
28700 |
|
Naso lituratus |
Lipstick or Orangespine |
31 |
400 |
650 |
|
Paracanthurus hepatus |
Regal Blue |
2 |
50 |
50 |
|
Zebrasoma scopas |
Brown Sailfin |
163 |
2050 |
3450 |
|
Z. veliferum |
Sailfin |
992 |
12450 |
21150 |
|
Naso valmingii |
- |
18 |
250 |
400 |
|
Naso spp. |
- |
134 |
1700 |
2850 |
|
Acanthurus tennenti |
- |
76 |
950 |
1600 |
|
- |
Yellow eye surgeon |
56 |
700 |
1200 |
|
Ctenochaetus striogosus |
- |
1 |
<50 |
<50 |
|
LABRIDAE, Wrasses + SCARIDAE, Parrot fishes |
||||
|
Anampses lineatus |
Leaf or Deep-sea Wrasse |
114 |
1450 |
2450 |
|
A. meleagrides |
Marble or Yellowtail |
43 |
550 |
900 |
|
Bodianus axillaris |
Polkadot |
18 |
250 |
400 |
|
Coris formosa |
Red Wrasse |
1 |
<50 |
<50 |
|
Gomphosus caeruleus |
Green Birdmouth |
81 |
1000 |
1750 |
|
Halichoeres leucoxanthus |
Yellow Wrasse |
8 |
100 |
150 |
|
Labroides bicolor |
Yellow Diesel, Cleaner |
231 |
2900 |
4900 |
|
L. dimidiatus |
Blue Diesel, Cleaner |
223 |
2800 |
4750 |
|
Macropharyngodon bipartitus |
Rare Wrasse |
259 |
3250 |
5500 |
|
Novaculichthys taeniourus |
Dragon Wrasse |
224 |
2800 |
4750 |
|
Pseudocheilinus hexataenia |
Pyjama |
32 |
400 |
700 |
|
Bodianus bimaculatus |
- |
20 |
250 |
450 |
|
- |
Blue Wrasse |
36 |
450 |
750 |
|
- |
Blue Parrot |
14 |
200 |
300 |
|
Coris spp, |
- |
81 |
1000 |
1750 |
|
- |
Parrot fish |
56 |
700 |
1200 |
|
Halichoeres cosmetus |
- |
2 |
50 |
50 |
|
- |
Bicolor Parrot Fish |
1 |
<50 |
<50 |
|
- |
Commet Wrasse |
10 |
150 |
200 |
|
Parachelinus mccoskeri |
- |
20 |
250 |
450 |
|
TETRAODONTIDAE, Pufferfishes |
||||
|
C. valentini |
Saddleback |
59 |
750 |
1250 |
|
Arothron spp. |
Puffer Fish |
73 |
900 |
1550 |
|
OSTRACIDAE, Boxfishes |
||||
|
Ostracion cubicus |
Yellow Boxfish |
48 |
600 |
1000 |
|
DIODONTIDAE, Porcupinefishes |
||||
|
Diodon liturosus |
Shortspine Porcupine |
12 |
150 |
250 |
|
MULLIDAE, Goatfishes |
||||
|
Parupeneus cyclostomus |
Yellow Goatfish |
23 |
300 |
500 |
|
HEAMULIDAE. Sweetlips |
||||
|
Plectorhinchus spp. |
Oriental |
5 |
50 |
100 |
|
CALLIONYMIDAE, Dragonets |
||||
|
Synchiropus stellatus |
Starry Dragonet |
3 |
50 |
50 |
|
INVERTEBRATES |
||||
|
|
Pink star |
4 |
50 |
100 |
|
|
Red Star Fish |
48 |
600 |
1000 |
|
|
Anemone |
40 |
500 |
850 |
|
|
Sea Urchin |
51 |
650 |
1100 |
Table 4. Commonest 20 species of fish exported in the trade and the estimates (nearest 50) of quantity exported in 1994
|
Species |
Local Name |
Export nos. |
|
Acanthurus leucosternon |
Powder Blue |
28,700 |
|
Gobiodon citrinus |
Poison or Yellow Goby |
28,700 |
|
Pseudanthias evansi |
Purple Wreckfish |
25,550 |
|
Zebrasoma veliferum |
Sailfin |
21,150 |
|
Anthias sp. |
Anthias |
14,450 |
|
Dascyllus aruanus |
Three-stripe Damsel |
14,350 |
|
Rhinecanthus aculeatus |
Picasso |
10,900 |
|
Oxymonacanthus longirostris |
Longnose |
10,200 |
|
Chromis viridis |
Green Damsel |
9,600 |
|
Chaetodon falcula |
Saddleback |
9,100 |
|
Pomacentrus pavo |
Jade Damselfish |
8,200 |
|
Pseudanthias dispar |
Longfin Wreckfish |
7,950 |
|
Amphiprion nigripes |
Maldives Clown |
7,650 |
|
Pygoplites diacanthus |
Royal |
6,850 |
|
Nemanthias carberryi |
Anthias |
6,500 |
|
Chaetodon xanthocephalus |
Yellowhead or Goldring |
5,650 |
|
Clown Fish |
Clown Fish |
5,600 |
|
Macropharyngodon bipartitus |
Rare Wrasse |
5,500 |
|
Labroides bicolor |
Yellow Diesel, Cleaner |
4,900 |
|
Novaculichthys taeniourus |
Dragon Wrasse |
4,750 |
|
|
Total of 20 Common Species |
236,250 |
|
|
Total exported in 1994 |
312,483 |
|
|
Per cent of 20 Commonest |
76 |
Table 5. Comparison of packaging and freight costs for a sample of live tropical fish exports to Sri Lanka with those of Europe (Belgium, England, Netherlands, Switzerland, Germany, France) for 1993.
|
Destination |
Number of Boxes |
Number of Fish |
Packaging Costs US$ |
Total FOB [US$] |
% Total in packaging |
Packaging cost/box US$ |
|
Sri Lanka |
1767 |
41260 |
8173 |
77281.60 |
10.58 |
4.63 |
|
Europe |
1772 |
44745 |
10470 |
183945.95 |
5.69 |
5.91 |
Source: Customs
Table 6. Quantity of aquarium fish (nos.) exported from the Maldives by country from 1989-1994
|
Country/Region |
1989 |
1990 |
1991 |
1992 |
1993 |
1994 |
|
EUROPE | ||||||
|
United Kingdom |
19938 |
7506 |
23262 |
25127 |
32059 |
29706 |
|
Italy |
1771 |
381 |
7329 |
13808 |
4554 |
6486 |
|
Germany |
3453 |
3107 |
6170 |
10177 |
6935 |
5973 |
|
Austria |
0 |
0 |
927 |
0 |
0 |
445 |
|
Switzerland |
189 |
605 |
224 |
5597 |
337 |
297 |
|
France |
3029 |
1960 |
1538 |
5179 |
1380 |
770 |
|
Netherlands |
9421 |
12655 |
10470 |
21083 |
15210 |
10666 |
|
Spain |
9 |
0 |
0 |
0 |
0 |
0 |
|
Belgium |
0 |
1681 |
4343 |
5034 |
2749 |
0 |
|
Denmark |
0 |
0 |
1021 |
155 |
0 |
0 |
|
Sub Total |
37810 |
27895 |
55284 |
86160 |
63224 |
54343 |
|
SRI LANKA |
11940 |
21025 |
46308 |
71586 |
114643 |
203587 |
|
FAR EAST | ||||||
|
Thailand |
0 |
0 |
0 |
0 |
0 |
338 |
|
Hong Kong |
0 |
0 |
0 |
0 |
330 |
7500 |
|
Singapore |
517 |
4 |
1673 |
29 |
88 |
704 |
|
Japan |
1401 |
4890 |
7219 |
2483 |
5984 |
11196 |
|
Australia |
51 |
19 |
0 |
0 |
0 |
0 |
|
Taiwan |
0 |
450 |
0 |
0 |
0 |
180 |
|
Sub Total |
1969 |
5363 |
8892 |
2512 |
6402 |
19918 |
|
OTHER COUNTRIES | ||||||
|
India |
0 |
0 |
0 |
0 |
0 |
65 |
|
Bahrain |
0 |
0 |
0 |
0 |
0 |
1410 |
|
U.A.E. |
0 |
0 |
0 |
0 |
0 |
68 |
|
South Africa |
0 |
0 |
0 |
0 |
0 |
69 |
|
Sub Total |
0 |
0 |
0 |
0 |
0 |
1612 |
|
U.S.A. |
2206 |
289 |
2214 |
1660 |
0 |
33023 |
|
GRAND TOTAL |
53925 |
54572 |
112698 |
161918 |
184233 |
312483 |
Source: Customs, Compiled by EPCS/MOFA
Table 7. Value of aquarium fish (in MRf.) exported from the Maldives from 1989-1994
|
Country/Region |
1989 |
1990 |
1991 |
1992 |
1993 |
1994 |
|
EUROPE | ||||||
|
United Kingdom |
455755 |
176100 |
583316 |
544179 |
765521 |
831298 |
|
Italy |
59492 |
13236 |
225049 |
364067 |
125992 |
221443 |
|
Germany |
67996 |
61158 |
1085083 |
275852 |
164512 |
240028 |
|
Austria |
0 |
0 |
16927 |
0 |
0 |
14949 |
|
Switzerland |
5498 |
21248 |
5117 |
166319 |
15354 |
7108 |
|
France |
104890 |
59843 |
65861 |
185222 |
53381 |
6801 |
|
Netherlands |
357355 |
417806 |
315109 |
603330 |
439564 |
336918 |
|
Spain |
830 |
0 |
0 |
0 |
0 |
0 |
|
Belgium |
0 |
35464 |
86590 |
151289 |
62430 |
0 |
|
Denmark |
0 |
0 |
35989 |
6646 |
0 |
0 |
|
Sub Total |
1051816 |
784855 |
2419041 |
2296904 |
1626754 |
1658545 |
|
SRI LANKA |
138804 |
242989 |
574449 |
673325 |
1502780 |
3205986 |
|
FAR EAST | ||||||
|
Thailand |
0 |
0 |
0 |
0 |
0 |
27965 |
|
Hong Kong |
0 |
0 |
0 |
0 |
284724 |
853973 |
|
Singapore |
8268 |
3093 |
78493 |
2146 |
9730 |
30568 |
|
Japan |
51359 |
194978 |
336607 |
104537 |
322482 |
396480 |
|
Australia |
915 |
1591 |
0 |
0 |
0 |
0 |
|
Taiwan |
0 |
14333 |
0 |
0 |
0 |
8789 |
|
Sub Total |
60542 |
213995 |
415100 |
106683 |
616936 |
1317775 |
|
OTHER COUNTRIES | ||||||
|
India |
0 |
0 |
0 |
0 |
0 |
2650 |
|
Bahrain |
0 |
0 |
0 |
0 |
0 |
10207 |
|
U.A.E. |
0 |
0 |
0 |
0 |
0 |
655 |
|
South Africa |
0 |
0 |
0 |
0 |
0 |
1139 |
|
Sub Total |
0 |
0 |
0 |
0 |
0 |
14651 |
|
U.S.A. |
60876 |
19576 |
41959 |
78911 |
0 |
831341 |
|
GRAND TOTAL |
1312038 |
1261415 |
3450550 |
3155824 |
3746471 |
7028295 |
Source: Customs, Compiled by EPCS/MOFA
Figure 1. Export of aquarium fish (nos.) and their export value in MRF (1980-94)
Source: Customs, compiled by MOFA/EPCS
Figure 2. Aquarium fish exports by major destinations (1989-94)
![]()
![]()
![]()