![]()
![]()
![]()
J-M. Faurès, Land and Water Development Division,
FAO, Rome, Italy
Information on quantity and quality of natural resources is essential for sustainable agricultural development. In particular, information on freshwater resources, their availability and use is becoming increasingly important with the emergence of regional water shortages and the need to improve water use efficiency. This paper discusses the problems met in identifying and computing relevant indicators for sustainable water resources development and presents the current activities of FAO in that field. After a brief review of the main components of the water cycle, the paper focuses mostly on indicators at country level and introduces the relationship between basin and political boundaries as a major issue in computing water resources indicators. A discussion follows about ways to assess water resources and use. A few key indicators are further presented. In conclusion, possible ways to improve future computation of water resources development indicators are discussed.
WATER RESOURCES AND USE IN THE WORLD
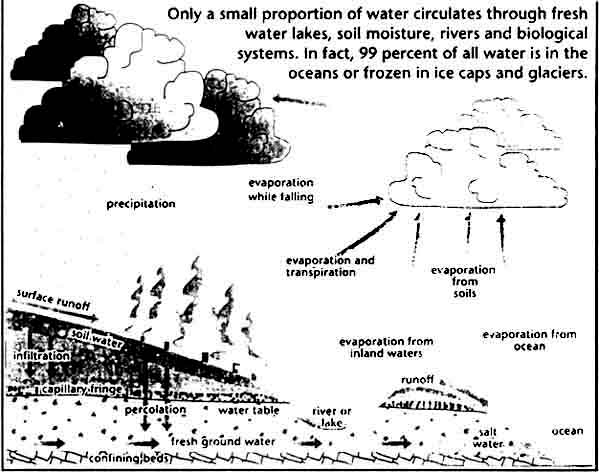
It is common to consider water resources as that part of the water cycle which runs off in the rivers and infiltrates in aquifers (Figure 1). This corresponds to the part of rain falling over the continents which does not evaporate. By this definition, water resources are renewable, and their value is usually computed on a yearly basis. The global water resources available over the continents are estimated at around 40 000 km3/yr. Of this volume, only a small part, 9 000 km3/yr, is considered to be available for use, the remaining part being lost in floods. In 1990, this represented about 1 800 m3/person/yr available for use. Since estimated average water use was about 800 m3/person/yr in 1990, one might conclude there is still plenty of water available for future use.
FIGURE 1. The hydrological cycle - vital, vulnerable
However, such a conclusion would not take into account the large regional variations of water resources and use, which already lead to severe limitations in several parts of the world, while other regions receive much more than they could use. As an example, central Africa, which represents 18% of the area of the continent, receives 49% of its water, while northern Africa, for a similar area, receives 1.2% of the continent's water resources.
FIGURE 2. Estimated annual world water use, total and by sector, 1900-2000
Agriculture is by far the major user of water, with an average 69% over the world, followed by industry, with 23%, and domestic use (cities) with 8%. Yet agriculture is also the sector which presents the lowest return on investment and the highest level of wastage and, in situations of competition, sees its share reduced to satisfy the needs of industries and cities. Figure 2 shows the evolution of water use in the world in the current century, with estimates up to the year 2000, and the dramatic increase in water use which has accompanied population growth and development during the second part of the century.
ASSESSING WATER RESOURCES
Assessing water resources at country level presents several difficulties. First, a decision has to be made about the kinds of resources which have to be computed. In arid countries, the part of non-renewable water resources (water available from aquifers with a negligible rate of recharge) which is available for use and already being drawn upon for consumption may represent a much larger volume than renewable water resources. Non-conventional resources may also represent an important part of the available water in arid countries. They are, mostly, re-used wastewater and desalinated water. In such countries, water resources assessment simply on the basis of the water cycle is of little use for planning purposes and would only serve as an indicative figure to assess the degree of mining of water resources and desalination.
A second difficulty arises in the computation of surface water and groundwater. Both resources are usually computed separately although they are parts of the same water cycle. Separate computation of surface water and groundwater usually leads to an over-estimate of the global value of water resources in a given area and this error is frequently observed, even in specific water resources studies. Directly related to this issue is the problem of geographical boundaries used in assessing water resources. In order to maintain the integrity of the water cycle, surface water has to be computed on the basis of river basins, while groundwater has to be assessed on the basis of groundwater basins (aquifers). These basins rarely have the same geographical extent, especially in arid countries, and they almost never correspond to political boundaries.
Although water resources are usually expressed on an annual basis, and compared with yearly demand, large seasonal variations can be observed, and can substantially reduce the amount of water actually available for use. In countries where agriculture heavily relies on water resources during the dry season, water availability may be significantly reduced if no storage capacity is available for regulation of wet-season flow. Arid and semi-arid countries are also subject to large inter-annual variations of rainfall and water resources, a variation which has to be taken into account in assessing which part of total water resources is really available for use.
Most of these considerations have important consequences in terms of mapping applications. Figures 3 to 6 show how the problem of geographically representing water resources has been addressed by different approaches. It should be noted that none of these maps really allows the user to assess the water resources in a given location.
A further complication lies in the concept of available water. It was noted above that river runoff is not fully available for use because of seasonal variations and the presence of floods. Additionally, part of the water flowing into a neighbouring country may be reserved by treaty or agreement and thus cannot be considered available for use in the upstream country. The availability of groundwater is subject to the country's capacity to extract the water. In summary, the concept of availability, which is much more powerful than that of water resources, can hardly be applied systematically over all countries and has strong economic and political implications. Most of the limitations described above apply with a much higher intensity in regions where water is scarce, which are those regions where water resources present a limitation to development.
ASSESSING WATER USE
A distinction should be made between water use and withdrawal. The figures presented previously refer to physical withdrawal from a water source, be it a river, a lake or an aquifer. They correspond to gross withdrawal. In fact, only a part of the water withdrawn is actually used, the rest being lost in conveyance systems or returned to the water cycle after use (return flow). Consumptive use is that part of the water which is lost and does not return to the system (it is evaporated or transpired in the production of biomass). Table 1 gives estimates of net consumption rate for the major water use sectors (Margat, 1996).
TABLE 1. Estimated net consumption rate for different water use sectors
|
Sector |
Consumption rate (%) |
|
Agriculture |
60-90 |
|
Domestic use |
5-10 |
|
Industries |
5 |
|
Fisheries |
0 |
|
Recreation |
0 |
|
Environment |
0 |
|
Navigation |
0 |
Table 1 shows that a distinction must be made between sectors showing a certain rate of consumption (agriculture, industries, cities) and sectors using water without significant physical consumption (aquatic life and environment, recreation, navigation). Although it is generally recognized that these sectors may be of major importance in the overall water balance of a region, for practical reasons they are usually not taken into account in the physical computation of water use. When working at a detailed level, these requirements can be taken into account in determining, for instance, a minimum level of water flow to be kept available in the rivers. At country or continental level, however, such an approach is not feasible. This restriction represents a serious limitation to the value of water use figures aggregated at country level.
FIGURE 3. Mapping mean annual runoff (Korzun et al., 1974)
FIGURE 4. Mapping seasonal flow regime (Korzun et al., 1974)
Even when using gross water withdrawal as a measure of water use, several limitations still exist. Agricultural water withdrawal is very rarely measured. Most of the time it is estimated on the basis of irrigated areas and crop water requirements, with a rough estimate of conveyance losses. Errors up to 100% at the level of a country have been observed for the agricultural sector. For important industries, and large cities, accurate values are usually available on the basis of the capacity of the distribution networks, but in most cases withdrawal must be indirectly assessed on the basis of population or type of industry.
FIGURE 5. Mapping mean annual runoff (Source: USGS)

FIGURE 6. Sub-basin representation of water resources (in m3/s)

Another major limiting factor which is difficult to take into account at the level of a country is the quality of return flow. Industries, cities and agriculture usually do not preserve the quality of water in the return flow, and this has important consequences in terms of availability of quality water downstream. Still, the variety of situations makes it impossible to quantify this aspect of water development adequately.
SOME POSSIBLE INDICATORS
All the restrictions described above make the identification of relevant indicators for sustainable water resources development particularly difficult. The uncertainty in assessing resources and use requires the selection of robust indicators. There is no doubt, however, that the relative availability of water resources and human pressure on the resources will be key factors in assessing sustainability in water use. A few indicators which are considered to best represent the overall status of a country's water resources development are presented below.
¤ Internal renewable water resources. This is the average annual flow of rivers and groundwater generated from endogenous precipitation, after ensuring that there is no double counting. It represents the maximum amount of water resource produced within the boundaries of a country. This value, which is expressed as an average on a yearly basis, is invariant in time (except in the case of proved climate change). The indicator can be expressed in three different units: in absolute terms (km3/yr), in mm/yr (it is a measure of the humidity of the country), and as a function of population (m3/person per yr).¤ Global renewable water resources. This is the sum of internal renewable water resources and incoming flow originating outside the country. Unlike internal resources, this value can vary with time if upstream development reduces water availability at the border. Treaties ensuring a specific flow to be reserved from upstream to downstream countries may be taken into account in the computation of global water resources in both countries.
¤ Dependency ratio. This is the proportion of the global renewable water resources originating outside the country, expressed in percentage. It is an expression of the level to which the water resources of a country depend on neighbouring countries.
¤ Water withdrawal. In view of the limitations described above, only gross water withdrawal can be computed systematically on a country basis as a measure of water use. Absolute or per-person value of yearly water withdrawal gives a measure of the importance of water in the country's economy. When expressed in percentage of water resources, it shows the degree of pressure on water resources. A rough estimate shows that if water withdrawal exceeds a quarter of global renewable water resources of a country, water can be considered a limiting factor to development and, reciprocally, the pressure on water resources can have a direct impact on all sectors, from agriculture to environment and fisheries.
Other indicators may further refine the assessment of the water sector. They are related to the seasonal and inter-annual variability of water resources, the degree of flow regulation existing in the country, and a measure of water quality. It would be practically impossible, however, to obtain such indicators systematically for every country.
Finally, an index representing the state of knowledge about water resources and withdrawal could also be developed. It would give a measure of the degree of uncertainty in the values of the water resources development indicators.
PRELIMINARY RESULTS AND PROBLEMS MET
Although assessment of water resources on a country basis is not the primary purpose of FAO's water activities, the increasing pressure on agriculture to reduce water use and wastage in several parts of the world necessitates better assessment of water resources and use, and the development of an information base on the subject. The Aquastat programme has been developed to meet these needs. It is based primarily on information collected at country and sub-country level (FAO, 1995a and b).
By the end of 1995, the survey had been completed for the 53 countries of the African continent. This first exercise made it possible to better assess the availability of information at country level and the results to be expected from systematic country surveys based on existing literature. Main conclusions from the survey are:
¤ The degree of precision of information on water resources and use depends directly on the importance of water for the country's economy. Arid countries usually have detailed inventories and master plans with very accurate information on water resources and use, while major uncertainties exist in the information on water resources and use in humid countries. This has a direct consequence on the quality of continental assessment: the greatest uncertainty lies in the areas with the largest water resources.¤ Many contradictory figures can be found in the literature, showing the degree of uncertainty existing about water resources and use in the countries. Particularly, there is no agreed standard method to compute water use for agriculture. This situation substantially reduces the quality of regional and continental estimates of water use.
CONCLUSION
Further improvement in assessing water resources on a country basis can be expected from extensive use of geographic information systems (GIS). A major effort must be made in the near future to build coverage of major river basins and aquifers. This information can then be used in combination with political boundaries and agro-ecological zones for a better assessment of transboundary water flow. The use of GIS will also make it possible to combine point and area information. In particular, it will make it possible, by integrating point information at basin level, to assess resources in places where measurements are not available.
Action also needs to be taken in harmonizing methods to compute water withdrawal and water use by sector. Of particular importance will be the necessity to agree on a way to compute agricultural water use. A promising experiment was recently made by FAO to assess agricultural water use systematically for the African continent on the basis of irrigated areas and crop water requirements, taking into account climate and irrigated cropping patterns (FAO, 1997).
REFERENCES
FAO. 1995a. Water resources of African countries: a review. FAO, Rome. 35 p.
FAO. 1995b. Irrigation in Africa in figures. Water Reports 7. FAO, Rome. 336 p.
FAO. 1997. Irrigation potential in Africa - A basin approach. Land and Water Bulletin 4, FAO, Rome.
Korzun, V.I. et al. (eds.). 1974. Atlas of the World Water Balance. USSR National Committee for the International Hydrological Decade. English version. UNESCO, Paris. 1977. 35 p. + 65 maps.
Margat, J. 1996. Les ressources en eau: conception, évaluation, cartographie, compatabilité. Manuels & Méthodes N° 28. FAO/BRGM. Editions BRGM, Orleans, France.
![]()
![]()
![]()