![]()
![]()
ANNEX 5 - Table 4
ESTIMATED OPERATING COST FOR A 3-HA MODEL FISH SEED FARM
| Item | Cost (I.Rs.) | |
| Brood stock: | ||
| Asiatic carps (0.25 ton, at I.Rs. 12 500/ton) | 3 125 | |
| Common carp (0.2 ton, at I.Rs. 10 000/ton) | 2 000 | |
| Fertilizers and feeds: | ||
| Mahua oil cake (2.0 ton, at I.Rs. 1 000/ton) | 2 000 | |
| Cow dung (7.5 ton, at I.Rs. 50/ton) | 375 | |
| Chicken manure (5.0 ton, at I.Rs. 100/ton) | 500 | |
| Wheat flour (0.25 ton, at I.Rs. 1 200/ton) | 300 | |
| Mustard oil cake (2.0 ton, at I.Rs. 1 000/ton) | 2 000 | |
| Rice bran (4.0 ton, at I.Rs. 500/ton) | 2 000 | |
| Wheat (0.5 ton, at I.Rs. 800/ton) | 400 | |
| Wages: | ||
| 60 man-months, at I.Rs. 500/man-month | 30 000 | |
| Pick-up truck1 | 6 000 | |
| Water pumps: | ||
| Portable diesel pump2 | 4 000 | |
| Electrical pump3 | 900 | |
| Maintenance: | ||
| Earthwork, water gates, building and other facilities4 | 9 730 | |
| Miscellaneous: | ||
| Interest on working capital5 | 3 485 | |
| TOTAL | 66 815 | |
4 Approximately 3% of the initial cost
ANNEX 5 - Table 5
ESTIMATED OPERATING COST FOR A 10-HA MODEL FISH SEED FARM
| Item | Cost (I.Rs.) | |
| Brood stock: | ||
| Asiatic carps (1.5 ton, at I.Rs. 12 500/ton) | 18 750 | |
| Common carp (0.7 ton, at I.Rs. 10 000/ton) | 7 000 | |
| Fertilizers and feeds: | ||
| Mahua oil cake (6.6 ton, at I.Rs. 1 000/ton) | 6 600 | |
| Cow dung (25.0 ton, at I.Rs. 50/ton) | 1 250 | |
| Chicken manure (16.5 ton, at I.Rs. 100/ton) | 1 650 | |
| Wheat flour (0.8 ton, at I.Rs. 1 200/ton) | 960 | |
| Mustard oil cake (6.6 ton, at I.Rs. 1 000/ton) | 6 600 | |
| Rice bran (13.2 ton, at I.Rs. 500/ton) | 6 600 | |
| Wheat (1.5 ton, at I.Rs. 800/ton) | 1 200 | |
| Wages: | ||
| 96 man-months, at I.Rs. 500/man-month | 48 000 | |
| Pick-up truck1 | 11 500 | |
| Water pumps: | ||
| Portable diesel pump2 | 7 850 | |
| Electrical pump3 | 1 200 | |
| Maintenance: | ||
| Earthwork, water gates, building and other facilities4 | 16 635 | |
| Miscellaneous: | ||
| Interest on working capital5 | 7 470 | |
| TOTAL | 143 265 | |
4 Approximately 3% of the initial cost
ANNEX 5 - Table 6
ESTIMATED OPERATING COST FOR A 25-HA MODEL FISH SEED FARM
| Item | Cost (I.Rs.) | |
| Brood stock: | ||
| Asiatic carps (4.0 ton, at I.Rs. 12 500/ton) | 50 000 | |
| Common carp (2.0 ton, at I.Rs. 10 000/ton) | 20 000 | |
| Fertilizers and feeds: | ||
| Mahua oil cake (19.2 ton, at I.Rs. 1 000/ton) | 19 200 | |
| Cow dung (63.0 ton, at I.Rs. 50/ton) | 3 150 | |
| Chicken manure (42.0 ton, at I.Rs. 100/ton) | 4 200 | |
| Wheat flour (2.1 ton, at I.Rs. 1 200/ton) | 2 520 | |
| Mustard oil cake (19.2 ton, at I.Rs. 1 000/ton) | 19 200 | |
| Rice bran (38.7 ton, at I.Rs. 500/ton) | 19 350 | |
| Wheat (3.75 ton, at I.Rs. 800/ton) | 3 000 | |
| Wages: | ||
| 180 man-months, at I.Rs. 500/man-month | 90 000 | |
| Truck1 | 38 610 | |
| Water pumps: | ||
| Portable diesel pump2 | 10 918 | |
| Electrical pump3 | 2 280 | |
| Maintenance: | ||
| Earthwork, water gates, building and other facilities4 | 28 780 | |
| Miscellaneous: | ||
| Interest on working capital5 | 14 730 | |
| TOTAL | 325 938 | |
4 Approximately 3% of the initial cost
ANNEX 5 - Table 7
CASH FLOW PROJECTIONS FOR FISH SEED FARMS
(in I.Rs.)
| 3-ha model | 10-ha model | 25-ha model | ||||||||||
| year | year | year | ||||||||||
| 1 | 2–8 | 1 | 2–7 | 8 | 1 | 2 | 3–7 | 8 | ||||
| Cash Inflow | ||||||||||||
| Net sales1 | 50 000 | 150 000 | 240 000 | 720 000 | 720 000 | 600 000 | 1 200 000 | 1 800 000 | 1 800 000 | |||
| Loan amount2 | 325 800 | - | 584 625 | - | - | 1 098 900 | - | - | - | |||
| Borrowers' contribution3 | 108 600 | - | 194 875 | - | - | 366 300 | - | - | - | |||
| Total | 484 400 | 150 000 | 1 019 500 | 720 000 | 720 000 | 2 065 200 | 1 200 000 | 1 800 000 | 1 800 000 | |||
| Cash Outflow | ||||||||||||
| Operating cost4 | 22 272 | 66 815 | 47 755 | 43 265 | 143 265 | 108 646 | 325 938 | 325 938 | 325 938 | |||
| Investment cost5 | 434 400 | - | 779 500 | - | - | 1 465 200 | - | - | - | |||
| Debt service6 | - | 68 970 | - | 138 192 | - | - | 259 754 | 259 754 | - | |||
| Total | 456 672 | 135 785 | 827 255 | 181 457 | 143 265 | 1 573 846 | 585 692 | 585 692 | 325 938 | |||
| Net Cash Flow | 27 273 | 14 215 | 2 245 | 438 543 | 576 735 | 491 354 | 614 308 | 1 214 308 | 1 474 062 | |||
| Financial Benefit/Cost | ||||||||||||
| Benefit | 50 000 | 150 000 | 240 000 | 720 000 | 720 000 | 600 000 | 1 200 000 | 1 800 000 | 1 800 000 | |||
| Cost | 457 127 | 66 815 | 827 255 | 143 265 | 143 265 | 1 573 846 | 325 938 | 325 938 | 325 938 | |||
| Net Benefit | (407 127) | 83 185 | (587 255) | 576 735 | 576 735 | (973 846) | 874 062 | 1 474 062 | 1 474 062 | |||
| Financial Rate of Return | Approximately 10 percent | Over 50 percent | Over 50 percent | |||||||||
2 75 percent of the investment cost
3 25 percent of the investment cost
4 See Tables 4, 5 and 6 in this Annex
5 See Tables 1, 2 and 3 in this Annex
ANNEX 5 - Table 8
ESTIMATED UNIT INVESTMENT COST FOR REHABILITATED FISHPONDS (TYPE B)
| Item | Cost in I.Rs.1 | ||
| Model 1 0.75 ha | Model 2 1.5 ha | Model 3 5.0 ha | |
| Desilting2 | 3 350 | 5 025 | 12 050 |
| Outlet screen3 | 200 | 200 | 500 |
| Fishpond equipment4 | 200 | 200 | 500 |
| TOTAL | 3 750 | 5 425 | 13 450 |
1 The estimated incremental working capital costs are not included
3 Bamboo screen with wooden frame
4 Small seine and gill-net, and hand tools
ANNEX 5 - Table 9
ESTIMATED UNIT INVESTMENT COST FOR IMPROVED FISHPONDS (TYPE C)
| Item | Cost in I.Rs.1 | ||
| Model 1 0.75 ha | Model 2 1.5 ha | Model 3 5.0 ha | |
| Desilting2 | 4 950 | 7 400 | 18 450 |
| Outlet screen3 | 200 | 200 | 500 |
| Fishpond equipment4 | 200 | 200 | 500 |
| TOTAL | 5 350 | 7 800 | 19 450 |
1 This does not include the estimated incremental working capital costs
3 Bamboo screen with wooden frame
4 Small seine and gill-net, and hand tools
ANNEX 5 - Table 10
ESTIMATED UNIT INVESTMENT COST FOR IMPROVED IRRIGATION PONDS (TYPE D)
| Model 1 (10-ha) Item: | Volume or unit | Unit price (I.Rs.) | Cost (I.Rs.) |
| Dike construction1 | 500 m3 | 4.00 | 2 000.00 |
| Dewatering | 2 500 m3 | 0.16 | 400.00 |
| Outlet screen2 | 1 set | 1 000.00 | 1 000.00 |
| Guard's hut3 | 1 unit | 10 000.00 | 10 000.00 |
| Fishing gear and tools4 | 1 set | 5 000.00 | 5 000.00 |
| TOTAL for Model 1 | 18 400.00 | ||
| Model 2 (25-ha) Item: | Volume or unit | Unit price (I.Rs.) | Cost (I.Rs.) |
| Dike construction5 | 800 m3 | 4.00 | 3 200.00 |
| Dewatering | 6 300 m3 | 0.16 | 1 008.00 |
| Outlet screen2 | 1 set | 2 000.00 | 2 000.00 |
| Guard's hut3 | 1 unit | 10 000.00 | 10 000.00 |
| Fishing gear and tools4 | 1 set | 8 000.00 | 8 000.00 |
| TOTAL for Model 2 | 24 208.00 | ||
| Model 3 (75-ha) Item: | Volume or unit | Unit price (I.Rs.) | Cost (I.Rs.) |
| Dike construction6 | 1 400 m3 | 4.00 | 5 600.00 |
| Dewatering | 20 000 m3 | 0.16 | 3 200.00 |
| Outlet screen2 | 1 set | 4 000.00 | 4 000.00 |
| Guard's hut3 | 1 unit | 10 000.00 | 10 000.00 |
| Fishing gear and tools4 | 1 set | 15 000.00 | 15 000.00 |
| TOTAL for Model 3 | 37 800.00 |
1 Construction of a 0.25-ha post-fingerling holding pond within the irrigation pond
2 Bamboo screen with a wooden frame
3 With a floor space of 12 m3, constructed with masonry and concrete slabs
4 Small seine and gill nets, fish traps and hand tools
5 Construction of a 0.63-ha post-fingerling holding pond within the irrigation pond
6 Construction of a 2-ha post-fingerling holding pond within the irrigation pond
ANNEX 5 - Table 11
ESTIMATED UNIT OPERATING COST FOR REHABILITATED FISHPONDS (TYPE A)
| Model 1 (0.75 ha) Item: | Cost (I.Rs.) | ||
| Fish seeds1: | 83 | ||
| Catla and silver carp, | 540, at I.Rs. 100/1 000 | ||
| Rohu, | 130, at I.Rs. 80/1 000 | ||
| Mrigal, | 270, at I.Rs. 50/1 000 | ||
| Common carp and grass carp, | 180, at I.Rs. 20/1 000 | ||
| Mahua oil cake, 300 kg, at I.Rs. 1.00/kg2 | 300 | ||
| Wages: 30 man-days, at I.Rs. 6.00/man-day3 | 180 | ||
| TOTAL for Model 1 | 563 | ||
| Model 2 (1.5 ha) Item: | Cost (I.Rs.) | ||
| Fish seeds1: | 164 | ||
| Catla and silver carp, | 1 080, at I.Rs. 100/1 000 | ||
| Rohu, | 270, at I.Rs. 80/1 000 | ||
| Mrigal, | 540, at I.Rs. 50/1 000 | ||
| Common carp, | 360, at I.Rs. 20/1 000 | ||
| Mahua oil cake, 600 kg, at I.Rs. 1.00/kg2 | 600 | ||
| Wages: 40 man-days, at I.Rs. 6.00/man-day3 | 240 | ||
| Interest on working capital4 | 74 | ||
| TOTAL for Model 2 | 1 078 | ||
| Model 3 (5.0 ha) Item: | Cost (I.Rs.) | ||
| Fish seeds1: | 544 | ||
| Catla and silver carp, | 3 600, at I.Rs. 100/1 000 | ||
| Rohu, | 900, at I.Rs. 80/1 000 | ||
| Mrigal, | 1 800, at I.Rs. 50/1 000 | ||
| Common carp, | 1 200, at I.Rs. 20/1 000 | ||
| Mahua oil cake, 2 000 kg, at I.Rs. 1.00/kg2 | 2 000 | ||
| Wages: 50 man-days, at I.Rs. 6.00/man-day3 | 300 | ||
| Interest on working capital4 | 210 | ||
| TOTAL for Model 3 | 3 054 | ||
1 On the basis of commercial price at the size of 0.5 cm, weighing 1.5 g
2 At a strength of 5 ppm of saponin
ANNEX 5 - Table 12
ESTIMATED UNIT OPERATING COST FOR REHABILITATED FISHPONDS (TYPE B)
| Model 1 (0.75 ha) | Item: | Cost (I.Rs.) | |
| Fish seeds1: | 136 | ||
| Catla and silver carp, | 900, at I.Rs. 100/1 000 | ||
| Rohu, | 225, at I.Rs. 80/1 000 | ||
| Mrigal, | 450, at I.Rs. 50/1 000 | ||
| Common carp, | 300, at I.Rs. 20/1 000 | ||
| Mahua oil cake, 300 kg, at I.Rs. 1.00/kg2 | 300 | ||
| Cow dung, 2.25 ton, at I.Rs. 50/ton | 112 | ||
| Wages: 50 man-days, at I.Rs. 6.00/man-day3 | 300 | ||
| Depreciation of equipment | 100 | ||
| Interest on working capital4 | 62 | ||
| TOTAL for Model 1 | 1 010 | ||
| Model 2 (1.5 ha) | Item | Cost (I.Rs.) | |
| Fish seeds1: | 275 | ||
| Catla and silver carp, | 1 800, at I.Rs. 100/1 000 | ||
| Rohu, | 450, at I.Rs. 80/1 000 | ||
| Mrigal, | 900, at I.Rs. 50/1 000 | ||
| Common carp, | 600, at I.Rs. 20/1 000 | ||
| Mahua oil cake, 600 kg, at I.Rs. 1.00/kg2 | 600 | ||
| Cow dung, 4.5 ton, at I.Rs. 50/ton | 225 | ||
| Wages: 75 man-days, at I.Rs. 6.00/man-day5 | 450 | ||
| Depreciation of equipment | 100 | ||
| Interest on working capital4 | 114 | ||
| TOTAL for Model 2 | 1 764 | ||
| Model 3 (5.0 ha) | Item: | Cost (I.Rs.) | |
| Fish seeds1: | 910 | ||
| Catla and silver carp, | 6 000, at I.Rs. 100/1 000 | ||
| Rohu, | 1 500, at I.Rs. 80/1 000 | ||
| Mrigal, | 3 000, at I.Rs. 50/1 000 | ||
| Common carp, | 2 000, at I.Rs. 20/1 000 | ||
| Mahua oil cake, 2 000 kg, at I.Rs. 1.00/kg2 | 2 000 | ||
| Cow dung, 12 ton, at I.Rs. 50/ton | 600 | ||
| Wages: 100 man-days, at I.Rs. 6.00/man-day3 | 600 | ||
| Depreciation of equipment | 250 | ||
| Interest on working capital4 | 303 | ||
| TOTAL for Model 3 | 4 663 | ||
1 On the basis of commercial price at the size of 5.0 cm, weighing 1.5 g
2 At a concentration of 5 ppm of saponin
3 One half of the wages will be for hired labour
5 One third of the wages will be for hired labour.
ANNEX 5 - Table 13
ESTIMATED UNIT OPERATING COST FOR IMPROVED FISHPONDS (TYPE C)
| Model 1 (0.75 ha) Item: | Cost (I.Rs.) | ||
| Fish Seeds1: | 205 | ||
| Catla and silver carp, | 1 350, at I.Rs. 100/1 000 | ||
| Rohu, | 338, at I.Rs. 80/1 000 | ||
| Mrigal, | 675, at I.Rs. 50/1 000 | ||
| Common carp, | 450, at I.Rs. 20/1 000 | ||
| Mahua oil cake, 300 kg, at I.Rs. 1.00/kg2 | 300 | ||
| Cow dung, 2.25 ton, at I.Rs. 50/ton | 112 | ||
| Rice or wheat bran, 375 kg, at I.Rs. 0.9/kg | 337 | ||
| Wages: 75 man-days, at I.Rs. 6.00/man-day3 | 450 | ||
| Depreciation of equipment | 100 | ||
| Interest on working capital4 | 103 | ||
| TOTAL for Model 1 | 1 607 | ||
| Model 2 (1.5 ha) Item: | Cost (I.Rs.) | ||
| Fish seeds1: | 416 | ||
| Catla and silver carp, | 2 700, at I.Rs. 100/1 000 | ||
| Rohu, | 750, at I.Rs. 80/1 000 | ||
| Mrigal, | 1 350, at I.Rs. 50/1 000 | ||
| Common carp, | 900, at I.Rs. 20/1 000 | ||
| Mahua oil cake, 600 kg, at I.Rs. 1.00/kg2 | 600 | ||
| Cow dung, 4.5 ton, at I.Rs. 50/ton | 225 | ||
| Rice or wheat bran, 0.75 ton, at I.Rs. 900/ton | 675 | ||
| Wages: 100 man-days, at I.Rs. 6.00/man-day5 | 600 | ||
| Depreciation of equipment | 100 | ||
| Interest on working capital4 | 185 | ||
| TOTAL for Model 2 | 2 801 | ||
| Model 3 (5.0 ha) Item: | Cost (I.Rs.) | ||
| Fish seeds1: | 1 365 | ||
| Catla and silver carp, | 9 000, at I.Rs. 100/1 000 | ||
| Rohu, | 2 250, at I.Rs. 80/1 000 | ||
| Mrigal, | 4 500, at I.Rs. 50/1 000 | ||
| Common carp, | 3 000, at I.Rs. 20/1 000 | ||
| Mahua oil cake, 2 000 kg, at I.Rs. 1.00/kg2 | 2 000 | ||
| Cow dung, 12 ton, at I. Rs. 50/ton | 600 | ||
| Rice or wheat bran, 2.5 ton, at I.Rs. 900/ton | 2 250 | ||
| Wages: 200 man-days, at I.Rs. 6.00/man-day3 | 1 200 | ||
| Depreciation of equipment | 250 | ||
| Interest on working capital4 | 546 | ||
| TOTAL for Model 3 | 8 211 | ||
1 On the basis of commercial price at the size of 5.0 cm, weighing 1.5 g
2 At a concentration of 5 ppm of saponin
3 Three quarters of the wages will be for hired labour
5 One half of the wages will be for hired labour.
ANNEX 5 - Table 14
ESTIMATED UNIT OPERATING COST FOR IMPROVED IRRIGATION PONDS (TYPE D)
| Model 1 (10-ha) Item: | Cost (I.Rs.) | |
| Fish seed: | 920 | |
| Catla, silver carp and grass carp, | ||
| 7 000, at I.Rs. 100/1 000 | ||
| Rohu, 1 000, at I.Rs. 80/1 000 | ||
| Mrigal, 2 000, at I.Rs. 50/1 000 | ||
| Common carp, 2 000, at I.Rs. 20/1 000 | ||
| Pumping of 2 000 m3 of water, at I.Rs. 0.16/m3 | 320 | |
| Mahua oil-seed cake, 0.75 ton, at I.Rs. 1 000/ton | 750 | |
| Guard, 9 man-months, at I.Rs. 180/man-month | 1 620 | |
| Labour, 70 man-days, at I.Rs. 6.00/man-day | 420 | |
| Maintenance1 | 1 680 | |
| Interest on working capital2 | 240 | |
| TOTAL for Model 1 | 5 950 | |
| Model 2 (25-ha) Item: | Cost (I.Rs.) | |
| Fish seed: | 2 300 | |
| Catla, silver carp and grass carp, | ||
| 17 500, at I.Rs. 100/1 000 | ||
| Rohu, 2 500, at I.Rs. 80/1 000 | ||
| Mrigal, 5 000, at I.Rs. 50/1 000 | ||
| Common carp, 5 000, at I.Rs. 20/1 000 | ||
| Pumping of 6 300 m3 of water, at I.Rs. 0.16/m3 | 1 008 | |
| Mahua oil-seed cake, 2.0 ton, at I.Rs. 1 000/ton | 2 000 | |
| Guard, 9 man-months, at I.Rs. 180/man-month | 1 620 | |
| Labour, 150 man-days, at I.Rs. 6.00/man-day | 900 | |
| Maintenance1 | 2 800 | |
| Interest on working capital2 | 580 | |
| TOTAL for Model 2 | 11 208 | |
| Model 3 (75 ha) Item: | Cost (I.Rs.) | |
| Fish seed: | 6 900 | |
| Catla, silver carp and grass carp, | ||
| 52 500, at I.Rs. 100/1 000 | ||
| Rohu, 7 500, at I.Rs. 80/1 000 | ||
| Mrigal, 15 000, at I.Rs. 50/1 000 | ||
| Common carp, 15 000, at I.Rs. 20/1 000 | ||
| Pumping of 20 000 m3 of water, at I.Rs. 0.16/m3 | 3 200 | |
| Mahua oil-seed cake, 6.0 ton, at I.Rs. 1 000/ton | 6 000 | |
| Guard, 9 man-months, at I.Rs. 180/man-month | 1 620 | |
| Labour, 300 man-days, at I.Rs. 6.00/man-day | 1 800 | |
| Maintenance1 | 4 050 | |
| Interest on working capital2 | 1 300 | |
| TOTAL for Model 3 | 24 870 | |
1 Maintenance of screens and fishing gear, and of the dikes of the fingerling-pond
ANNEX 5 - Table 15
CASH FLOW PROJECTIONS FOR REHABILITATED AND IMPROVED FISH PONDS
(in I. Rs.)
| Model 1 of Type A1 | Model 1 of Type B1 | Model 1 of Type C1 | ||||||||||
| year | year | year | ||||||||||
| 1–9 | 1 | 2–7 | 8 | 9 | 1 | 2–7 | 8 | 9 | ||||
| Cash Inflow | ||||||||||||
| Net sales2 | 1 575 | 2 625 | 2 625 | 2 625 | 2 625 | 3 937 | 3 937 | 3 937 | 3 937 | |||
| Borrowers' contribution3 | - | 938 | - | - | - | 1 337 | - | - | - | |||
| Loan amount4 | - | 2 812 | - | - | - | 4 013 | - | - | - | |||
| Total | 1 575 | 6 375 | 2 625 | 2 625 | 2 625 | 9 287 | 3 937 | 3 937 | 3 937 | |||
| Cash Outflow | ||||||||||||
| Operating cost5 | 377 | 1 010 | 1 010 | 1 010 | 1 010 | 1 607 | 1 607 | 1 607 | 1 607 | |||
| Investment cost6 | - | 3 750 | - | - | - | 5 350 | - | - | - | |||
| Debt service7 | - | - | 655 | 938 | - | - | 850 | 1 337 | - | |||
| Total | 377 | 4 760 | 1 665 | 1 948 | 1 010 | 6 957 | 2 457 | 2 944 | 1 607 | |||
| Financial Benefit/Cost | ||||||||||||
| Benefit | 1 575 | 2 625 | 2 625 | 2 625 | 2 625 | 3 937 | 3 937 | 3 937 | 3 937 | |||
| Cost | 377 | 4 760 | 1 010 | 1 948 | 1 010 | 6 957 | 1 607 | 2 944 | 1 607 | |||
| Net benefit | 1 198 | (2 135) | 1 615 | 677 | 1 615 | (3 020) | 2 330 | 993 | 2 330 | |||
| Financial Rate of Return | Over 50 percent | Over 50 percent | ||||||||||
3 25 percent of the investment cost
4 75 percent of the investment cost
ANNEX 5 - Table 16
CASH FLOW PROJECTIONS FOR REHABILITATED AND IMPROVED FISH PONDS
(in I. Rs.)
| Model 2 of Type A1 | Model 2 of Type B1 | Model 2 of Type C1 | ||||||||||
| year | year | year | ||||||||||
| 1–7 | 1 | 2–7 | 8 | 9 | 1 | 2–7 | 8 | 9 | ||||
| Cash Inflow | ||||||||||||
| Net sales2 | 3 150 | 5 250 | 5 250 | 5 250 | 5 250 | 7 875 | 7 875 | 7 875 | 7 875 | |||
| Borrowers' contribution3 | - | 1 356 | - | - | - | 1 950 | - | - | - | |||
| Loan amount4 | - | 4 069 | - | - | - | 3 400 | - | - | - | |||
| Total | 3 150 | 10 675 | 5 250 | 5 250 | 5 250 | 12 225 | 7 875 | 7 875 | 7 875 | |||
| Cash Outflow | ||||||||||||
| Operating cost5 | 1 078 | 1 764 | 1 764 | 1 764 | 1 764 | 2 801 | 2 801 | 2 801 | 2 801 | |||
| Investment cost6 | - | 5 425 | - | - | - | 5 350 | - | - | - | |||
| Debt service7 | - | - | 861 | 1 356 | - | - | 719 | 1 950 | - | |||
| Total | 1 078 | 7 189 | 2 625 | 3 120 | 1 764 | 8 151 | 3 520 | 4 751 | 2 801 | |||
| Financial Benefit/Cost | ||||||||||||
| Benefit | 3 150 | 5 250 | 5 250 | 5 250 | 5 250 | 7 875 | 7 875 | 7 875 | 7 875 | |||
| Cost | 1 078 | 7 189 | 1 764 | 3 120 | 1 764 | 8 151 | 2 801 | 4 751 | 2 801 | |||
| Net benefit | 2 072 | (1 939) | 3 486 | 2 130 | 3 486 | (276) | 5 074 | 3 124 | 5 074 | |||
| Financial Rate of Return | Over 50 percent | Over 50 percent | ||||||||||
3 25 percent of the investment cost
4 75 percent of the investment cost
5 See Tables 11, 12 and 13 of this Annex
6 See Tables 8, 9 and 10 of this Annex
ANNEX 5 - Table 17
CASH FLOW PROJECTIONS FOR REHABILITATED AND IMPROVED FISH PONDS
(in I. Rs.)
| Model 3 of Type A1 | Model 3 of Type B1 | Model 3 of Type C1 | ||||||||||
| year | year | year | ||||||||||
| 1–7 | 1 | 2–7 | 8 | 9 | 1 | 2–7 | 8 | 9 | ||||
| Cash Inflow | ||||||||||||
| Net sales2 | 10 500 | 17 500 | 17 500 | 17 500 | 17 500 | 26 250 | 26 250 | 26 250 | 26 250 | |||
| Borrowers' contribution3 | - | 3 361 | - | - | - | 4 863 | - | - | - | |||
| Loan amount4 | - | 10 089 | - | - | - | 14 587 | - | - | - | |||
| Total | 10 500 | 30 950 | 17 500 | 17 500 | 17 500 | 45 700 | 26 250 | 26 250 | 26 250 | |||
| Cash Outflow | ||||||||||||
| Operating cost5 | 3 054 | 4 663 | 4 663 | 4 663 | 4 663 | 8 211 | 8 211 | 8 211 | 8 211 | |||
| Investment cost6 | - | 13 450 | - | - | - | 19 450 | - | - | - | |||
| Debt service7 | - | - | 2 134 | 3 361 | - | - | 3 086 | 4 863 | - | |||
| Total | 3 054 | 18 113 | 6 797 | 8 024 | 4 663 | 27 661 | 11 297 | 13 074 | 8 211 | |||
| Financial Benefit/Cost | ||||||||||||
| Benefit | 10 500 | 17 500 | 17 500 | 17 500 | 17 500 | 26 250 | 26 250 | 26 250 | 26 250 | |||
| Cost | 3 054 | 18 113 | 4 663 | 8 024 | 4 663 | 27 661 | 8 211 | 13 074 | 8 211 | |||
| Net benefit | 7 446 | (613) | 12 837 | 9 476 | 12 837 | (1 411) | 18 039 | 13 176 | 18 039 | |||
| Financial Rate of Return | Over 50 percent | Over 50 percent | ||||||||||
3 25 percent of the investment cost
4 75 percent of the investment cost
5 See Tables 11, 12 and 13 of this Annex
6 See Tables 8 and 9 of this Annex
ANNEX 5 - Table 18
CASH FLOW PROJECTIONS FOR IMPROVED SMALL IRRIGATION RESERVOIRS
(in I.Rs.)
| Model 1 of Type D1 | Model 2 of Type D1 | Model 3 of Type D1 | |||||||||||||
| year | year | year | |||||||||||||
| 1 | 2–7 | 8 | 9 | 1 | 2–7 | 8 | 9 | 1 | 2–7 | 8 | 9 | ||||
| Cash Inflow | |||||||||||||||
| Net sales2 | 14 000 | 14 000 | 14 000 | 14 000 | 26 250 | 26 250 | 26 250 | 26 250 | 52 500 | 52 500 | 52 500 | 52 500 | |||
| Borrowers' contribution3 | 4 600 | - | - | - | 6 050 | - | - | - | 9 450 | - | - | - | |||
| Loan amount4 | 13 800 | - | - | - | 18 150 | - | - | - | 28 350 | - | - | - | |||
| Total | 32 400 | 14 000 | 14 000 | 14 000 | 50 450 | 26 250 | 26 250 | 26 250 | 90 300 | 52 500 | 52 500 | 52 500 | |||
| Cash Outflow | |||||||||||||||
| Operating cost5 | 6 130 | 6 130 | 6 130 | 6 130 | 11 200 | 11 200 | 11 200 | 11 200 | 24 870 | 24 870 | 24 870 | 24 870 | |||
| Investment cost6 | 18 400 | - | - | - | 35 400 | - | - | - | 37 800 | - | - | - | |||
| Debt service7 | - | 2 919 | 4 600 | - | - | 3 848 | 6 050 | - | - | 5 997 | 9 450 | - | |||
| Total | 24 530 | 9 049 | 10 730 | 6 130 | 46 600 | 15 048 | 17 250 | 11 200 | 62 670 | 30 867 | 34 320 | 24 870 | |||
| Financial Benefit/Cost | |||||||||||||||
| Benefit | 14 000 | 14 000 | 14 000 | 14 000 | 26 250 | 26 250 | 26 250 | 26 250 | 52 500 | 52 500 | 52 500 | 52 500 | |||
| Cost | 24 530 | 6 130 | 10 730 | 6 130 | 46 600 | 11 200 | 17 250 | 11 200 | 62 670 | 24 870 | 34 320 | 24 870 | |||
| Net benefit | (10 530) | 7 870 | 3 270 | 7 870 | (20 350) | 15 050 | 9 000 | 15 050 | (10 170) | 27 630 | 18 180 | 27 630 | |||
| Financial Rate of Return | Over 50 percent | Over 50 percent | |||||||||||||
1 Models 1, 2 and 3 are 10, 25 and 75 ha, respectively
3 25 percent of the investment cost
4 75 percent of the investment cost
FIGURE 1
TYPICAL LAYOUT OF A 3 HA MODEL FISH SEED FARM
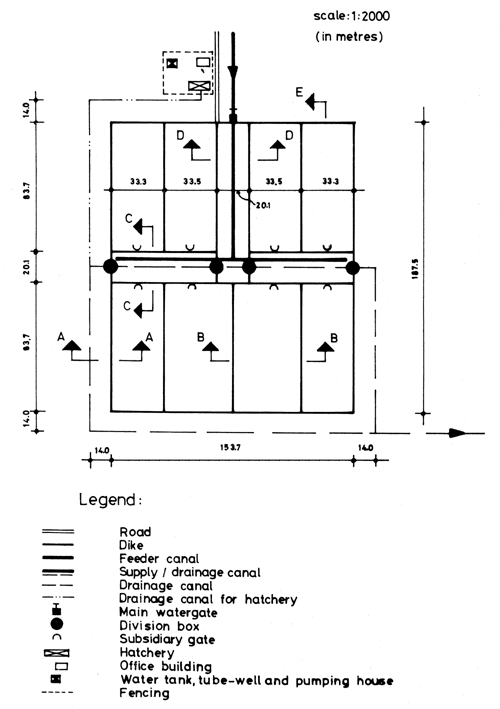
FIGURE 2
TYPICAL LAYOUT OF A 10HA MODEL FISH SEED FARM
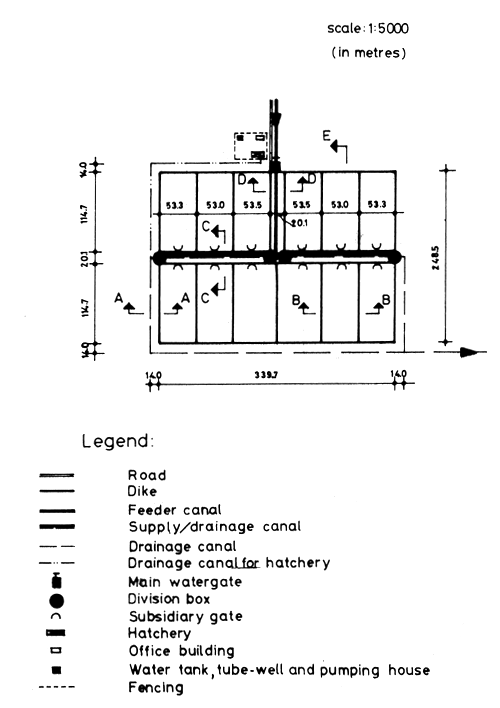
FIGURE 3
TYPICAL LAYOUT OF A 25HA MODEL FISH SEED FARM
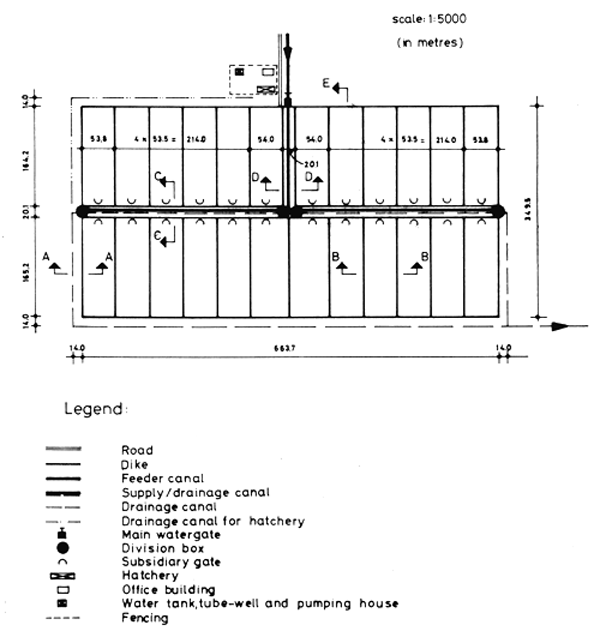
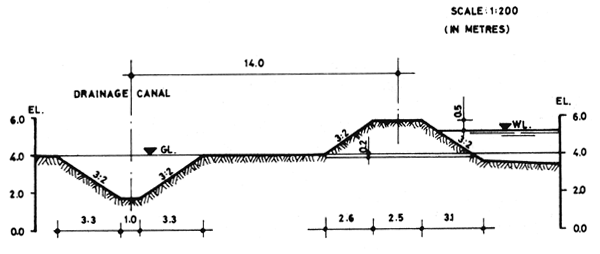
FIGURE 4
CROSS SECTION (A-A)
CROSS SECTION (B-B)
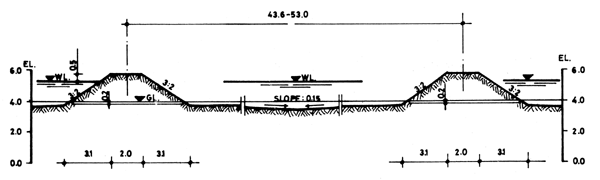
FIGURE 5
CROSS SECTION (C-C)
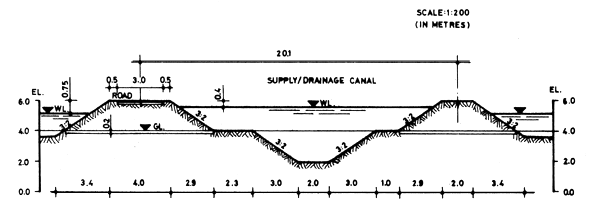
CROSS SECTION (D-D)
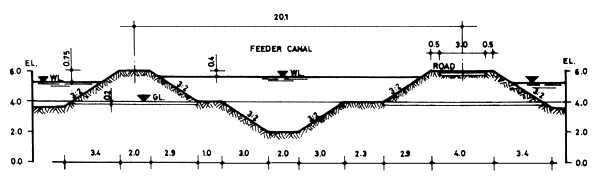
FIGURE 6
CROSS SECTION (E-E)
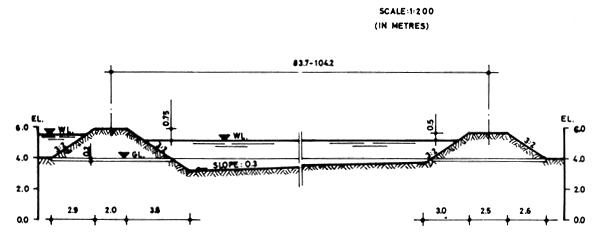
FIGURE 7
CROSS SECTION OF MAIN WATER GATE
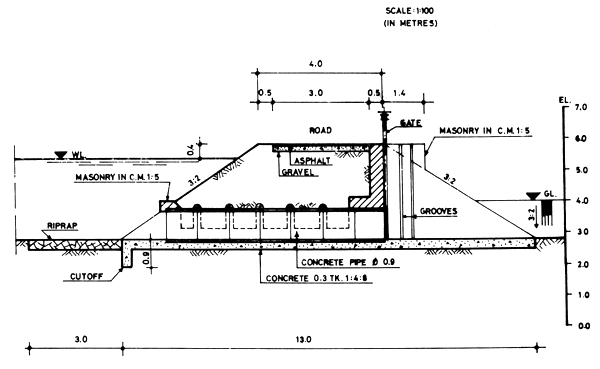
FIGURE 8
CROSS SECTION OF DIVISION BOX
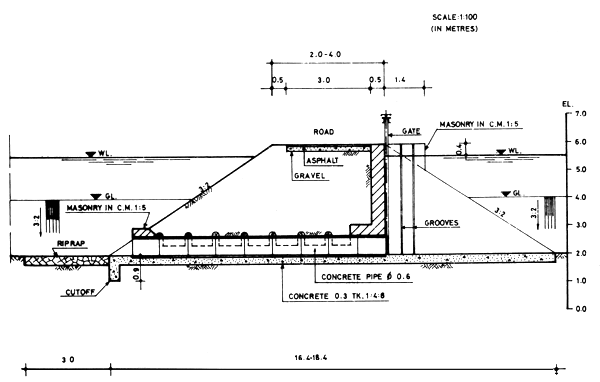
FIGURE 9
CROSS SECTION OF SUBSIDIARY GATE
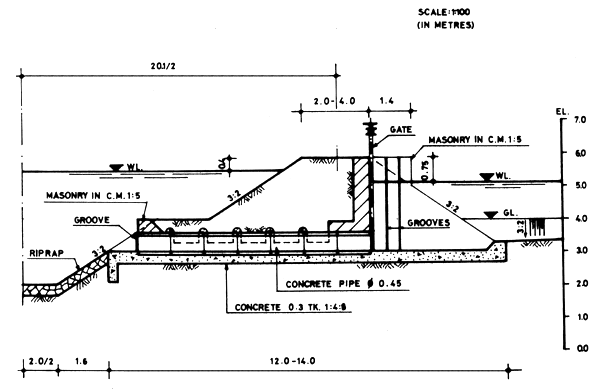
FIGURE 10
PLAN OF IN-DOOR HATCHERY FOR A 3HA MODEL FISH SEED FARM
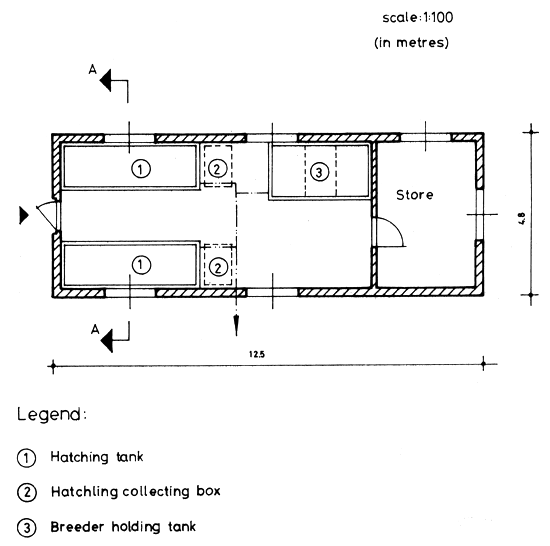
FIGURE 11
PLAN OF IN-DOOR HATCHERY FOR A 10HA MODEL FISH SEED FARM
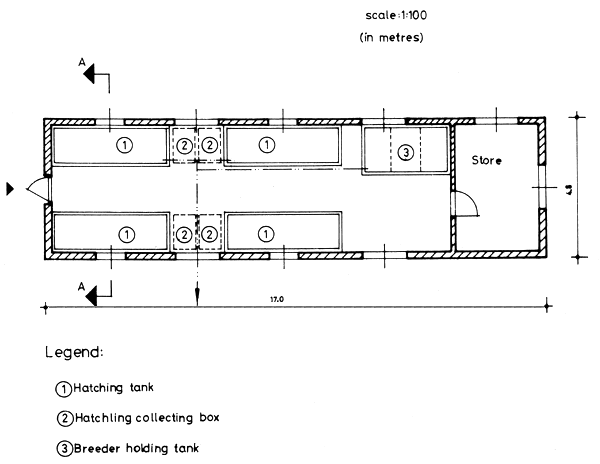
FIGURE 12
PLAN OF IN-DOOR HATCHERY FOR A 25HA MODEL FISH SEED FARM
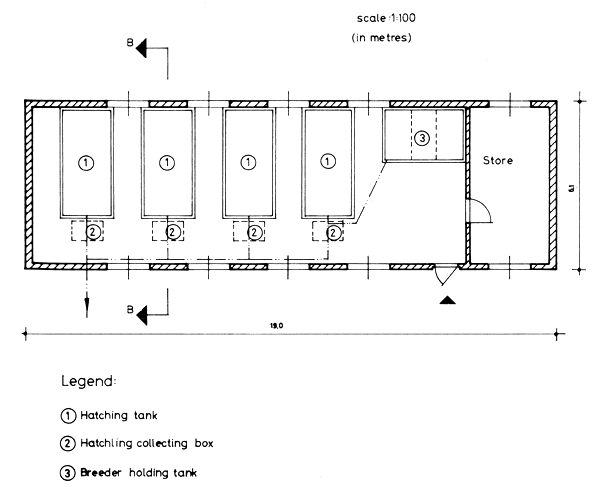
FIGURE 13
CROSS SECTION (A-A)
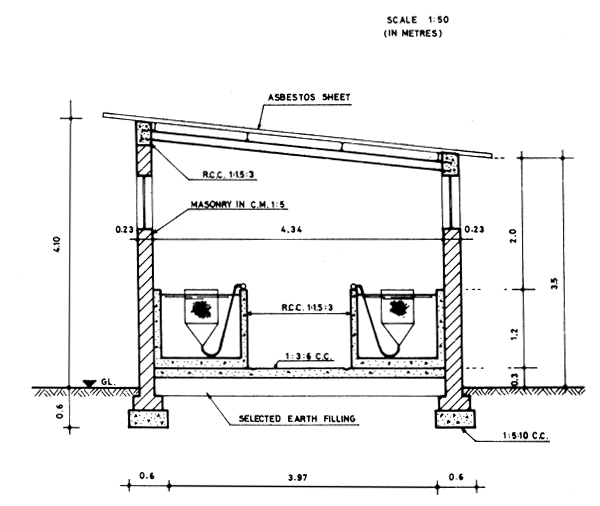
FIGURE 14
CROSS SECTION (B-B)
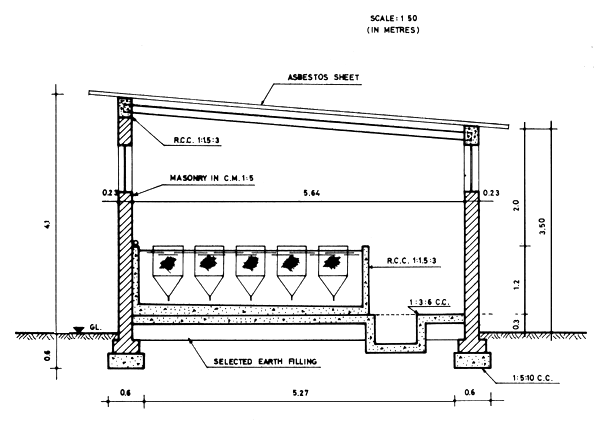
FIGURE 15
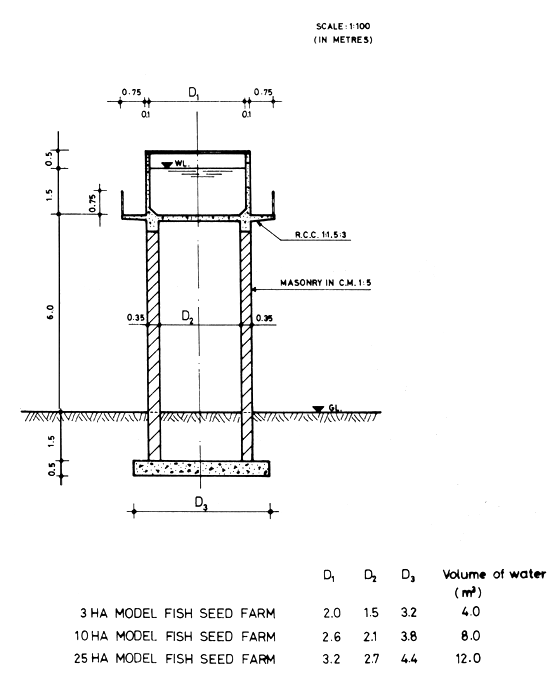
CROSS SECTION OF WATER TANK

![]()
![]()