![]()
![]()
![]()
The author can be contacted at his permanent address: 8 Boyne House, 55 Blackwater Rd, Eastbourne BN20 7DL, UK. Tel.: 1323 645993. Fax: 1323 737930.
L'auteur d�crit une m�thode d'�valuation des ressources en parcours ainsi que des possibilit�s pastorales et pr�sente une �tude de cas effectu�e au Swaziland. La m�thode, qui est compl�mentaire de celle utilis�e pour une �valuation des sols dans le but de d�terminer les possibilit�s de production v�g�tale, est fond�e sur une stratification primaire en zones agro�cologiques (ZAE) selon la g�omorphologie et le climat, et sur une classification secondaire en unit�s de v�g�tation en fonction de la nature des sols, de la topographie et du couvert v�g�tal. On cartographie les diff�rents modes d'utilisation des sols et de faire-valoir et l'on calcule les superficies dans chaque unit� de v�g�tation. Apr�s compilation des donn�es disponibles concernant le cheptel, on proc�de � une estimation des taux de charge selon le mode de faire-valoir dans chaque ZAE ou chaque unit� de v�g�tation. Un mod�le local permettant de d�terminer la capacit� de charge en fonction de la pluviosit� est mis au point � partir d'un mod�le empirique, puis modifi� en tenant compte de l'exp�rience acquise au plan local � propos des taux de charge et de l'�tat des parcours. On applique des facteurs de correction refl�tant les conditions locales existantes pour ce qui concerne la texture des sols, la pente, le couvert ligneux et l'�tat des parcours. En dernier lieu, on cr�e une base de donn�es informatis�e sur les ressources en parcours aux fins de stockage, d'analyse, d'extraction et de pr�sentation des informations disponibles.
Se describe un procedimiento para la evaluaci�n de los recursos de pastizales y el potencial de pastoreo y se presenta el estudio de un caso en Swazilandia. El procedimiento es complementario del utilizado para la evaluaci�n del potencial de producci�n de los cultivos en las tierras, y su fundamento es la estratificaci�n primaria de las zonas agroecol�gicas, basada en la fisiograf�a y el clima, y la clasificaci�n secundaria de las unidades de vegetaci�n, basada en los suelos, la topograf�a y la vegetaci�n. Se cartograf�an los tipos pertinentes de utilizaci�n y tenencia de la tierra y se calculan las zonas de cada unidad de vegetaci�n. Se recopilan los datos sobre la poblaci�n pecuaria y se estima la densidad de pastoreo en funci�n de la tenencia de la tierra en cada zona agroecol�gica o unidad de vegetaci�n. Se expone un modelo de la capacidad de carga local en funci�n de las precipitaciones, obtenido a partir de un modelo emp�rico seleccionado y ajustado de acuerdo con la experiencia local en cuanto a la densidad de pastoreo y las condiciones de los pastizales. Luego se aplican factores de correcci�n para las condiciones predominantes en el lugar en cuanto a la textura del suelo, la pendiente, la cubierta le�osa y las condiciones de los pastos. Se establece una base de datos informatizada sobre los recursos de pastizales para el almacenamiento, an�lisis, b�squeda y presentaci�n de datos.
The effective planning and management of range resources requires a sound information base, which should include:
For a number of years there had been growing concern that Swaziland's
range resources were becoming increasingly overstocked, resulting in range degradation and
soil erosion, particularly in the communal areas. In 1992, the Swaziland Government asked
FAO for a survey on and assessment of the status of the nation's range resources, for the
formulation of guidelines for reasonable stocking rates in the different ecological zones
and for recommendations on grazing management and improvement.
Consequently, a comprehensive range resources survey and assessment was undertaken in 1994
(Sweet and Dlamini, 1994) through the FAO/UNDP Project TCP/SWA/2353. This study was
conveniently able to build on the physiographic and climatic characterization work already
completed under the FAO/UNDP Project SWA/89/001 for producing guidelines on crop
production potentials.
The procedure is described below in general terms and the Swaziland case is used for
illustrative purposes. In other situations, some steps might be omitted, if considered
unnecessary or if requisite data are unavailable. It is primarily applicable for planning
at national, provincial and district levels, which encompass different agroclimatic zones
but, once developed from a broad database, it can be applied down to the production unit
level. The full procedure does, however, require reference to previously derived
relationships between annual forage production and annual rainfall (Rutherford, 1978; Le
Houerou, 1984) in comparable vegetation types as well as to an adequate information base
for physiographic and climatic (rainfall) zoning and to some reliable stocking rate data,
taken from different zones in the study area over a number of years (e.g. from commercial
ranches or research stations) and relevant to assessments of range conditions and trends.
The principal stages and steps of the procedure may be listed as follows:
1. Primary stratification of the area into
agro-ecological zones (AEZ) and secondary stratification into agro-ecological units (AEU),
based on physiographic and climatic data. Calculation of the areas of each AEZ and AEU.
2. Mapping of the principal forms of current land use, for example by
interpretation of satellite imagery and calculation of the area of each land-use type in
each AEZ or AEU.
3. Mapping of relevant types of land tenure, such as state land, private
land (freehold and/or leasehold) and communal areas. Calculation of the grazing area of
each land tenure type in each AEZ or AEU.
4. Mapping and description of vegetation, using the AEU boundaries as
vegetation boundaries. First stage classification of major vegetation types and second
stage classification of vegetation units with similar inherent grazing potential.
5. Calculation of the total areas of each vegetation unit and of the
percentages of area under the different forms of land use and land tenure.
6. Compilation and assessment of previous estimates of
carrying capacity for the major vegetation types or AEZs.
7. Compilation and analysis of stocking rate data. Determination of
livestock distribution and stocking rates by land tenure in AEZs or vegetation types.
8. Referral to empirical models of primary production and carrying
capacity derived in similar environments, particularly linear relationships between annual
forage production and annual rainfall.
9. Development of a local carrying capacity model based on a selected
empirical model and adjusted according to local knowledge of stocking rates and range
condition. Calculation of preliminary rainfall-related carrying capacities for each
vegetation unit.
10. Formulation of correction factors to make allowance for prevailing
site conditions of soil texture, slope, woody cover and range condition.
11. Refinement of the model, after incorporation of correction factors,
by comparison with known stocking rates. Calculation of corrected carrying capacity
estimates for each vegetation unit.
12. Establishment of a computerized range resources database for the storage, analysis, retrieval and presentation of data.
The first step is to decide on a stratification appropriate to the physiographic, climatic, environmental and/or vegetation data available for the study area. Ideally, physiography (landforms, geology and soils) or readily discernible terrain characteristics (e.g. topography) should be used for primary stratification; then climatic data, notably rainfall, are superimposed to demarcate agro-ecological zones or units, depending on the degree of physiographic subdivision.
1
Physiographic zones of Swaziland
Zones g�omorphologiques du Swaziland
Zonas fisiogr�fica de Swazilandia
Physiographic zone |
Area (km2) |
Altitude (m) |
Rainfall (mm) |
Geology |
Vegetation type |
High veld (HV) |
5 680 |
900-1 400 |
700-1 200 |
Granite |
Short grassland with forest patches |
Upper middle veld (UM) |
2 420 |
600-800 |
700-850 |
Granodiorite |
Tall grassland with scattered trees and shrubs |
Granite |
|||||
Lower middle veld (LM) |
2 420 |
400-600 |
550-700 |
Gneiss |
Broad- leaved savannah |
Western low veld (WL) |
3 410 |
250-400 |
450-550 |
Sandstone/claystone |
Mixed savannah |
Eastern low veld (EL) |
1 960 |
200-300 |
400-550 |
Basalt |
Acacia savannah |
Lubombo ridge (LR) |
1 480 |
250-600 |
550-850 |
Ignimbrite |
Hillside bush and plateau savannah |
In Step 2, appropriate categories of present land use are decided, for example rangeland grazing, improved pasture, large-scale cropping and small-scale mixed agriculture. These categories are then mapped from available data sources, such as interpretation of satellite imagery or aerial photographs. The boundaries are superimposed on to the AEUs and AEZs to calculate the areas of each type of land use within each ecological unit.
2
Land-use areas of agro-ecological zones
Diff�rents modes d'utilisation des sols dans les zones agro�cologiques
Tipos de utilizaci�n de la tierra en las zonas agroecol�gicas
Land-use area |
||||||||||
Agro-ecological zone |
Wildlife |
Forestry |
Urban etc. |
Ranching |
Grazing >75% |
Grazing 50-75% |
Grazing 25-50% |
Grazing <25% |
Cropland TDL1 |
Total |
(km2) |
||||||||||
HV |
201 |
1 326 |
32 |
496 |
3 225 |
266 |
82 |
30 |
11 |
5 669 |
UM |
9 |
68 |
55 |
279 |
1 559 |
217 |
70 |
37 |
121 |
2 415 |
LM |
- |
7 |
- |
580 |
943 |
615 |
171 |
44 |
63 |
2 423 |
WL |
148 |
- |
26 |
1 004 |
924 |
607 |
224 |
122 |
361 |
3 416 |
EL |
147 |
- |
12 |
642 |
383 |
119 |
15 |
190 |
455 |
1 963 |
LR |
161 |
- |
- |
328 |
740 |
86 |
93 |
48 |
28 |
1 484 |
Total |
666 |
1 401 |
125 |
3 329 |
7 774 |
1 910 |
655 |
471 |
1 039 |
17 370 |
1 TDL = Title Deed Land.
Note: For zone abbreviations, see Table 1.
In Step 3, the categories of land tenure which are considered to
influence range development or grazing management are identified and mapped. This step
requires reference material (ideally an existing map of land tenure types) or local
knowledge. The pattern of land use determined in Step 2 can also provide a useful
indicator of land tenure.
The total area available for grazing in each category of land tenure within each AEZ or
AEU is then calculated. At this stage, the estimates of areas available for grazing
include relatively inaccessible and unutilized areas such as thick bush, riverine forest
and steep slopes, but these factors are taken into account in the delineation of
vegetation units and assessment of grazing potentials (Steps 4 and 10).
3
Grazing and cropping areas available to livestock in each agro-ecological zone
Superficies herbag�res et cultiv�es accessibles au b�tail dans chaque zone
agro�cologique
Superficie de pastoreo y de cultivo disponible para el ganado en cada zona agroecol�gica
TDL grazing |
SNL grazing |
Total SNL |
||||
Agro-ecological zone |
(km2) |
(%) |
(km2) |
(%) |
(km2) |
(%) |
HV |
496 |
8.7 |
3 023 |
53.3 |
3 603 |
63.6 |
UM |
279 |
11.6 |
1 531 |
63.4 |
1 883 |
78.0 |
LM |
580 |
23.9 |
1 279 |
52.8 |
1 773 |
73.2 |
WL |
1 004 |
29.4 |
1 287 |
37.7 |
1 877 |
54.9 |
EL |
642 |
32.7 |
439 |
22.4 |
707 |
36.0 |
LR |
328 |
22.1 |
742 |
50.0 |
967 |
65.2 |
Total |
3 329 |
19.2 |
8 301 |
47.8 |
10 810 |
62.2 |
TDL = Title Deed Land; SNL = Swazi Nation Land.
Note: For zone abbreviations, see Table 1.
Step 4 is the mapping and description of the vegetation types. Where
available, existing vegetation maps should be used as a starting point but additional
fieldwork and, possibly, interpretation of satellite imagery or aerial photos, is likely
to be necessary. An appropriate classification system is selected and all AEUs
characterized accordingly, so that equivalent AEUs sharing the same vegetation type are
classified as the same vegetation unit (VU). If desired, the nomenclature can be modified
after fieldwork is complete, to reflect the physiography of the VUs better.
The objective is to distinguish units which are functionally different in respect of their
inherent grazing potential rather than their botanical composition only. The vegetation
units are based on climatic, topographic and soil characteristics as well as on
vegetation, and the same plant species may occur in more than one VU.
4
Summary of vegetation units
R�capitulatif des unit�s de v�g�tation
Resumen de las unidades de vegetaci�n
Vegetation unit |
Dependable rainfall (mm) |
Topography |
Slope(%) |
Soils1 |
Classification |
H1 |
850-1 000 |
Steeply dissected rock outcrops, partly mountainous |
>30 |
U,TH,N |
High veld steep hill and mountain grassland |
H2 |
850-1 000 |
Hilly to undulating |
10-30 |
U,N,SH,M |
High veld hill grassland |
H3 |
700-850 |
Steep hills |
>30 |
U,O,N,TH |
High veld steep hill grassland |
... |
... |
... |
... |
... |
... |
... |
... |
... |
... |
... |
... |
L1 |
450-550 |
Steeply dissected escarpment |
>30 |
U |
Lubombo steep escarpment bush |
L2 |
600-800 |
Undulating plateau |
5-15 |
L,O,U |
Lubombo plateau bush clump |
L3 |
550-700 |
Hilly eroded plateau |
15-30 |
O,U |
Lubombo plateau broad-leaved savannah |
1 Soil classification is after Murdoch (1970).
In Step 5, the total areas of each unit and the percentages (or actual
areas) under each form of land use are calculated. Estimates of the grazing areas
according to land tenure can similarly be derived for each VU.
For the purpose of stocking rate and carrying capacity assessments in communal areas, the
postharvest availability of crop and fallow land should be considered. However, the ratio
of cultivation area to grazing land is also important in determining whether feed
availability is more likely to be a constraint during the growing season (summer) or the
dry season (winter).
5
Land use in vegetation units
Modes d'utilisation des sols par unit� de v�g�tation
Utilizaci�n de la tierra en las unidades de vegetaci�n
Vegetation unit |
Area of unit (km2) |
Percentage of area under each form of land use |
||||||||
Wildlife |
Forestry |
Ranching |
Grazing >75% |
Grazing 50-75% |
Grazing 25-50% |
Grazing <25% |
Cropland TDL |
Total |
||
H1 |
838 |
21.7 |
12.9 |
0.1 |
64.5 |
0.4 |
0.0 |
0.0 |
0.0 |
100 |
H2 |
1 695 |
1.1 |
40.2 |
5.2 |
48.5 |
2.4 |
0.9 |
0.0 |
0.0 |
100 |
H3 |
1 484 |
0.0 |
15.9 |
20.5 |
59.9 |
3.0 |
0.6 |
0.0 |
0.0 |
100 |
.. |
.. |
.. |
.. |
.. |
.. |
.. |
.. |
.. |
.. |
.. |
.. |
.. |
.. |
.. |
.. |
.. |
.. |
.. |
.. |
.. |
.. |
L1 |
195 |
0.0 |
0.0 |
29.4 |
62.7 |
0.3 |
4.3 |
2.7 |
0.6 |
100 |
L2 |
418 |
0.5 |
0.0 |
24.0 |
33.8 |
18.7 |
15.8 |
6.1 |
1.1 |
100 |
L3 |
663 |
17.6 |
0.0 |
16.4 |
63.2 |
1.1 |
0.0 |
0.6 |
1.0 |
100 |
Total |
17 370 |
3.8 |
8.1 |
19.2 |
44.7 |
11.0 |
3.8 |
2.7 |
6.0 |
100 |
TDL = Title Deed Land.
Step 6 is the compilation and assessment of previous estimates of carrying capacity for the study area. These are valuable for helping to refine or validate the carrying capacity model and can come from a variety of sources. There may have been previous studies or recorded estimates. If not, information on acceptable stocking rates in the main physiographic or vegetation zones should be collected from knowledgeable individuals, such as good ranchers.
Step 7 is the compilation and analysis of all available livestock population data for the current year and for previous years of particular interest for the purpose of building up a detailed picture of livestock distribution and stocking rates and obtaining an indication of population trends. These data will be used for comparison with carrying capacity estimates. The comprehensiveness and locational precision of the population data will determine the maximum level (e.g. AEZ or VU) to which stocking rate estimates can reasonably be applied. Records from freehold/leasehold (private and commercial) enterprises are normally readily obtainable. Dipping records, where they exist, are likely to be the prime source of information on stock numbers and distributions for communal areas.
6
Stocking rates by land tenure in the agro-ecological zones
Taux de charge par mode de faire-valoir dans les diff�rentes zones agro�cologiques
Densidad de pastoreo por tipos de tenencia de la tierra en las zonas agroecol�gicas
Agroecological zone |
Tenure |
Area |
1993 |
1992 |
1982 |
|||
LSU (`000) |
ha/LU |
LU (`000) |
ha/LU |
LU (`000) |
ha/LU |
|||
HV |
TDL |
496 |
28.6 |
1.7 |
24.3 |
2.0 |
13.6 |
3.7 |
SNL |
3 023 |
93.4 |
3.2 |
101.4 |
3.0 |
81.2 |
3.7 |
|
SNL+ |
3 603 |
93.4 |
3.9 |
101.4 |
3.6 |
81.2 |
4.4 |
|
MV |
TDL |
859 |
55.6 |
1.5 |
46.7 |
1.8 |
36.1 |
2.4 |
SNL |
2 810 |
154.2 |
1.8 |
167.8 |
1.7 |
144.0 |
2.0 |
|
SNL+ |
3 656 |
154.2 |
2.4 |
167.8 |
2.2 |
144.0 |
2.5 |
|
LV |
TDL |
1 646 |
38.6 |
4.3 |
35.7 |
4.6 |
37.2 |
4.4 |
SNL |
1 726 |
147.5 |
1.2 |
234.1 |
0.7 |
128.1 |
1.3 |
|
SNL+ |
2 584 |
147.5 |
1.8 |
234.1 |
1.1 |
128.1 |
2.0 |
|
LR |
TDL |
328 |
7.7 |
4.2 |
5.0 |
6.5 |
4.3 |
7.7 |
SNL |
742 |
18.3 |
4.1 |
29.1 |
2.5 |
23.5 |
3.2 |
|
SNL+ |
967 |
18.3 |
5.3 |
29.1 |
3.3 |
23.5 |
4.1 |
|
Total |
TDL |
3 329 |
130.5 |
2.6 |
111.8 |
3.0 |
91.1 |
3.7 |
SNL |
8 301 |
413.3 |
2.0 |
532.4 |
1.6 |
376.7 |
2.2 |
|
SNL+ |
10 810 |
413.3 |
2.6 |
532.4 |
2.0 |
376.7 |
2.9 |
|
TDL = Title Deed Land, grazing area only; SNL = Swazi Nation Land, grazing
area only; SNL+ = total SNL area.
Note: For zone abbreviations, see Table 1.
In Step 8, reference is made, through literature and research stations,
to previous studies of relationships between annual forage production and annual rainfall
in similar agro-ecological or vegetational zones. A number of linear relationships between
annual forage production and annual rainfall have been demonstrated, particularly in
regions with less than 500 to 600 mm annual rainfall, but at higher rainfalls (>800 to
1 000 mm) there are departures from linearity (Rutherford, 1978). These effects,
however, are reduced by the diminishing marginal response in forage production and
carrying capacity to successive equal increments of rainfall. For example, a 100 mm
increase in annual rainfall from 200 to 300 mm effects a 50 percent increase in forage
production, but a change from 1 000 to 1 100 mm effects only a 10 percent
increase.
The relationships are influenced by vegetation type, range condition and soil fertility.
It is therefore desirable to use more than a single model for a variety of soil and
vegetation types but the level of information detail required is seldom available and, in
practice, an allowance for soil and vegetation characteristics can be incorporated into
the site correction factors (Step 10).
The majority of the relationships are of the form:
y = a + bx
where y is the herbage annual dry matter production (kg/ha), x is the annual rainfall (mm),a and b are constants.
However, they can be simplified to straightforward expressions of kg of annual dry matter production per mm of annual rainfall (the water-use efficiency).
In Step 9, a preliminary carrying capacity model is developed from the selected water-use efficiency value. The objective is a direct relationship between annual rainfall and recommended stocking rates (carrying capacity) but the intermediate steps of estimating the annual dry matter intake requirements per LU, the edible fractions and the acceptable plant removal fractions need to be included unless usable direct relationships already exist. These intermediate steps are very much a means to an approximate end and their accuracy is not critical, provided calibration of some of the resultant carrying capacity estimates is possible from stocking rate data. To allow for interannual rainfall variation, the minimum annual rainfall that can be expected with a certain probability (e.g. 70 or 80 percent) can be used in the calculations.
Step 10 is the formulation and application of correction factors to make allowances for the influence of prevailing site conditions of soil texture, slope, woody cover and range condition on recommended stocking rates in each VU. They should be additive so that they can be applied separately or in combination. Normally they imply a constraint and are used to increase the area required per animal above the rainfall-related estimate for average conditions. However, upward correction for above-average soil fertility or range condition is also possible. The slopes and soils are permanent features so the appropriate corrections can be applied to the whole of the VU. However, range condition and bush density are normally management-related and the corrections should be applied only to the locations where they are applicable. The site correction factors developed for Swaziland are shown below.
Constraint |
Correction factor |
Slopes 15-30% |
0.15 |
Slopes >30% |
0330 |
Moderately stony, sandy or erodible soils |
0.15 |
Very stony, sandy or erodible soils |
0.30 |
Moderately dense bush (30-40% cover) |
0.30 |
Dense bush (40-60% cover) |
0.50 |
Range condition poor |
0.25 |
Range condition very poor |
0.50 |
The correction factors were applied by multiplying the number of ha per LU by [1 + the sum of the correction factors]. For example, applying a total correction factor of 0.6 to a standard stocking rate (SR) of 2 ha/LU
Adjusted SR = standard SR x [1 + correction factor]
= 2 x 1.6
= 3.2 ha/LU
The final step in development of the model is refinement, by minor
adjustments of the stocking rate constant, to improve the matching of the model estimates
(with correction factors applied) to known appropriate stocking rates or reliable previous
carrying capacity estimates in the region. The present procedure of classifying VUs is
likely to produce more units than previously used in carrying capacity estimations, hence
selective matching is necessary. The product of this step is the working model, which is
used for planning purposes. However, the stocking rate constant and any of the correction
factors can be modified according to experience to improve the model further.
From the working model, the rainfall-related recommended stocking rates for each VU are
listed and the correction factors for slope and soil applied to give the preliminary
adjusted stocking rate recommendations. These represent the current best estimate of
grazing potential for each unit, assuming reasonable range condition and mod-erate bush
density, and can be circulated to all planning sections. For a site-specific application
of the estimates, the local site conditions of range condition and woody plant cover must
be included. Where a grazing area overlaps two or more VUs, the overall stocking rate
(total number of livestock recommended) can be determined from a pro rata allocation. The
nature of the VU classification (Table 4) is highly amenable to the selective aggregation
of units sharing similar characteristics, should the individual VUs be considered too
small for particular planning purposes.
7
Stocking rate (SR) recommendations for each vegetation unit (VU)
Recommandations concernant le taux de charge pour les diff�rentes unit�s de v�g�tation
Recomendaciones sobre la densidad de pastoreo para cada unidad de vegetaci�n
Correction factors |
|||||||
Vegetation unit |
Dependable rainfall |
Rainfall-related stocking rate |
Slope |
Soil |
Bush |
Range condition |
Preliminary adjusted stocking
rate |
H1 |
850-1 000 |
1.5- 1.8 |
0.30 |
... |
... |
... |
2.0-2.3 |
H2 |
850-1 000 |
1.5-1.8 |
0.15 |
... |
... |
... |
1.7-2.1 |
H3 |
700-850 |
1.8- 2.2 |
0.30 |
... |
... |
... |
2.3-2.9 |
... |
... |
... |
... |
... |
.. |
.. |
... |
... |
... |
... |
... |
... |
... |
... |
... |
L1 |
450-550 |
2.8- 3.4 |
0.30 |
0.30 |
0.50 |
5.9-7.1 |
|
L2 |
600-800 |
1.9- 2.6 |
... |
... |
1.9-2.6 |
||
L3 |
550-700 |
2.2-2.8 |
0.15 |
0.15 |
2.9-3.6 |
||
Correction factors for local site conditions of current range condition and bush density must be included for the final adjusted stocking rate recommendations.
Step 12 is the establishment of a computerized information system for
the storage, analysis, retrieval and presentation of the range resources data. Ideally
this should include a GIS for interactive processing of different thematic layers. The
combined system should enable easy updating or modification of data as new information
becomes available or situations change.
In Swaziland, the range resources data were incorporated into the information system
developed by the FAO Land Use Planning Project SWA/89/001, comprising the following
components:
A database management system (D Base III+ compatible) for entry, storage,
processing and retrieval of data and its presentation in tabular form. The range and
livestock databases included:
A raster-based GIS package, IDRISI, for spatial analysis and map production. The thematic layers relevant to range resources included:
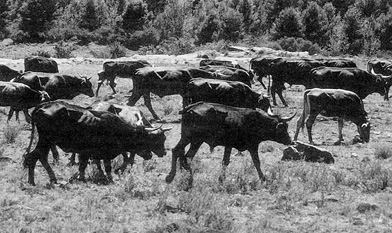
A typical scene in the highlands of Swaziland
Une sc�ne typique des hautes terres du Swaziland
Escena t�pica en las tierras altas de Swazilandia
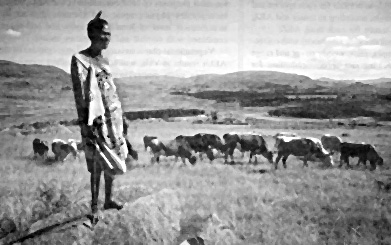
A Swazi herder viewing the land while taking care of his animals
Un gardien de troupeau swazi contemple l'horizon en surveillant ses animaux
Un pastor swazi observa las tierras mientras cuida de sus animales
Range resource assessments tend to be conducted in isolation from land evaluations for other forms of agricultural development, even where grazing areas and arable areas are interspersed. Two consequences of traditional procedures are:
With a little foresight and planning, a more systematic procedure could
be followed to provide a framework for multipurpose land evaluation. The basic unit
appropriate for most purposes of land evaluation is the AEU, which incorporates
physiographic and climatic data to the stratification level of local topography and soil
types, combined with rainfall and temperature means.
Vegetational characterization (and aggregation) of the AEUs results in VUs, which are the
smallest appropriate mapping units portraying similar characteristics of physiography,
climate and vegetation and, hence, inherent grazing potential. The VUs are thus the most
appropriate units for the estimation of carrying capacities and for range resource
inventory. A suggested hierarchical structure for deriving VUs is shown in Figure 1.
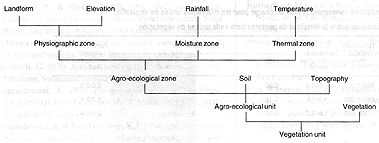
1
Suggested hierarchical structure for vegetation units
Structure hi�rarchique sugg�r�e pour les unit�s de v�g�tation
Estructura jer�rquica propuesta para las unidades de vegetaci�n
The procedure outlined in this paper presents a logical framework of land evaluation for rangeland resources, building on the stratification required for assessment of crop production potentials. It is suggested that this procedure could be usefully applied more widely in development projects, particularly in areas of high physiographic and topographic variability.
Camp, K.G.T. & Smith, J.M.B. 1991. Veld management planning
in Natal. Extension bulletin. Pietermaritzburg, Natal Region Department of
Agricultural Development, South Africa.
Le Houerou, H.N. 1984. Rain use efficiency: a unifying concept in arid land
ecology. J. Arid Environ., 7: 213-247.
Murdoch, G. 1970. Soil and land classification in Swaziland. Mbabane,
Swaziland Ministry of Agriculture.
Remmelzwaal, A. 1993. Physiographic map of Swaziland. SWA/89/001 Field
Document No. 4. Mbabane, FAO/UNDP/Swaziland Ministry of Agriculture and Cooperatives.
Remmelzwaal, A. & Van Waveren, E.J. 1994. Agro-ecological analysis of
Swaziland. Part A. Land resources: The agro-ecological map. Mbabane,
FAO/UNDP/Swaziland Ministry of Agriculture and Cooperatives.
Rutherford, M.C. 1978. Primary production ecology in southern Africa. In
M.J.A. Werger, ed. Biogeography and ecology of southern Africa. Vol. 1. The Hague,
W. Junk.
Sweet, R.J. & Dlamini, S. 1994. Range resources and grazing potentials in
Swaziland. TCP/SWA/2353 Field Document No. 1. Mbabane, FAO/UNDP/Swaziland Ministry of
Agriculture and Cooperatives.
Van Waveren, E.J. & Nhlengetfwa, J.V. 1992. Agroclimatic characterization of
Swaziland. SWA/89/001 Field Document No. 2. Mbabane, FAO/UNDP/Swaziland Ministry of
Agriculture and Cooperatives.
![]()
![]()
![]()