![]()
![]()
![]()
8.1.1 The analysìs concerned Ghana and Côte d'Ivoire; four annual abundance indices were defined (Table 9).
based on Ghanaian seiners
The calculation of annual CPUE taking available effort as the number of fishing trips for each individual month, is as follows:
Annual CPUE = 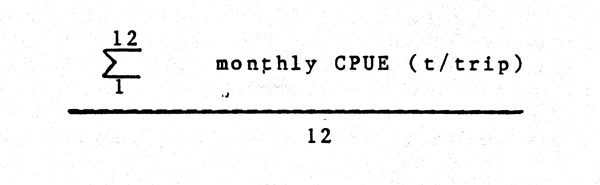
based on Côte d'Ivoire seiners
With catches and time to fishing ground compiled per fortnight for each sector, the annual CPUE is calculated as follows:
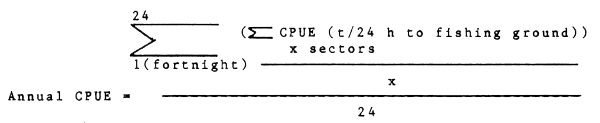
NOTE: 1 < × < 5 sectors
Sectoral/fortnightly CPUEs whose effort values are below the lower limit are considered as missing data.
based on Ghanaian Poli/Ali canoes
With monthly data available on catches per fishing trip, the annual CPUE is calculated as follows:
Annual CPUE = 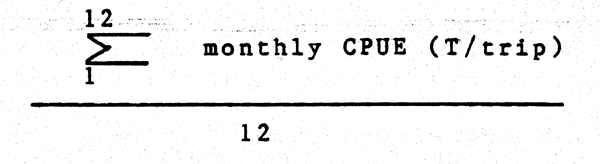
based on Côte d'Ivoire Poli/Ali canoes
Annual CPUEs were calculated by Mr Ecoutin (of ORSTOM) who will be requested to explain the methodology he used.
8.1.2 The two Ghanaian CPUEs between 1972 and 1986 (Table 9 and Figure 14) follow the same pattern. With samples of sardinella boats and Poli/Ali canoes being independent, a reasonable assumption is that the calculated trends reflect abundance fluctuations in the EEZ of Ghana.
For the six years available, the two Côte d' Ivoire CPUEs follow the same pattern (Figures 15) and therefore lead to the same conclusions.
On this basis, which is considered as sound, it is possible compare trends in Côte d' Ivoire and Ghana. Between 1972 and 1976 catches by purse seiners follow the same trend (according to Ph. Cury, the high value of 1974 is an artefact arising from the calculation method used). From 1976 to 1981, inverse trends are observed: CPUE reaches a high level in Ghana whilst up to 1980 it remains at its lowest level in Côte d'Ivoire, then from 1980 to 1986 trends are similar again and CPUEs rise to very high levels particularly in Côte d'Ivoire.
This dual characteristic (parallel and opposite trends) does not preclude the assumption of one single stock, a possible explanation being the “basin” theory as explained in subsequent paragraphs by Ph. Cury. To pursue the analysis further, the classes of size of fish caught in Côte d'Ivoire and Ghana should be considered for each of the above years. The fundamental reasons of the relative 1984 collapse in abundance throughout the region are probably complex, given the high levels (Indices 26 to 30) reached by the 1982–86 upwellings.
From 1980 to 1984, adequate samplings were taken to calculate the size frequency in beach seine catches. The results show that juveniles of 2–9 cm (6 cm average value) are caught with this gear throughout the year. The beach seine is therefore to be considered as a good sampling means in relation to recruitment. The difficulty lies in the fact that abundance values as revealed by the beach seine CPUE are obtained by multiplying actual abundance and availability within the area where beach seines are utilized, this gear having very limited accessibility capacity. CPUE is therefore highly variable and it is quite frequent to obtain null values falling between two very high values (Figure 16). In order to obtain the annual CPUE average value representing recruitment abundance, a moving average over a three-month period should be calculated; this would give smooth monthly values.
NOTE: it is more advisable to proceed on a weekly basis in order to avoid concealing intra-monthly availability fluctuations.
Beach seine CPUEs gave high levels of recruitment in 1976, 1977, 1978, 1983, 1984, 1985, 1986 (Figure 16). Comparison of the fluctuations of these “recruitment indices” and abundance values calculated for other fishing gears, shows that they are synchronous. A strong correlation is revealed between fluctuations of upwelling and of recruitment as from 1977 (Figure 17). Prior to 1977, the effect of the collapse of the stock is the non-response of recruitment to upwelling (1972–77). Total catch, which represents the good condition of a stock and its availability, is probably translated in the upwelling index of the current year (availability) and the upwelling index of the previous year (recruitment).
Concerning this species, Côte d'Ivoire and Ghana have data on catches, effort and CPUE for several years. In general, and up to 1982, the average annual CPUEs of the semi-industrial fishery of Ghana and industrial fishery of Côte d'Ivoire follow more or less the same trend (Figure 18). Most certainly, the two curves would be much closer if expressed in the same effort unit and to the nearest scale factor. After 1981, the trends are no longer comparable, particularly because the high catch values of 1983 for Côte d'Ivoire were not reached in Ghana.
CPUEs of the artisanal fishery (expressed in kg/trip) are represented in Figure 19. In Ghana and for the period 1972–1982, the beach seine and the industrial CPUEs follow nearly the same trend. With respect to Côte d'Ivoire, the only annual CPUEs available concern the Watsa nets used in Vridi; these were probably the first two years of utilization of this technique (1979 and 1980) introduced in 1979; therefore, results are just mentioned here. Over the same period, the Poli/Ali/Watsa nets used in Ghana exhibit different CPUE trends. The best yields were obtained in 1973, 1975 and 1985. The value of catches per trip for the surface setnet (a floating gillnet) is only mentioned here; this value shows high variability and its order of magnitude is minor (0.7–7.2 kg/trip).
CPUEs of Togo and Benin are not indicated but are represented Table 10. There is agreement between catches per trip values relating to beach seines and sardinella (Ali) nets in Benin and Poli/Ali/Watsa nets in Ghana for the years 1985–1986.
![]()
![]()
![]()