![]()
![]()
![]()
W.T. White1, Fahmi2, Dharmadi3 and I.C. Potter1
1Centre for Fish and Fisheries Research
Murdoch University
Murdoch 6150, Perth, Australia
<[email protected]>
2Research and Development Centre for Oceanology
LIPI, Jl. Pasir Putih I, Ancol Timur, P.O. Box 4801/JKTF
Jakarta 11048, Indonesia
3Pusat Riset Perikanan Tangkap
Jl Pasir Putih I, Ancol Timur, Jakarta 14430, Indonesia
1. INTRODUCTION
Indonesia has one of the richest elasmobranch faunas and the largest chondrichthyan fishery in the world, with an estimated 87138t and 100000 t landed in 1993 and 1996, respectively (Bonfil 1994, Monintja and Poernomo 2000, Widodo 2000). However, there are few data on the species or size composition of these landings. The only information available on the catches of individual species is that provided by pelagic tuna fishers, who estimated that in 1999 they landed 5 217 tonnes of mako sharks (Isurus paucus and I.oxyrinchus) and 47079 tonnes of other species (Priyono 2000). The high diversity of the elasmobranch fauna in Indonesia has been well documented by Gloerfelt-Tarp and Kailola (1984), Last and Stevens (1994) and Carpenter and Niem (1998, 1999). These authors highlighted the need for research in certain areas and in particular the acquisition of sound taxonomic data so that the various species could be readily identified and reliable data could be obtained for the geographical distribution and biology of many of the species.
All of the body parts of landed elasmobranchs are used. The flesh, which is often dried, is used for local consumption whereas the fins are dried and exported to other Asian countries where they are highly valued (Chen 1996). Squalene oil from the livers of some shark species (mainly squaloids) is also commonly exported with several companies in Indonesia exporting as much as 48000 kg of liver oil annually (Chen1996). Other exported shark products include the dried cartilage of larger individuals and there is a growing demand for specialist products at particular locations, such as the gill rakers of mobulid rays. The flesh of shark and rays are typically salted and dried and used for human consumption within Indonesia or exported.
The first detailed assessment of the compositions and relative abundances of species of chondrichthyans in the target and non-target fisheries of eastern Indonesia was conducted between April 2001 and December 2003. This project, which was funded by the Australian Centre for International Agricultural Research (ACIAR), involved staff at Murdoch University and the CSIRO Marine Research laboratories in Australia and the Indonesian Institute of Sciences (LIPI) and Research Institute of Marine Fisheries (RIMF) in Indonesia.
2. METHODS
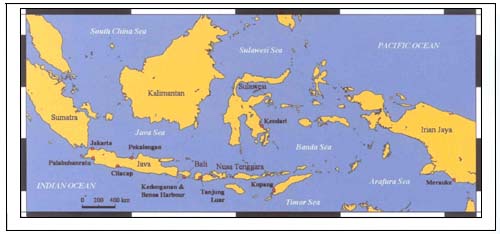
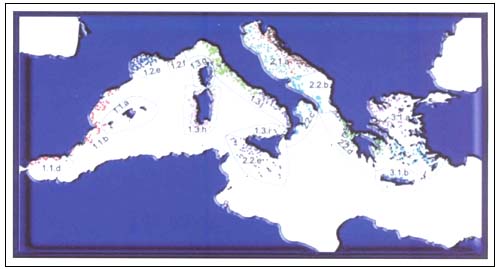
A total of nine survey trips were undertaken between April 2001 and February 2003 in eastern Indonesia. Ten sites were surveyed on at least one occasion and six sites were surveyed on more than one occasion on most trips (Figure 1). The catches of deep-sea chondrichthyan fisheries were observed at four landing sites, i.e. Palabuhanratu (West Java), Cilacap (Central Java), Kedonganan (Bali) and Tanjung Luar (Lombok).
FIGURE 1
Distribution of survey sites in Indonesia
The initial focus was on determining which chondrichthyan species were present in the landings present on that day. The species were identified using the keys and, or, illustrations in Carpenter and Niem (1998, 1999), Compagno (1984) and Last and Stevens (1994). However, when a species was not recorded in the above keys, it was assigned to its appropriate genus and provided with an appropriate temporary name. Whenever possible, those species that could not be accurately identified using the above references were purchased and stored in plastic holding tanks containing 10percent formalin for subsequent identification. Information on the gear characteristics and the duration and location of each fishing trip was also collected.
3. RESULTS
Summary of results of overall survey data
A total of 19573 individual chondrichthyan were recorded throughout the project, representing 139 chondrichthyan species, of which 78 were sharks belonging to 16families, 60 were rays belonging to 11 families and one species of chimaera. As many as 20 of these species appear to be undescribed. A reference collection of approximately540 specimens representing 106 of the 139species recorded was established during the project and these are currently stored in Jakarta, Indonesia or Hobart, Australia.
Target chondrichthyan fisheries, which are mainly artisanal, use a variety of fishing methods, such as gillnets, trammel nets, purse seines, longlines and droplines. The fisheries that land substantial catches of elasmobranchs as a bycatch include the prawn and fish fishery exploited by commercial trawlers and pelagic tuna fisheries. Deep-sea longlining for chondrichthyans primarily targets squaloids.
Deepwater longlining for squaloids
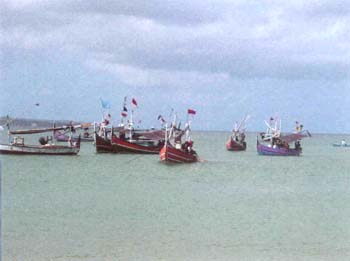
The length of the lines used in this fishery vary among the four sites with fishers at Kedonganan using short lines (~200 m in length) and those at Tanjung Luar using much longer lines (~5000 m in length). The longlines are set in depths of 150 to 600m, with the majority of fishing occurring in depths of less than 300 m. No fishing occurring in depths greater than 600m. The duration of the fishing trips also varies, with boats in Palabuhanratu spending only one or two days at sea while those in Tanjung Luar spend 7–14 days at sea. The number of boats involved in this fishery is low, i.e. two or three at Kedonganan and Palabuhanratu and about 5–10 in Tanjung Luar and Cilacap. These boats are all less than 15 m in length and usually have poor, if any, depth-sounding equipment (Figure 2).
FIGURE 2
Typical fishing boats at the landing site and market of
Kedonganan, Jimbaran Bay in the south of Bali
The fishery for squaloids appears to be highly seasonal, peaking in January to March at Kedonganan and in March to July at the other three sites. At both Cilacap and Tanjung Luar, there is significantly less fishing effort in the off season while in Palabuhanratu and Kedonganan, there is similar fishing effort all year round.
Deepwater chondricthyan species composition
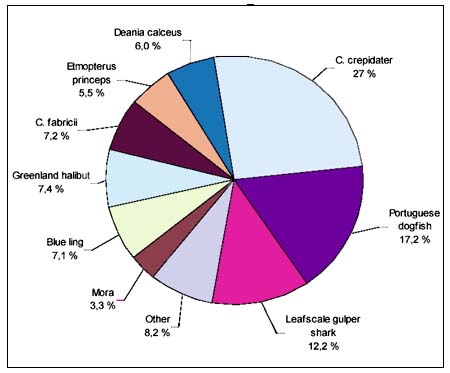
A total of 717 individual deepwater chondrichthyans were recorded, which represents only about 3.8 percent of all chondrichthyans observed during the project. A total of 22 species were recorded, consisting of 19 shark species representing six families, two ray species representing two families and a single chimaera species (see Table 1). The Squalidae and Centrophoridae were the most speciose and abundant families in the catches. The most abundant species by far was Squalus sp. 3 (short snout, v-shaped D2), which comprised ~51 percent of the total number of deepwater chondrichthyans recorded. The next most abundant species were Centrophorus cf acus (11 percent), Hydrolagus sp. 1 (9 percent) and Squalus sp. 1 (8percent) (Figure 3).
Table 1
Numbers and minimum and maximum sizes of all chondrichthyans recorded in the catches of the artisanal deep-sea longline
fishery in eastern Indonesia between April 2001 and February 2003
| Size refers to total length unless otherwise noted as disc width, i.e. DW. | ||||
| Family | Species | Number recorded | Minimum size (mm) | Maximum size (mm) |
| Hexanchidae | Heptranchias perlo | 14 | 750 | 980 |
| Hexanchus griseus | 7 | 2190 | 3750 | |
| Hexanchus nakamurai | 2 | 950 | 1070 | |
| Squalidae | Cirrhigaleus barbife | 2 | 800 | 995 |
| Squalus sp. 1 | 56 | 450 | 945 | |
| Squalus sp. 3 | 373 | 420 | 780 | |
| Squalus cf sp. C [Last & Stevens, 1994] | 24 | 520 | 870 | |
| Squalus sp. E [Last & Stevens, 1994] | 10 | 460 | 600 | |
| Centrophoridae | Centrophorus cf acus | 80 | 540 | 1640 |
| Centrophorus cf atromarginatus | 7 | 600 | 802 | |
| Centrophorus cf lusitanicus | 5 | 840 | 930 | |
| Centrophorus cf moluccensis | 8 | 540 | 1070 | |
| Centrophorus sp. (brown, longnose) | 4 | 970 | 1010 | |
| Centrophorus sp. (big eye) | 7 | 600 | 750 | |
| Centrophorus sp. 1 (longnose) | 4 | 520 | 850 | |
| Pseudocarchariidae | Pseudocarcharias kamoharai | 36 | 514 | 1060 |
| Scyliorhinidae | Cephaloscyllium sp. E [FAO, WCP] | 4 | 605 | 670 |
| Parmaturus cf melanobranchias | photo only | - | - | |
| Triakidae | Iago garricki | 1 | 650 | 650 |
| Rajidae | Dipturus cf sp. I [Last & Stevens, 1994] | 4 | 770 DW | 1190 DW |
| Plesiobatidae | Plesiobatis daviesi | 7 | 287 DW | 1170 DW |
| Chimaeridae | Hydrolagus sp. 1 | 62 | 530 | 880 |
FIGURE 3
Frequency distribution of species recorded
Taxonomic related issues
One or more variants of a number of species, e.g. Centrophorus and Squalus, need to be examined in more detail in order to obtain more accurate species composition data. A number of species also appear to be undescribed, but these need to be compared with other closely-related species to confirm if they are undescribed. This work highlights the need to obtain accurate species composition data for a region. For example, Centrophorus squamosus is thought to be widely distributed, but closer examination of material identified as this species from Indonesia and Australia indicates that a species complex most likely exists for this species.
Preliminary reproductive data from squaloids
A single pregnant female each of Centrophorussp. brown, longnose, Centrophorus cf atromarginatus and Centrophorus cf moluccensis were collected in March 2002. Each possessed only two embryos. The embryos in the former species were early term (~86mm TL), while those in the latter two species were mid-late term embryos (170–210mm TL). In contrast, several pregnant females of Squalus sp.3 collected in July 2001 contained 6–8 mid-late term embryos (~150mm TL).
Processing of deepwater sharks
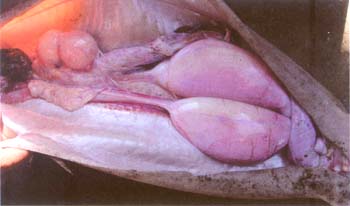
The most sought after produce of deepwater sharks is the valuable squalene oil of their livers and mainly derived from squalids and centrophorids. The livers are usually removed immediately on landing the shark (Figure 4) and are either dried or cooked to obtain the oil. This oil is bottled and exported or distributed within Indonesia depending on its quality. The fins are dried but are only considered of moderate quality in comparison to other shark fins, e.g. those from carcharhinids. The flesh of larger sharks is sliced into manageable pieces and salted in tanks after which it is dried on bamboo racks before distribution (Figure 5). Smaller sharks are typically sliced in half dorsolaterally, salted and then dried in a “butterfly” manner (Figure 6). The flesh from the large Hexanchus griseus is highly regarded and fetches a much higher price than that of other deepwater chondrichthyans. The vertebral columns of the larger squaloids are also dried and are typically exported either whole or powdered for there supposed medicinal properties. At Palabuhanratu, the enlarged yolked ova from Centrophorus species are considered a delicacy and are removed immediately upon landing (Figure 7).
FIGURE 4
Large Centrophorus cf acus with livers being excised
immediately upon landing at Palabuhanratu in West Java
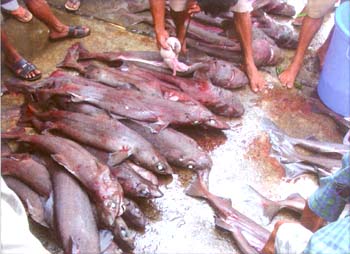
FIGURE 5
Drying of shark flesh on racks
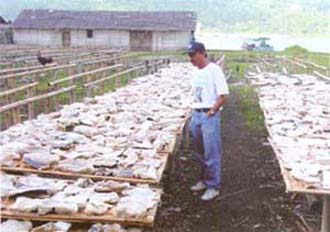
FIGURE 6
Dried shark showing cut used to open body
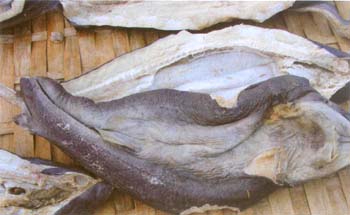
FIGURE 7
Yolked ova of Centrophorus is a delicacy in Indonesia
4. FUTURE CONSIDERATIONS
Although waters greater than 600 m in depth are not currently exploited by deep-sea fishers, this is unlikely to be the case for much longer. Moreover, in the future, new fishing methods (e.g. trawling) may be adopted, especially if foreign fishing vessels are allowed access to Indonesian waters, which have the potential to rapidly deplete the vulnerable deepwater chondrich-thyan fauna. Future expansion of this fishery in Indonesia is highly likely and protocols for managing such an expansion need to be developed in the near future. These management strategies need to be included into the National Plan of Action for sharks in Indonesia with the aim of preventing any significant expansion to deep-sea fishing in this country. Some anecdotal evidence suggests that squaloid catches from deep-sea longlining at one landing site, i.e. Cilacap, have declined rapidly in the last ten or more years despite it being only a relatively restricted fishery. This may be a result of localized depletion but further investigation is required since the fishers may have just begun using the nearby landing site at Sentolo kawat. Deep-sea longlining based at the landing sites of Kedonganan and Tanjung Luar appears to be a relatively new fishery. Thus, regular surveys of these ports are required to assess to what extent the catch compositions change over the years.
5. LITERATURE CITED
Bonfil, R. 1994. Overview of world elasmobranch fisheries. FAO Fisheries Technical Paper 341. 119pp.
Carpenter, K.E. & V.H. Niem (Eds) 1998. FAO Species Identification Guide for Fishery Purposes. The living marine resources of the Western Central Pacific. Volume 2. Cephalopods, crustaceans, holuthurians and sharks. p. 687–1396. FAO, Rome.
Carpenter, K.E. & V.H. Niem (Eds) 1999. FAO Species Identification Guide for Fishery Purposes. The living marine resources of the Western Central Pacific. Volume 3. Batoid fishes, chimaeras and bony fishes part 1 (Elopidae to Linophyrnidae). pp.1397–2068. FAO, Rome.
Chen, H.K. (Ed) 1996. Shark Fisheries and the Trade in Sharks and Shark Products in Southeast Asia. TRAFFIC Southeast Asia Report, Petaling Jaya, Selangor, Malaysia. 38pp.
Compagno, L.J.V. 1984. FAO species catalogue. Vol. 4, Sharks of the World. An annotated and illustrated catalogue of shark species known to date. Part 2 -Carcharhiniformes: pp.251–655. FAO Fisheries Synopsis 125: 1–655.
Gloerfelt-Tarp, T. & P.J. Kailola 1984. Trawled fishes of southern Indonesia and northwestern Australia. Australian Development Assistance Bureau, Directorate General of Fisheries, Indonesia, German Agency for Technical Cooperation. 406pp.
Last, P.R. & J.D. Stevens 1994. Sharks and rays of Australia. CSIRO Division of Fisheries, Hobart Australia. 513 pp.
Monintja, D.R. & R.P. Poernomo 2000. Proposed concept for catch policy on shark and tuna including southern bluefin tuna in Indonesia. Paper presented at “Indonesian-Australian workshop on shark and tuna”, Denpasar, March 2000.
Priyono, B.E. 2000. Sharks, seabirds and excess fishing capacity in the Indonesian waters. Paper presented at “Indonesian-Australian workshop on shark and tuna”, Denpasar, March 2000.
Widodo, J. 2000. The Indonesian shark fisheries present status and the need for research for stock assessment and management. Paper presented at “Indonesian-Australian workshop on shark and tuna”, Denpasar, March 2000.
F. Serena, E. Cecchi, C. Mancusi and R. Pajetta
Agenzia Regionale per la Protezione Ambientale della Toscana (ARPAT)
Via Marradi 114
57100 Livorno, Italy
<[email protected]>
1. INTRODUCTION
The velvet belly (Etmopterus spinax) is a small shark of the Etmopteridae family (sensu Mould 1998) common in all Italian seas where it lives on mud and clay bathial bottoms, usually between 200 and 500 metres of depth (Fisher, Bauchot and Schneider 1987, Notarbartolo and Bianchi 1998) though the species has been recorded to 2200 m (Sion, D'Onghia and Carlucci 2004). The maximum length of this species is about 60 cm (Compagno 1984) even if in the Mediterranean it rarely reaches 50 cm total length (TL) with a medium size between 20 and 30 cm TL (Bini 1967, Tortonese 1956, Notarbartolo and Bianchi 1998).
The velvet belly is a viviparous aplacental shark that gives birth to 6–14 pups born at 9–11 cm TL. The TL of first maturity is 28 cm for males and 34 cm for females (Vacchi and Relini-Orsi 1979). E. spinax are caught as bycatch by the Italian bottom-trawl fishery and all specimens caught are discarded at sea. The species is an important component of the shrimp fishery discard of the Tuscany fleet (Abella and Serena 2002) and of the Italian artisanal and bottom trawl fisheries (Fisher et al. 1987, Bini 1967).
2. MATERIAL AND METHODS
The data analyzed were obtained from 35 scientific bottom trawl surveys aimed at assessing demersal resources and were conducted between 1985 and 2002 by the Italian national GRUND1 project (GRUppo Nazionale risorse Demersali), and from 1994 to 2002 in the Mediterranean MEDITS2 project (MEDIterranean Trawl Survey) (GRUND and MEDITS -Relini 1998, Bertrand et al. 1997). The area studied in the Tuscany Archipelago of the Tyrrhenian Sea was, from Magra River to Elba Island and between 10 and 800 m of depth (Figure 1).
For the MEDITS project the standard sampling gear is a bottom trawl designed for scientific experimental fishing with a vertical opening of 2.5 m, horizontal opening of 15–18 m and codend stretched-mesh size of 20 mm. For the GRUND trawl surveys, a commercial gear was utilized, always in the autumn period with a codend stretched-mesh size of 20 mm.
FIGURE 1
Map of the tows location in the European Mediterranean
MEDITS trawl surveys
All specimens collected were counted and weighted. The biomass index (BI, kg/km2), the density index (ID, N/km2) and the coefficient of variation were estimated for both the GRUND and MEDITS trawl surveys. A sample of the collected fishes was measured to record total length (cm), weight, sex and maturity stage. The total length data were also correlated with depth considering depth strata of 50 m. The □2 test was used to verify the presence of a possible significant difference in the length frequency distribution by depth. The length-weight relation was fitted for both sexes using the function
W = a * L
The stage of maturity was defined using the method of Bass, D'Aubrey and Kistnasamy (1973) and Stevens and Lyle (1989).
The estimation of growth parameters for each sex was done using the FISAT programme (Gayanilo, Sparre and Pauly 1995). The sex ratio (females number/total number) and the feeding preferences also were investigated. The analysis of the stomach contents was only qualitative and only the number of prey for each stomach was registered. The data of the autumnal period were related to the total length of the specimens and compared to the results given by MacPherson (1980) and Wurtz and Vacchi (1981).
3. RESULTS AND CONCLUSIONS
A total of 3 542 individuals were caught in the study area between 322 and 633 m of depth. The analysis of the biomass index (kg/km2) and the density index (N/km2) of E. spinax caught show a positive trend during the years even if the trend is characterized by clear oscillations probably caused by stochastic effects (Figure 2). In the 1980s densities decreased followed by a strong increase. The indexes show oscillations between 0.05 and 0.35 kg/km2 (MEDITS survey) and 0.05–0.6 kg/km2 (GRUNDsurvey). This suggests a steady state of the velvet belly stock abundance in the study area. This resource, in fact, does not suffer intense exploitation by the local fisheries due to the distance from the homeports and depth of the grounds it prefers.
FIGURE 2
Trends of Biomass Index (BI kg/km2) (1) and Density Index (DI n/km2) (2)
of E. spinax from 1985 to 2002 related to the GRUND and MEDITS projects
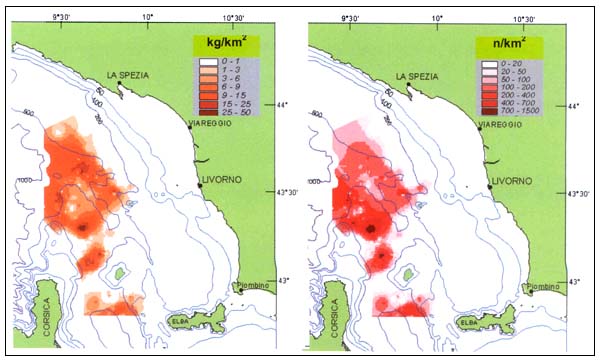
The analysis of georeferenced data using ArcView (ESRI 1996) of the velvet belly catches shows a bigger concentration of the species in the northern part of the studied area, north west of the Capraia and Gorgona islands (Tuscany, Italy) (Figure 3). This pattern remains fairly constant in all seasons of the year.
FIGURE 3
Geographical distribution of Biomass Index (BI kg/km2) and Density Index (DI n/km2)
of E. spinax in the study area
The morphometric data of total length, weight and sex were registered for 2304specimens. Males (n = 1127) showed a range in TL between 10 and 37 cm while for females (n = 1177) the minimum TL was 9 cm and the maximum 40.5 cm.
A χ2 test confirmed that there was a significant difference (p < 0.01) between length distribution of the specimens at different depths (for more than 450 m of depth). No significant difference exists in the distribution of the two sexes between 350 and 450 m of depth. In this layer the mean total length of both sexes is 17.5 cm. The mean total length increased with depth: 19.4 cm at 500 m, 22.2 cm at 550m, 25.0 cm at 600 m and 31.5 cm at 650 m (Figure 4). This observation agrees with the results of Vacchi and Relini Orsi (1979) who gathered specimens with bottom nets in the Genoa Gulf.
FIGURE 4
Mean size of E. spinax related to depth
These authors caught adult individuals (20–36 cm) between 600–700 m of depth. The sex ratio (0.51) is well balanced up to length 30 cm, then females become more common. This can be explained by the bigger size females reach relative to males (Vacchi and Relini Orsi 1979).
The relation between length (cm) and weight (g) for the specimens analyzed (828) is:
for males (n = 386)
W = 0.0050 L2.971
r2= 0.966
for females (n = 442)
W = 0,0056 L2.938
r2= 0.978.
The coefficient b for males (LF 95% 3.06 and 2.94) and females (LF 95% 3.00 and 2.90) is not significantly different from 3, so the growth for this species can be considered to be isometric.
Analysis of the length frequency distribution by sex shows a peak for males at about 21 cm TL and for females at 22 cm TL (Figure 5). The Bhattacharya method and the Normsep algorithm allowed us to estimate the growth parameters. The length-at-age derived from growth curves are similar and comparable to those calculated by Sion et al. (2002) who read dorsal spine growth rings. Only the 0+ class shows a slight difference in the correspondence with the estimated length (Table 1). In the present work the smaller specimens collected were 9–11 cm long and were represented as term embryos with a little scar on their abdomens, a signal of the recent detachment of the yolk sac. This agrees with the observation of Vacchi and Relini Orsi (1979) who found 4° stage for the embryo of about 10cmTL.
FIGURE 5
Length frequency distribution of E. spinax by sex
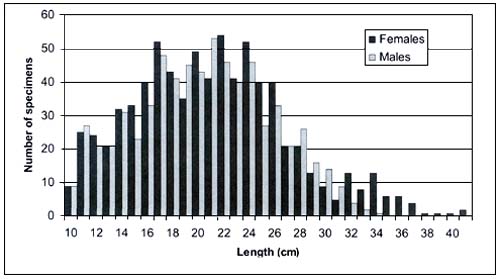
Table 1
Growth parameters and estimation of length by age for Etmopterus spinax
| K = | 0.35 | 0.23 | 0.27 | 0.24 | |
| L∞= | 40.10 | 46.56 | 45.82 | 42.00 | |
| to= | -0.72 | -1.19 | -1.09 | -1.31 | |
| S (Lt)= | 1.7 | 1.6 | 2.1 | 1.8 | |
| Age | Sion et al. 2002 | Female Bhattacharya | Female Normsep | Male Bhattacharya | Male Normsep |
| 0 | 13.4 | 8.9 | 11.1 | 11.7 | 11.3 |
| 1 | 17.2 | 18.1 | 18.4 | 19.8 | 17.9 |
| 2 | 21.6 | 24.6 | 24.2 | 25.9 | 23.0 |
| 3 | 25.5 | 29.2 | 28.8 | 30.6 | 27.1 |
| 4 | 29.3 | 32.4 | 32.4 | 34.2 | 30.3 |
| 5 | 33.4 | 34.7 | 35.3 | 37.0 | 32.8 |
| 6 | 37.3 | 36.3 | 37.7 | 39.1 | 34.7 |
We observed mature females with maximum total length of 46 cm TL. One female (TL=40cm) was captured in October at 532 m of depth. She had six embryos of about 6.5 cm TL in the uterus still retaining a yolk sac; another female caught in the same month was 46 cm long and had 18 embryos between 9.9 and 11.2 cm TL. These embryos, like the one we observed, had a little ventral vitelline mark and the yolk sac was already reabsorbed.
The 445 samples of stomach contents were analyzed and related to the specimens' TL. The stomach contents of some individuals captured in autumn were analysed in preliminary way: the diet of the bigger specimens was more simple and showed fewer species. The stomach contents of the specimens with a TL between 29.5 and 40 cm showed only a few taxonomic groups. Diet components belonged to four taxonomic groups: 74.8 percent crustaceans, 16.9 percent fishes, 6.9 percent cephalopods and 0.9percent polychaetes (Table 2). Other species represented 0.5 percent of the diet. It is important to underline the presence of polychaetes as a component of the stomachs analyzed in our studied area even if with a low percentage. This result differs from those of Macpherson's study (1980) in the Alicante, Spain area in the same autumn period and on individuals of the same size range (10–40 cm). The same author observed a larger presence of cephalopods and fishes instead of crustaceans. Also Vacchi and Wurtz (1981) and Relini, Orsi and Wurtz (1976) stated that E. spinax feeds essentially on cephalopods, teleost fishes and crustaceans but they do not mention the presence of nematodes, polychaetes and chondrichthyan fishes. Bello (1998) reports cephalopods, teleost fishes and crustaceans also to be present in the stomach of the specimens caught in the Adriatic Sea.
Table 2
Relative presence (%) of the different taxonomic groups in the stomach of the sampled individuals of
E. spinax analysed by size intervals
| LT (cm) | Nematodes | Polychates | Tunicates | Cephalopods | Crustaceans | Chondrichthyans | Osteichthyes |
| 9.5–19 | 0.0 | 0.3 | 1.3 | 6.3 | 77.9 | 1.5 | 12.7 |
| 19.5–29 | 1.0 | 0.6 | 0.0 | 7.5 | 72.9 | 0.0 | 18.0 |
| 29.5–40 | 0.0 | 10.2 | 0.0 | 4.1 | 61.2 | 0.0 | 24.5 |
4. LITERATURE CITED
Abella A.J. and F. Serena 2002. Comparison of elasmobranch catches of trawl surveys and commercial landings of the port of Viareggio North Tyrrhenian-South Ligurian Sea-Italy) in the last decade. Presented to the NAFO Council meeting, Santiago (Spain) September 2002. NAFO SCR Doc. 02/95, Serial No. N4716.
Bass A.J., J.D. D'Aubrey & N. Kistnasamy 1973. Sharks of the east coast of southern Africa. 1. The genus Carcharhinus (Carcharinidae). Investl Rep. (S. Afr.Ass.mar.boil.Res.), 33: 1–68.
Bello, G. 1998. The feeding ecology of the velvet belly, Etmopterus spinax (Chondrichthyes: Squalidae), of the Adriatic Sea on the basis of its stomach contents. Atti Soc. It. Sci. Nat.Museo ci. Stor. Nat. Milano, 139 (2): 187–193.
Bertrand J., L. Gil De Sola, C. Papaconstantinou, G. Relini & A. Suplet 2002. The general specifications of the MEDITS surveys. In: Abellò, P., J.A. Bertrand, L. Gil de Sola, C.Papaconstantinou, G. Relini & A. Souplet, (Eds), Mediterranean Marine Demersal Resources: the Medits International Trawl Survey (1994–1999). Sci. Mar., 66(Suppl. 2): 9–17.
Bini, G. 1967. Atlante dei pesci delle coste italiane, 1. Leptocardi, Ciclostomi, Selaci. Edit. Mondo Sommerso: 99–100.
Compagno, L.J.V. 1984. FAO species catalogue. Vol. 4. Sharks of the world. An annotated and illustrated catalogue of sharks species known to date. Part 1. Hexanchiformes to Lamniformes. FAO Fish. Synop., 125 (4): 249 pp.
Esri 1996. ArcView GIS. The Geographic Information System for Everyone. Environmental Systems Research Institute, Inc. 340 pp.
Fischer, W., M.-L. Bauchot & M. Schneider. 1987. Fiches FAO d'identification des espèces pour les besoins de la pêche (Révision 1). Méditerranée et mer Noire. Zone de pêche 37.2. Vertébrés. Publication préparée par la FAO (Project GCP/INT/422/EEC). Rome, FAO: 761–1530.
Gayanilo, F.C. Jr., P. Sparre & D. Pauly 1996. The FAO-ICLARM stock assessment tools (FiSAT) users'guide. FAO Computerized Information Series (Fisheries) Rome, n. 8. 126pp.
MacPherson, E. 1980. Régime alimentaire de Galeus melastomus Rafinesque, 1810, Etmopterus spinax (L. 1758) et Scymnorhinus licha (Bonnaterre, 1788) en Méditerranée occidentale. Vie milieu, 30 (2): 139–148.
Mould, B. 1998. The nomenclature and distribution of the recent Elasmobranchii.© Briand Mould 1998.
Notarbartolo Di Sciara, G. & I. Bianchi 1998. Guida degli squali e delle razze del Mediterraneo. Franco Muzzio Editore, 388 pp.
Relini Orsi, L. & M. Wurtz 1976. Patterns and overlap in the feeling of two selachians of bathyal fishing grounds in the Ligurian Sea. Rapp. Comm. Int. Mer Médit., 24(5), 89–94.
Relini G. 1998. Valutazione delle risorse demersali. Biol. Mar. Medit. 5 (3) parte prima: 3–19.
Sion, L., G. D'Onghia & R. Carlucci 2002. A simple technique for ageing the velvet belly, Etmopterus spinax (Squalidae). Proc. 4th Europ.Elasm.Assoc.Meet., Livorno (Italy), 2000 Vacchi, M., G. La Mesa, F. Serena & B. Seret, eds ICRAM, ARPAT & SFI 2002:135–139.
Sion, L., A. Bozzano, G. D'Onghia, F. Capezzuto & M. Panza 2004. Chondrichthyes species in deep waters of the Mediterranean Sea. Scientia Marina 68 (Suppl. 3) 153–162.
Stevens, J.D. & J.M. Lyle 1989. Biology of three hammerhead sharks (Eusphyra blochii, Sphyrna mokarran and S. Lewini from Northern Australia. Aust.J.Mar.Freshwater Res., 40: 129–146.
Tortonese, E. 1956. Leptocardia, Ciclostomata, Selachii, Fauna d'Italia, Vol. II. Ed.Calderini, Bologna: 334 pp.
Vacchi, M. & L. Relini Orsi 1979. Aspetti riproduttivi in Etmopterus spinax L.(Chondrichthyes, Squalidae). Quad. Civ. Staz. Idrobiol. Milano, 7, 64–74.
Wurtz, M. & M. Vacchi 1981. Ricerca di cicli nittemerali nell'alimentazione di selaci batiali. Quad.Lab.Tecnol. Pesca, 3 (1 suppl.): 155–164.
F. Serena1, R. Baino1, J. Rey2, C. Papacostantinou3 and G. Relini4
1ARPAT-GEA, Via Marradi, 114 57126 Livorno, Italy
<gea @arpat.toscana.it>
2IEO, Puerto Pesqueros/n, Apto 285, 29640 Fuengirola, Spain
<[email protected]>
3NCMR, Aghios Cosmas Hellinikion, 16644 Athens, Greece
lt;[email protected]>
4DIPTERIS, University of Genoa, Viale Benedetto XV, 3, 16132 Genoa, Italy
<[email protected]>
1. INTRODUCTION
Elasmobranchs (sharks, skates and rays) are generally characterized by a K life history strategy, i.e. slow growth, late attainment of sexual maturity, low fecundity and long life spans (Hoenig and Gruber 1990). They play an important ecological role since they are positioned on the top of trophic web and, being sensitive to any change in the ecosystem, are often used as biological indicators (Pratt, Gruber and Taniuchi 1990, Dayton et al. 1995, Stevens et al. 2000). Both these biological and ecological characteristics, together with frequent pessimistic results of stock assessments, which have become common in the last decades (Walker 1996), have led to doubts on the feasibility of sustainable harvesting of many elasmobranch stocks (Bonfil 1994, Punt and Walker 1998).
Although many Mediterranean stocks show clear signs of depletion (and some such as Squatina spp. and Rhinobatos spp, have practically disappeared), at least in some areas (Aldebert 1997, Fiorentini, Caddy and de Leiva 1997, Jukic-Peladic et al. 2000), suitable information for stock assessment purposes is generally still poor and fragmentary (Muños-Chápuli 1985).
The Mediterranean Sea extends for about 3 000 000 km2 with a variety of biogeographic features. Most of it is characterized by a narrow continental shelf (only 23percent of the whole surface) and therefore the ground fish stocks are mainly exploited along the coasts. Elasmobranchs are generally represented in the Mediterranean fisheries only as bycatch (Serena and Abella 1999, Vacchi and Notarbartolo 2000), and yield yearly around 2500 t in Italian waters (Fiorentini et al. 1997) and 10000 t/yr for the whole Mediterranean (FAO 1995), mainly from bottom trawl fisheries (Relini, Bertrand and Zamboni 1999).
In many Mediterranean areas trawl surveys are the main source of data for acquiring biological knowledge on demersal species and evaluating the status of these resources. Many research programmes focused on the assessment of demersal resources by direct methods have been carried out over a period of 20 years (e.g. by GRUND in Italy; Relini et al. 2000) at national levels. The MEDITS programme was the first coordinated project along the whole European coastal area (500000 km2 ) to a depth of 800 m.
The MEDITS project aimed at the standardisation of the survey methodology among the different countries and started in 1993. Within the frame of the MEDITS project nine trawl surveys have been carried out from 1994 to 2003. Therefore, a time series of nine years is available for the French, Spanish, Italian and Greek coasts of Mediterranean. Since 1996 data from the east coast of the Adriatic Sea (Slovenia, Croatia and Albania) have also become available.
The research efforts within the MEDITS programme represent an important basis for a more advanced development of both the knowledge on the dynamics of the demersal resources at Mediterranean level and of collaboration among the European scientists. Until now the data from the MEDITS trawl surveys have been mainly used to estimate abundance indices and length frequency distributions of the species of fishery interest as indicators of the status of resources. Indeed, the current database has the potential also to be employed for estimating the demographic patterns of the main demersal resources and for prediction purposes for the management of the fishery resources.
2. MATERIAL AND METHODS
In this work data from six bottom trawl surveys are considered. They were carried out from the Alboran to Aegean Seas, between April and June 1994–99 within the MEDITS International programme (Bertrand et al. 1997). In total, 6336 tows were done during daylight hours.
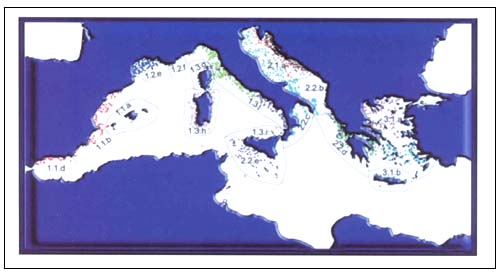
A random stratified design was adopted with stratum depth limits of 50, 100, 200, 500 and 800 m (Figure 1); the sampling density was one three miles tow for each 60square nautical miles (about 1000 tows) repeated each year. The standard sampling gear was a bottom trawl designed for scientific experimental fishing with a vertical opening of 2.5 m, horizontal opening of 15–18 m and codend stretched-mesh size of 20 mm. This gear was used during the same period (about one month in summer) by ten vessels throughout the whole survey area.
FIGURE 1
Map of the tows location in the European Mediterranean
MEDITS trawl surveys
A common survey protocol was adopted for all the cruises (Anon. 1998, Fischer et al. 1987). After each tow the species in the catch were identified, weighed and counted to estimate biomass and abundance indices (kg/km2 and number of individuals/km2) and to construct length-frequency distributions. Further biological analyses were performed on 30species on a common reference list because of their high commercial relevance: of these only three species were chondrichthyans, Galeus melastomus, Scyliorhinus canicula and Raja clavata.
Biomass indices and standing stock estimates (by means of the swept-area method and assuming full vulnerability to capture) were estimated from the database produced by IFREMER. The biomass indices were referred to four arbitrary geographical areas identified using a land-oriented criterion: Western (WA; Morocco, Spain and France coasts), Western Central (WCA; Tyrrhenian, Corsica, Sardinia and Sicily coasts), Eastern Central (ECA; Adriatic, Ionian and Albanian), and Eastern (EA; AegeanSea).
3. RESULTS
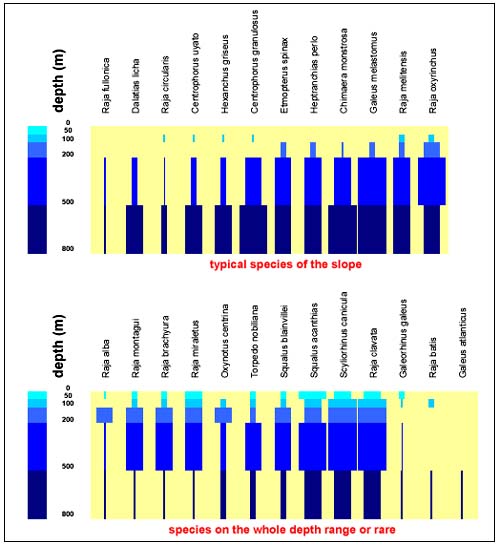
Only 25 of the 45 species of elasmobranches in the area can be considered as deep-sea species (Figure 2). They include 13 sharks, three skates, seven rays, one electric ray and one rabbitfish. Single or sporadic captures were also recorded e.g. of Hexanchus griseus, Galeus atlanticus and Raja batis.
FIGURE 2
Depth distribution of the 25 species of deep sea
elasmobranchs from the trawl surveys
Bar width represents the density index with the ranges: <0.1, 0.1–1, 1–10, >10 kg/km2.
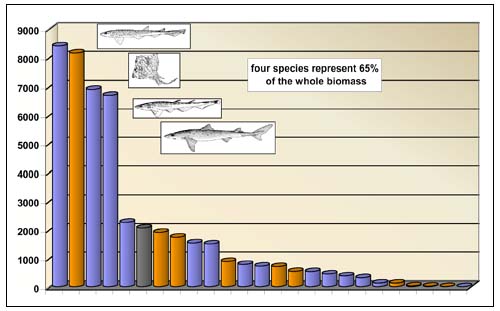
Three sharks and one ray (Scyliorhinus canicula, Raja clavata, Galeus melastomus and Squalus acanthias) showed both high occurrence (>5 percent of the hauls) and high abundance (> 10 kg/km2 or >10 percent of relative biomass) and altogether represented 65 percent of the whole biomass of deep-sea sharks (Figure 3).
FIGURE 3
Index of abundance of deep sea elasmobranchs in the
European Mediterranean
Two faunistic groups can be identified with regard to depth distribution: (a)species well represented at all depths such as R. clavata and S. canicula and (b), with a preference for the slope such as Centrophorus granulosus and Etmopterus spinax. Only a handful of species showed levels of abundance of commercial interest and just a few are actually marketed. The large shark species (e.g. Squalus spp.) show signs of depletion although they occurred in zones of relatively high density (e.g. on rough ground usually not exploited by fishermen).
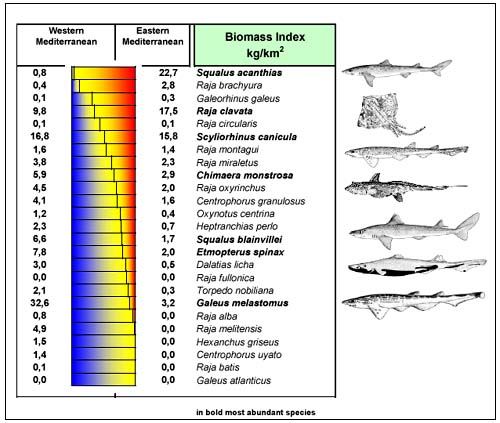
From a geographical perspective (Figure 4), some species are abundant in all areas (S. canicula, R. clavata, Chimaera monstrosa), while others are most common in the west (G. melastomum, Etmopterus spinax and Squalus blainvillei) or the east (S. acantias and Raja brachiura); some species are localised in restricted areas (Raja miraletus in the Tyrrhenian, Raja brachiura and Raja undulata in the Aegean Sea, Galeus atlanticus in the Alboran Sea). Globally, the eastern basins (Adriatic and Aegean Seas) showed higher standing stocks, mainly due to the wider continental shelf.
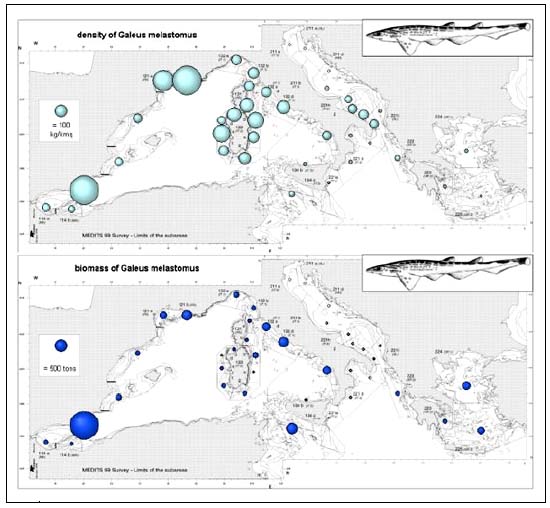
The blackmouth catshark (G. melastomus) was caught in all areas (Figure 5a) with the exception of the North Adriatic and this species was mainly distributed in the deeper strata of the slope. Densities consistently higher than 100 kg/km2 occurred in the Gulf of Lions and in the Sardinian waters, with a maximum of 1040 kg/km2 in the Alboran Sea. In regard to total stock biomass estimates, 40percent of the Mediterranean blackmouth catshark stock was found in the Alboran Sea (2600t); elsewhere the only significant stocks (300–400t) were in the central Tyrrhenian and in the Sicilian Channel.
FIGURE 4
Biomass indexes in the European Mediterranean related to
their east-west distribution
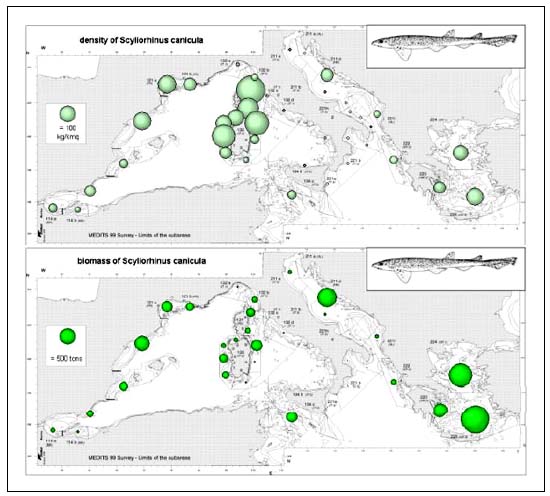
The small spotted catshark (S. canicula) was caught in all sectors and depth strata with the exception of the Adriatic Sea, Eastern Sicily and Northern Ionian Sea. Taking into account the biomass indexes (Figure 5b), values higher than a threshold of 100 kg/km2 were found on the shelves off Corsica and Sardinia. Significant abundances (30–50kg/km2) were also found in the Gulf of Lions, Catalan and Aegean Seas. The maximum biomass index (340 kg/km2) was detected in North East Corsica in the 50–100 m depth stratum. A different picture is given when considering the total biomass estimates; due to the difference in the shelf areas, the higher standing stocks (3400t) occurred in the easternmost sectors.
The thornback ray (R. clavata) (Figure 5c) occurred preferentially at the edge of the shelf and on the upper slope (200–500 m). However, it showed an irregular distribution with scanty or no catches recorded in the westernmost and East-Central Mediterranean. The highest biomass indexes (above 200 kg/km2) were observed in the waters surrounding Sardinia and Corsica where the maximum biomass indexes (418 kg/km2) were detected between 50 and 100 m depth. The highest total biomass estimates of the standing stocks occurred in the easternmost sectors (> 3 000t), but other significantly abundant stocks (biomass between 300 and 500t) were found in the Aegean, South Western Sardinia and in the Sicilian Channel.
The good yields of R. clavata, (the most abundant ray in the Mediterranean) seem to reflect a higher ecological performance than a true resilience to exploitation; in fact, biomass densities (up to 100 kg/km2), likely closer to the “virgin” conditions, are found only locally in the Gulf of Lion, Corsica, Sardinia and Greece waters. Up to 64percent of the total biomass is located in the Aegean Sea, where trawling deeper than 400 m is practically absent.
The length frequency distributions of only few species of selachians (G. melastomus, S. canicula and R. clavata) were prepared. The length frequency distributions of these sharks are similar (Figure 6a and Figure 6b) with a modal peak around 20 cm of total length and on asymptote between 30 and 40 cm TL. The size range is fairly wide ranging from 8 to 68 cm for G. melastomus and from 10 to 50 cm for S. canicula. In both cases the immature individuals represented about 80percent of the sampled population.
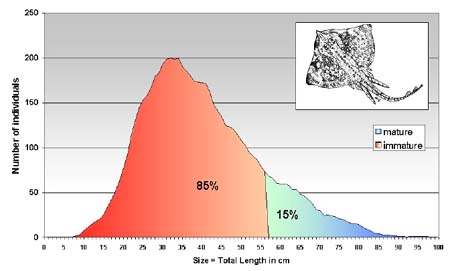
The size distribution of R. clavata shows a lognormal shape (6c): from 10 cmTL the frequencies increased gradually up to 35 cm TL, thereafter they decreased progressively up to the maximum-recorded size of 90 cm TL. Most individuals are therefore smaller than the size at first maturity (55–60 cm TL) and the spawning stock fraction by number represented only 15 percent of the population.
The location of nursery areas can be identified by observing the high concentrations of juveniles. The most likely nursery area for G. melastomus is the depth range between 200–500 m. Only in the South-Eastern Tyrrhenian Sea were the highest concentration of juveniles found in deeper waters (500–800 m). The most important nursery areas (values above a threshold of one million juveniles) were observed in the Alboran Sea, Sardinian waters and South-Eastern Tyrrhenian Sea. The main concentrations of S. canicula juveniles were located on the upper slope (200–500 m), especially in the North East Corsica and North East Sardinia areas (1.3 and 1.2million juveniles respectively). However, the highest number of juveniles (2.4 millions) was found on the edge of the shelf of Western Morocco.
FIGURE 5A
Density and biomass estimates of Galeus melastomus
Given that catches of R. clavata usually included both juveniles and large-sized animals in the same haul, the mean size per tow did not allow a clear identification of the nursery areas: in fact only one area was evident in the Eastern Ionian Sea between 50 and 100 m.
Even if the MEDITS data do not yet represent an extensive time series, some 20 years data are available for the GRUND programme in Italy (Relini et al. 2000). Figure 7a shows the abundance indices of three sharks and C. monstrosa, reported since 1985 for the Northern Tyrrhenian Sea. No clear trend can be found in this period, even though the biomass estimates suggest that the stocks increased and decreased more than twice in this period of 10–12 years. Decidedly greater fluctuations were observed for some rays (Figure 7b), in particular Raja montagui and Raja miraletus, which showed a biomass increase of up to 8–10 times over the last decade.
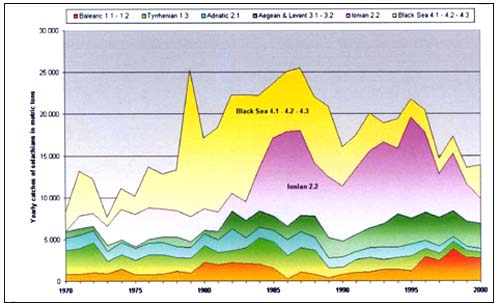
Catches statistics of commercial fisheries in the last 30 years are reported by GFCM (FAO 1995 available through www.fao.org) for each statistical subdivision (Figure 8) though no species breakdown can be considered reliable. With the exception of the Black and Ionian Seas, the landings of the Mediterranean commercial fishing fleets is usually around 5000t/yr (Figure 9). In the Black and the Ionian Seas, the fisheries targeted at Mustelus spp. rapidly developed with catches up to 10000t/year in the late 1980s and then declined in little more than a decade.
FIGURE 5B
Density and biomass estimates of Scyliorhinus canicula
4. DISCUSSION AND CONCLUSION
These preliminary results are only a first step towards a future assessment aimed at the production of management advice regarding elasmobranchs stocks. Notwithstanding this, the analysis of MEDITS data indicated signs of depletion for most sharks and rays and for deep species such as G. melastomus.
The survey programme gave useful basic information that enlarged the knowledge of demersal resources in the Mediterranean. They have drawn attention to the wide variety of situations encountered and the care needed for elaboration of general diagnoses of the present status concerning demersal resources in the Mediterranean Sea. This attention should be expanded to include analyses of critical development stages, such as recruitment, and focus on groups of species vulnerable to fishing and potentially in danger, such as elasmobranchs (Bertrand et al. 2000).
The utility of such a programme to support fishery management is strongly related to its ability to produce indices suitable for the characterization of the different species situations in the whole area, their variation and trends over time. So far, the main goal has been the production of relative abundance indices and the reconstruction of demographic structure of the main exploited species. Further activities may include the analyses of interannual variation, regional studies of biology and ecology of the species, including multispecies modelling.
FIGURE 5C
Density and biomass estimates of Raja clavata
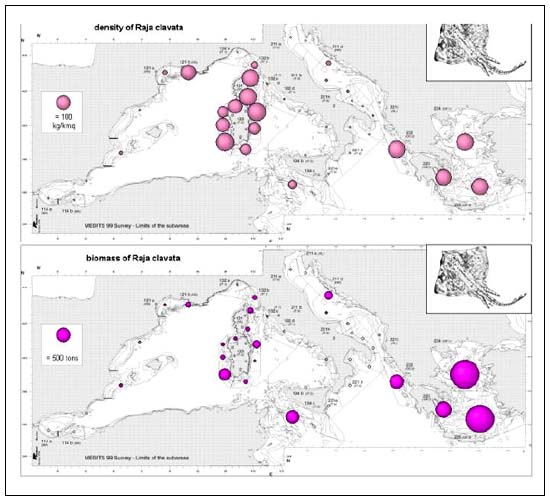
FIGURE 6A
Length frequency distribution of Galeus melastomus
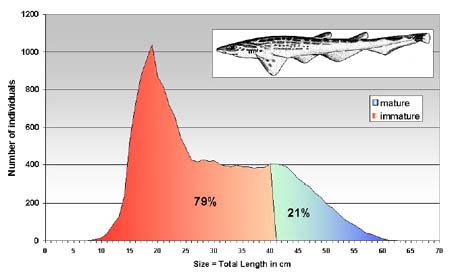
FIGURE 6B
Length frequency distribution of Scyliorhinus canicula
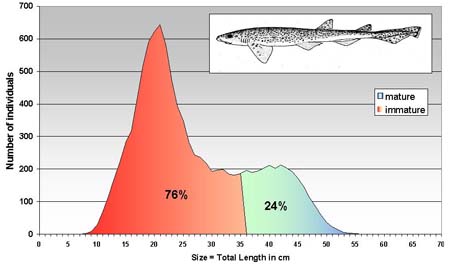
FIGURE 6C
Length frequency distribution of Raja clavata
From the data examined, no particular trend occurs in density indices over the years for any of the three species. The same phenomenon was observed by Bertrand et al. (2000) although in some parts of the Mediterranean basin (e.g. Tyrrhenian Sea) G. melastomus shows a slight increasing trend and some seasonal fluctuations in biomass in the last years, with a maximum biomass in winter and a minimum in summer (Baino and Serena 2000).
It is clear from analyzing the length frequency distributions, that in some areas the smallest size-classes of these species are underestimated. This can be due to the lack of samples in nursery areas (e.g. due to operational depth limits, untrawlable grounds or randomised tow positions), since the small mesh size of the MEDITS net reduces selectivity effects (Ragonese, Di Stefano and Bianchini 2000). Nevertheless, in almost all the cases the populations are mainly composed of juveniles well below the size at first maturity, for example, the overall immature specimens are around 80 percent of the catch for G. melastomus and for S. canicula and 85 percent for R. clavata.
Rey and Gil de Sola (1998) observed that the G. melastomus population in Spain is also composed mostly of immature specimens, smaller than 40 cm of total length (75percent) including recruits below 21 cm (18 percent). The analysis of the densities of individuals smaller than 21 cm showed recruitment to occur in spring in the Alboran Sea, with catch rates of 62 an hour fishing (Tursi et al. 1993). But, for this species the MEDITS sampling programme did not cover the whole range of G. melastomus, cited as down to 2000 m in the Catalan Sea by Stefanescu, Llorys and Rucabado (1992).
From the length frequency distribution of S. canicula, and in accordance with D'Onghia et al. (1995) and Relini et al. (1999) the nurseries of this species are located on the bottoms around 200 m depth. As sharks increase in size, they move towards coastal waters and only the mature adults return to the shelf edge to reproduce. In some areas of the Mediterranean basin (e.g.Northern Tyrrhenian Sea) the stocks of small-spotted catshark currently show a sharp geographical division between young and adult individuals (Baino and Serena 2000).
It is important to know the characteristics and distribution of the effort exerted by the commercial fishery fleets to understand the present spatial distribution for this species, as well as for the others. Data on distribution and abundance represent only a first step in implementing assessments aimed at the management of the elasmobranch stocks. In particular stock units could be better identified by a spatial analysis that included information about maturity conditions and other life history features in order to verify the presence of sub-stocks whose fishing pattern may be considered homogeneous. Although local productivity can play an important role, the shape of length frequency distributions, presented in this paper, suggests the existence of sub-areas that are exposed to different levels of fishing effort (e.g. S. canicula seems being more heavily exploited in the Tyrrhenian Sea than in the Aegean Sea).
The assessment of the standing stock biomass of chondrichthyans obtained through trawl surveys is substantial, but may underestimate the real size of the stocks as some species live well below the investigated depth range. Further, the catch rates of other fishing gears than trawl can be sizeable. Moreover, in the commercial trawl fishery, the importance of discards (both by species and by size) should not be neglected. These amounts should be added to the landings data reported by the national institutions to accurately provide catch estimates.
It seems unavoidable that to formulate reasonable management advice requires the integration of the information produced by the scientific cruises (such as the MEDITS programme) with specific research to improve the collection of the landings and discards data.
FIGURE 7A
Trends of biomass index in the northern Tyrrhenian sea:
sharks
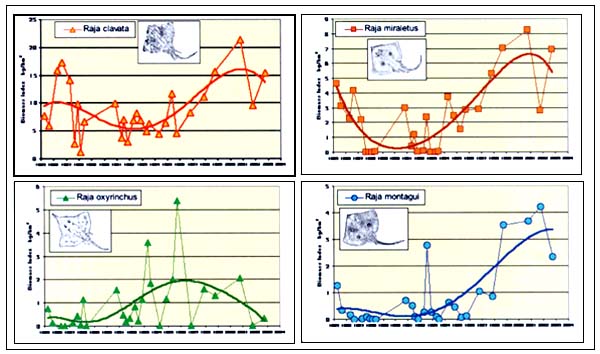
FIGURE 7B
Trends of biomass index in the northern Tyrrhenian sea:
rays
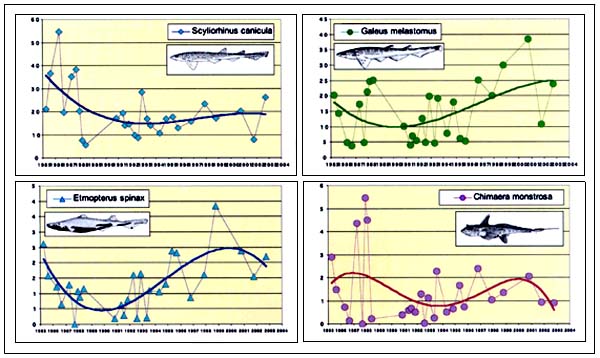
FIGURE 8
Statistical subdivision of the Mediterranean Sea following
FAO-GFCM
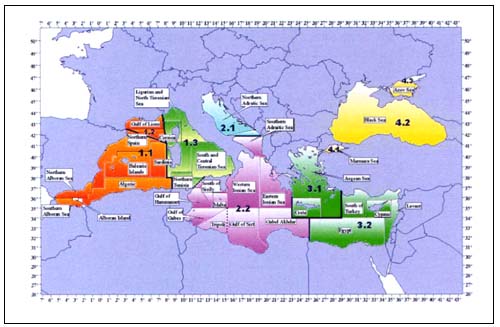
FIGURE 9
Commercial landings of elasmobranchs in the Mediterranean
Sea
5. LITERATURE CITED
Aldebert, Y. 1997. Demersal Resources of the Gulf of Lions (NW Mediterranean). Impact of exploitation of fish diversity. Vie Milieu 47 (4): 275–284.
Anon. 1998. MEDITS: Manuel des protocoles. Biol. Mar. Medit., 5(2): 515–572.
Baino, R. & F. Serena 2000. Abundance estimation and geographical distribution of some selachii in the Northern Tyrrhenian and Southern Ligurian Seas. Biol. Mar. Medit. 7(1): 433–439.
Bertrand, J., L. Gil de Sola, C. Papakostantinou, G. Relini & A. Souplet 1997. An international bottom trawl survey in the Mediterranean: the MEDITS Programme. ICES CM 1997/Y: 03 16.
Bertrand, J., L. Gil de Sola, C. Papakostantinou, G. Relini & A. Souplet 2000. Contribution on the distribution of elasmobranchs in the Mediterranean (from the MEDIT surveys). Biol. Mar. Medit. 7 (1): 1–15.
Bonfil, R. 1994. Overview of world Elasmobranch fisheries. FAO Fisc. Tec. Pap. 341.
Dayton, P.K., S.F. Thrush, M.T. Agardy & R.J. Hofman 1995. Environmental effects of marine fishing. Aquatic conservation: marine and freshwater ecosystems, 5: 205–232.
D'Onghia, G., A. Matarrese, A. Tursi & L. Sion 1995. Observations on the depth distribution pattern of the small-spotted catshark in the North Aegean Sea. Journal of Fish Biology, 47: 421–426.
FAO 1995. World fishery production 1950–1993. Supplement to the FAO yearbook of fishery statistics 1993. Vol.76. Catches and Landings.
Fiorentini L., J.F. Caddy & J.I. de Leiva 1997. Long-and short-term trends of mediterranean Fishery Resources. Studies and reviews. General Fisheries Council for the Mediterranean. FAO. No.69: 72 pp.
Fischer W., M.-L. Bauchot & M. Scheneider 1987. Fishes FAO d'identification des èspeces pour les besoins de la pêche (rev.1) Méditerranée et Mer Noire. Rome, FAO. 1530 pp.
Hoenig, J. M. & S.H. Gruber 1990. Life-history patterns in the elasmobranchs: implications for fisheries management. In Elasmobranchs as living resources: advances in the biology, ecology, systematics and the status of the fisheries. Edited by Pratt, H.L. Jr., S.H. Gruber and T. Taniuchi. NOOA Tech. Rep. NMFS, 90: 1–16.
Jukic-Peladic, S., N. Vrgoc, S. Krstulovic-Sifner, C. Piccinetti, G. Piccinetti-Manfrin, G.Marano & N. Ungaro 2000. Long-term changes in demersal resourcesa of the Adriatic Sea: comparison between trawl surveys carried out in 1948 and 1998. Fish. Res., 1106: 1–10.
Muños-Chápuli, R. 1985. Análisis de las capturas de escualos demersales en el Atlántico NE (27°N–37°N) y mar de Alborán (Mediterráneo occidental). Inv. Pesq. 49(1): 121–136.
Pratt, H.L. Jr., S.H. Gruber & T. Taniuchi 1990. Elasmobranchs as living resources: advances in the biology, ecology, systematics and the status of the fisheries. NOOA Tech. Rep. NMFS, 90: 518pp.
Punt A.E. & T.I. Walker 1998. Stock Assessment and Risk Analysis for the School shark (Galeorinhus galeus) off southern Australia. Mar. Freshwater Res., 49: 719–731.
Ragonese S., L. Di Stefano & M.L. Bianchini 2000. Catture e selettivitàdi pesci cartilaginei nella pesca dei gamberi rossi nello Stretto di Sicilia. Biol. Mar. Medit., 7 (1): 400–411.
Relini, G., J. Bertrand & A. Zamboni 1999. Synthesis of the Knowledge on Bottom Fishery Resources in Central Mediterranean (Italy and Corsica), Biol. Mar. Médit., 6(suppl.1): 58–98.
Relini, G., F. Biagi, F. Serena, A. Belluscio, M.T. Spedicato, P. Rinelli, M.C. Follesa, C.Piccinetti, N.Ungaro, L. Sion & D. Levi 2000. I selaci pescati con lo strascico nei mari italiani), Biol. Mar. Medit., 7 (1): 347–384.
Rey, J. & L. Gil de Sola 1988. Observation on distribution and biology of demersal chondrichthyans in western Mediterranean Sea (Spain). Presented at the International Symposium on Assessment of demersal resources by direct methods in the Mediterranean and the adjacent seas. March 18–21 1998 -Pisa (Italy).
Serena F. & A. Abella 1999. Assessment of the effects of fishing on demersal assemblages of the fishing grounds located in the Northern Tyrrhenian Sea with special references to Raja asterias. ICES/SCOR Symposium on Ecosystem Effects of Fishing. Montpellier, France (mimeo) 4pp.
Stefanescu, C., D. Llorys & J. Rucabado 1992. Deep living demersal fishes in the Catalan Sea (Western Mediterranean) below the depth of 1000 m. Journal of Natural History, 26: 197–213.
Stevens, J.D., R. Bonfil, N.K. Dulvy & P.A. Walker 2000. The effect of fishing on sharks, rays and chimeras (chondrichthyans), and the implication for marine ecosystems. ICESJournal of Marine Science, 57: 476–494.
Tursi, A., G. D'Onghia, A. Matarrese & G. Piscitelli 1993. Observations on population biology of the blackmouth catshark Galeus melastomus (Chondrichthyes, Scyliorhinidae) in the Ionian sea. Cybium, 17(3): 187–196.
Vacchi M. & G. Notarbartolo di Sciara 2000. I pesci cartilaginei nei mari italiani, una risorsa che richiede urgenti misure di tutela, Biol. Mar. Medit., 7 (1): 296–311.
Walker, P.A. 1996. Sensitive skates or resilient rays? Annu. Rep. Neth. Inst. Sea. Res. 1996:60–61.
N.-R. Hareide1, G. Garnes1, G. Langedal2 and M. Clark3
1Hareide Fishery Consultants
Støyleråsa 3, 6065 Ulsteinvik, Norway
<[email protected]>
2The Norwegian Directorate of Fisheries,
P.O. Box 185 Nordnes, 5817 Bergen, Norway
3Marine Institute, GTP Parkmore, Galway, Ireland
1. INTRODUCTION
Samples for this project were secured from two trawl surveys in 1993 and 1998 and five longline surveys in the period 1991 to 2000 (Figure 1 and Tables 1 and 2). The purpose of these surveys was to obtain samples of deepwater fish for biological and food-technology analyses. In addition, the surveys provided important information on catch rates and distribution of deepwater fish (Hareide and Garnes 2001). All surveys were carried out using chartered commercial vessels. Information from 168 trawl stations and 609 longline stations is presented. The expeditions carried out during the years 1991–1996 were organized by Møre Research Ålesund, and the later expeditions were organized by The Directorate of Fisheries Norway.
FIGURE 1
Positions for stations for exploratory fishery surveys,
1991–2000,
and fishing areas used by the International Council for
the Exploration of the Sea (ICES)
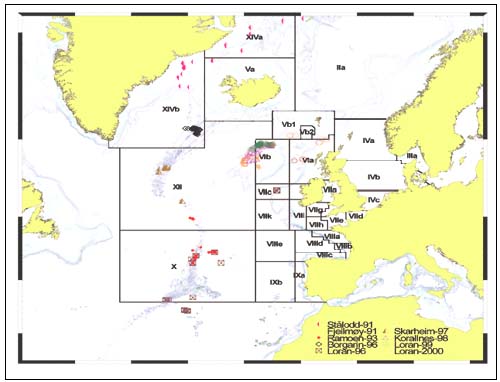
TABLE 1
Trawl stations by year and ICES area
| Vib | X | XII | Total | |
| 1993 | 116 | 7 | 123 | |
| 1998 | 34 | 11 | 45 | |
| Total | 34 | 116 | 18 | 168 |
TABLE 2
Longline stations by year and ICES area
| S of ICES | Vb1 | Via | VIb | VIIc | X | XII | XIVb | Total | |
| 1991 | 7 | 19 | 7 | 12 | 2 | 47 | |||
| 1996 | 23 | 4 | 54 | 80 | 161 | ||||
| 1997 | 251 | 1 | 252 | ||||||
| 1999 | 59 | 8 | 67 | ||||||
| 2000 | 44 | 38 | 82 | ||||||
| Total | 23 | 7 | 19 | 110 | 4 | 54 | 309 | 83 | 609 |
2. MATERIAL AND METHODS
Length frequency information was collected for 2536specimens of Centrophorus squamosus and 1727of Centroscymnus coelolepis (Tables 3 and 4). Catch per unit of effort (CPUE) was calculated for each station. For trawl surveys CPUEwas calculated as kilogram a haul. During longline surveys the number of magazines of hooks shot at each station was recorded. For longline surveys CPUEfor each station was calculated as kilogram per 1000 hooks.
TABLE 3
Number of records of
length, sex and maturity by year and ICES
area for Centrophorus squamosus
| Length | VIb Sex | Mat | VIIc Length | Sex | Length | X Sex | Mat | Length | XII Sex | Mat | Total length | Total sex | Total mat | |
| 1991 | 9 | 4 | 13 | |||||||||||
| 1996 | 201 | 79 | 271 | 141 | 3 | 493 | 220 | 3 | ||||||
| 1998 | 1 | 1 | 1 | 2 | 1 | |||||||||
| 1999 | 1250 | 1250 | 340 | 68 | 67 | 27 | 1318 | 1317 | 367 | |||||
| 2000 | 408 | 405 | 107 | 302 | 297 | 140 | 710 | 702 | 247 | |||||
| Total | 1668 | 1656 | 447 | 201 | 79 | 271 | 141 | 3 | 375 | 364 | 167 | 2536 | 2240 | 617 |
Table 4
Number of records of length, sex
and maturity by year and ICES
area for Centroscymnus coelolepis
| Length | VIb Sex | Mat | Length | X Sex | Length | XII Sex | Mat | Length | XIVb Sex | Total length | Total sex | Total mat | |
| 1991 | 15 | 1 | 16 | ||||||||||
| 1996 | 32 | 5 | 2 | 2 | 34 | 7 | |||||||
| 1997 | 59 | 48 | 25 | 59 | 48 | 25 | |||||||
| 1998 | 36 | 3 | 10 | 46 | 3 | ||||||||
| 1999 | 587 | 581 | 229 | 59 | 58 | 56 | 646 | 639 | 285 | ||||
| 2000 | 346 | 345 | 127 | 580 | 551 | 173 | 926 | 896 | 300 | ||||
| Total | 984 | 929 | 356 | 32 | 5 | 709 | 657 | 254 | 2 | 2 | 1727 | 1593 | 610 |
Length frequency (5 cm interval) distributions were calculated for 100 m depth strata for each species (Figures 14–19 and 37–42). The sex ratio was calculated for 100 m depth strata (Figures 21 and 44).
Maturity was assessed by means of the maturity scale devised for use in the European Community FAIR deepwater research programme (Stehmann 1998). This scale was used on surveys after 1996. The scale made use of several criteria for assessing the state of maturity. These criteria are described in Clarke (2000). We have participated in Irish longline surveys in 1997 and 1999 and have developed our interpretation in cooperation with The Marine Institute of Ireland.
During the surveys before 1997 maturity was not assessed for the two species. During sampling after 1996 617 specimens of Centrophorus squamosus and 610 of Centroscymnus Coelolepis were classified (Tables 3 and 4).
3. RESULTS
3.1 Centrophorus squamosus
Distribution
The CPUE from trawl and longlines is presented in Figures 4–13. Highest catches were recorded in some areas of the Hatton Bank slopes. The absolute depth range for this species was 470–1950 m. Peak catch rates of Centrophorus squamosus for longlines came from 1000 to 1100 m. Few specimens were caught by trawl compared to longlines (Figures 2 and 3).
FIGURE 2
Catch composition for trawl 1998, Hattonbank (ICES areas VIb and XII combined)
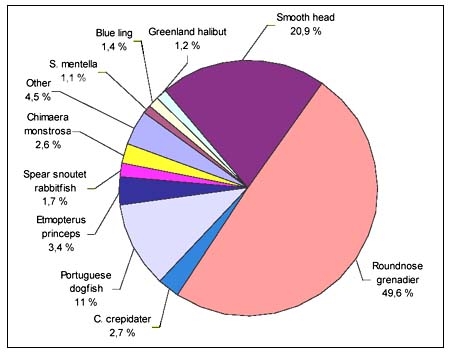
FIGURE 3
Catch composition for longline 1999, Hattonbank (ICES areas VIb and XII combined)
Length frequencies
The smallest length recorded was 53 cm for females and 56 cm for males. The greatest lengths were 136 cm for males and 135 cm for females. Figure 20 shows mean length by sex for each 100 m depth interval. There is a trend of decreasing size with depth in both sexes.
Reproduction
The relative frequencies for each maturity stage from Hatton Bank for the years 1999 and 2000 are shown in Figures 22 and 23. During this study two pregnant females were recorded. They were caught on the northern slope of Hatton Bank at depths between 1155 and 1300 m at a temperature of 4.7°C.
Feeding
Stomach contents were found in only 20 specimens. Of these specimens, 18 were collected on Hatton Bank. The main prey species was Coryphaenoides rupestris (Table5). Different types of fish amounted to 80 percent, whale meat to 10 percent, and squid and octopus to 10 percent.
TABLE 5
Stomach contents of Centrophorus squamosus
| Food items | Number | % |
| Argentines | 1 | 5 |
| Different fish | 4 | 20 |
| Mora moro | 1 | 5 |
| Coryphanoides rupestris | 7 | 35 |
| Sebastes Mentella | 1 | 5 |
| Smoothhead | 2 | 10 |
| Squid | 2 | 10 |
| Whale | 2 | 10 |
| Total | 20 | 100 |
3.2 Centroscymnus coelolepis
Distribution
The CPUE from trawl and longlines is presented in Figures 24–35. Highest catches were recorded in some areas of the Hatton Bank slopes. The absolute depth range for this species was 497–1950 m. Peak catch rates of Centroscymnus Coelolepis for longlines came from 1000 to 1400 m.
Length frequencies
Length distributions are shown in Figures 37–42. The smallest length recorded was 59 cm for females and 59 cm for males. The greatest lengths were 137 cm for males and 130 cm for females. Figure 43 shows mean length by sex for each 100 m depth interval. There is a trend of decreasing size with depth for females, but not for males.
Reproduction
The relative frequencies for each maturity stage from Hatton Bank for the years 1999 and 2000 are shown in Figures 45 and 46.
Feeding
Stomach contents were found in 68specimens. All of these were collected on HattonBank in 1999 and 2000. The prey consisted of different types of fish (43percent), whale meat (33 percent), and squid and octopus (24 percent) (Table 6).
Table 6
Stomach contents of Centroscymnus coelolepis
| Food items | Number | % |
| Molva dypterygia | 4 | 5.9 |
| Chalinura sp. | 1 | 1.5 |
| Coryphanoides rupestris | 6 | 8.8 |
| Different fish | 8 | 11.8 |
| Grenland halibut | 2 | 2.9 |
| Myctophidae | 1 | 1.5 |
| Mora moro | 4 | 5.9 |
| Octopus | 5 | 7.4 |
| Smoothhead | 3 | 4.4 |
| Squid | 11 | 16.2 |
| Whale | 23 | 33.8 |
| Total | 68 | 100 |
4. ACKNOWLEDGEMENT
This paper is a result of The EC funded projects (EC FAIR 95/655 and DG fish study Contract 99/55). The expeditions were funded by The Norwegian Directorate of Fisheries, The Faroese Government and several private companies. The authors thank these organizations very much and also all crew and staff involved in the investigations.
FIGURE 4
Catch-per-unit-of-effort for Centrophorus squamosus in kg
per 1 000 hooks
during a longline survey in September 1996
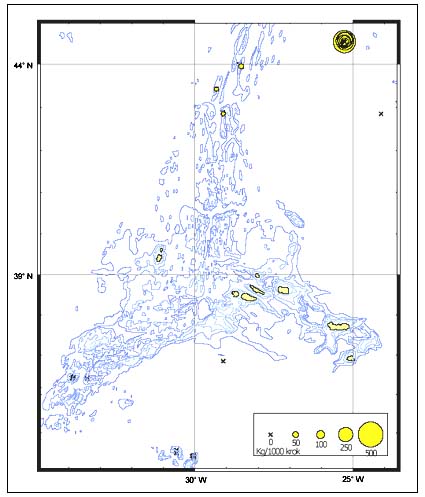
FIGURE 5
Catch-per-unit-of-effort for Centrophorus squamosus in kg
per haul during a trawl survey in September 1993
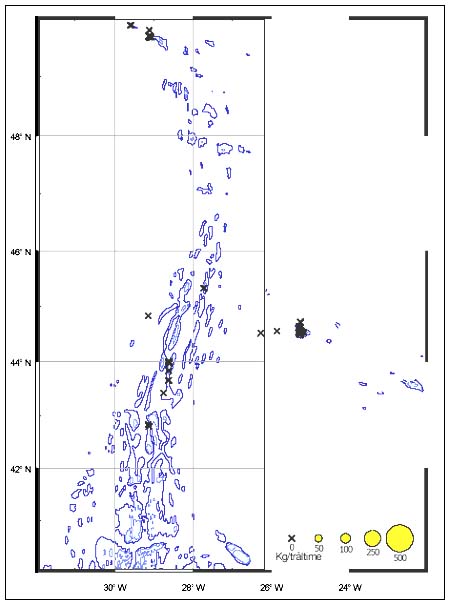
FIGURE 6
Catch-per-unit-of-effort for Centrophorus squamosus in kg
per 1000hooks during longline surveys in September 1999 and June
2000
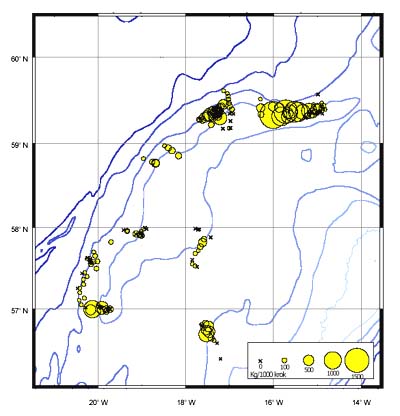
FIGURE 7
Catch-per-unit-of-effort for Centrophorus squamosus in kg
per haul during a trawl survey in September 1998
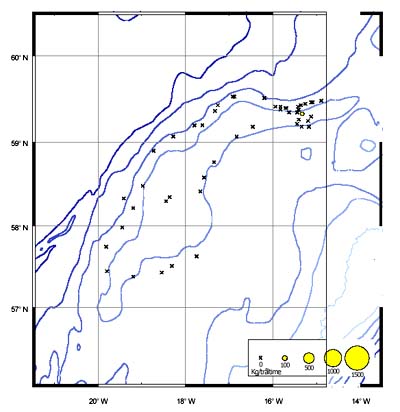
FIGURE 8
Catch-per-unit-of-effort for Centrophorus squamosus in kg
per 1000 hooks
during a longline survey in July–August 1997
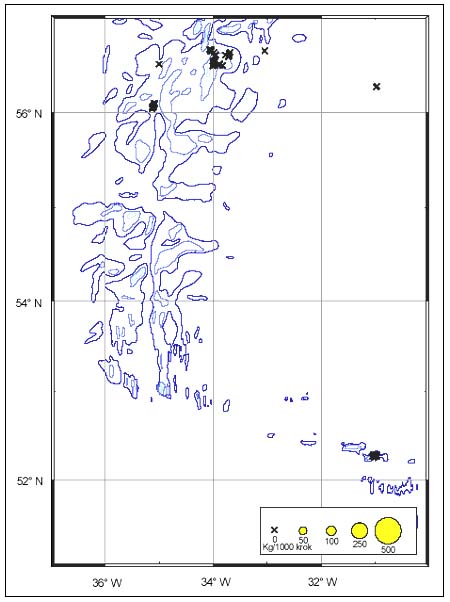
FIGURE 9
Variation in CPUE(kg per 1 000
hooks) for Centrophorus squamosus, based on
all longline surveys in the period 1991–2000
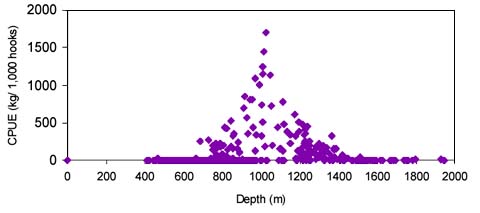
FIGURE 10
Variation in CPUE(kg per 1 000
hooks) for Centrophorus squamosus, based on longline surveys in 1999 and 2000
in ICES area VIb, Hatton Bank
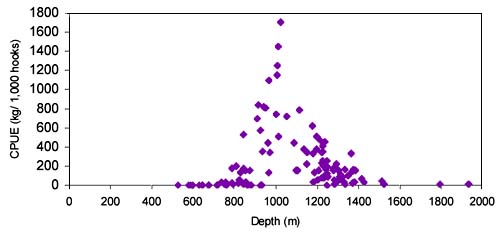
FIGURE 11
Variation in CPUE(kg per 1 000
hooks) for Centrophorus squamosus, based on longline surveys in 1999 and 2000
in ICES area XII, Hatton Bank
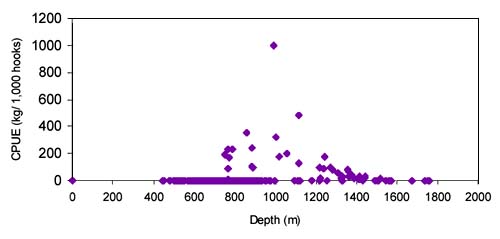
FIGURE 12
Variation in CPUE(kg per 1000 hooks) for Centrophorus squamosus, based on
a longline survey in 1997 in ICES area X, Mid-Atlantic Ridge
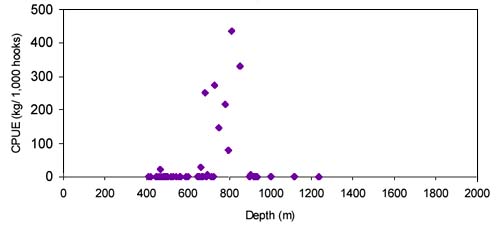
FIGURE 13
Variation in CPUEby depth and
by temperature for Centrophorus squamosus,
based on all longline surveys
where this species was caught
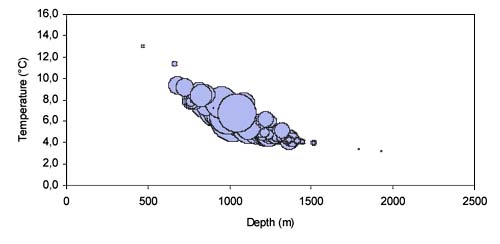
FIGURE 14
Length frequency for Centrophorus squamosus caught during
a longline survey in ICES area Vib in 1999
FIGURE 15
Length frequency for Centrophorus squamosus caught during
a longline survey in ICES area VIb in 2000
FIGURE 16
Length frequency for Centrophorus squamosus caught during
a longline survey in ICES area X in 1996
FIGURE 17
Length frequency for Centrophorus squamosus caught during
a longline survey in ICES area XII (Hatton Bank) in 1999
FIGURE 18
Length frequency for Centrophorus squamosus caught during
a longline survey in ICES area XII (Hatton Bank) in 2000
FIGURE 19
Length frequency for Centrophorus squamosus caught during
a longline survey in ICES area VIIc in 1996

FIGURE 20
Variation in mean length by depth for Centrophorus
squamosus comprizing all samples collected during all surveys
FIGURE 21
Variation in sex ratio (%) with depth in 100 m intervals
for Centrophorus squamosus comprizing all samples collected during all surveys
FIGURE 22
Frequency of occurrence of each maturity stage for
Centrophorus squamosus females from ICES areas VIb
and XII (Hatton Bank) in September 1999
FIGURE 23
Frequency of occurrence of each maturity stage for
Centrophorus squamosus females from ICES areas VIb
and XII (Hatton Bank) in June 2000
FIGURE 24
Catch-per-unit-of-effort for Centroscymnus coelolepis in
kg per 1 000 hooks during a longline survey in September 1996
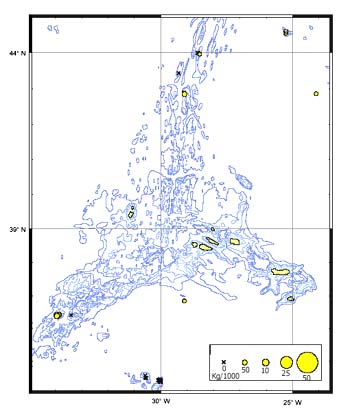
FIGURE 25
Catch-per-unit-of-effort for Centroscymnus coelolepis in
kg per haul during a trawl survey in September 1993
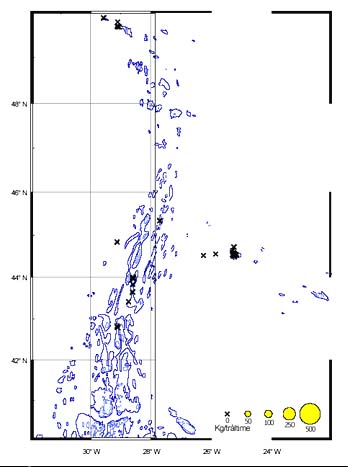
FIGURE 26
Catch-per-unit-of-effort for Centroscymnus coelolepis in
kg
per 1000 hooks during longline surveys in
September 1999 and June 2000
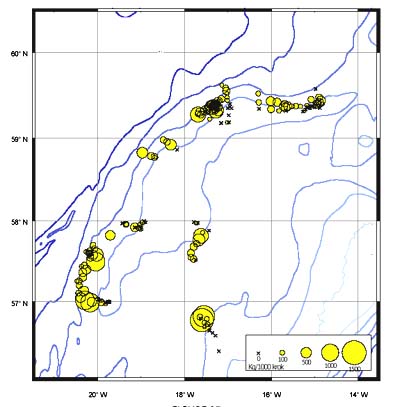
FIGURE 27
Catch-per-unit-of-effort for Centroscymnus coelolepis in
kg per haul during a trawl survey in September 1998
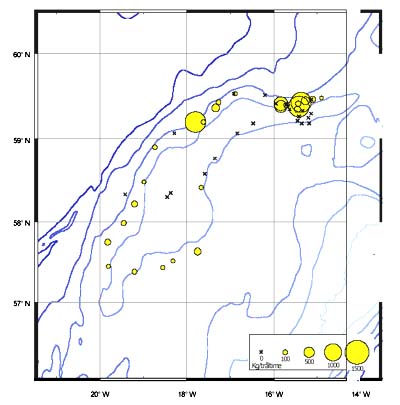
FIGURE 28
Catch-per-unit-of-effort for Centroscymnus coelolepis in
kg per 1000hooks during a longline survey in July–August 1997
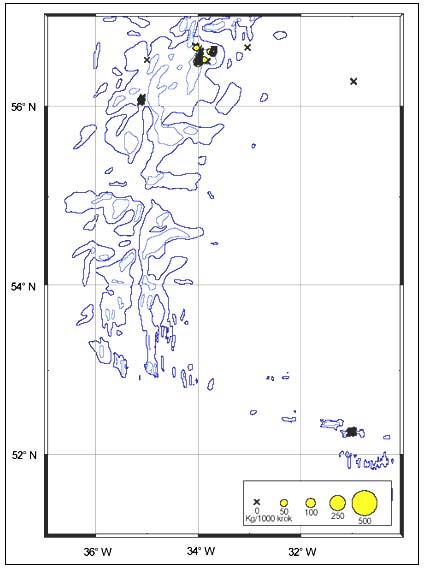
FIGURE 29
Variation in CPUE (kg per 1000 hooks) for Centroscymnus coelolepis, based on all longline
surveys in the period 1991–2000
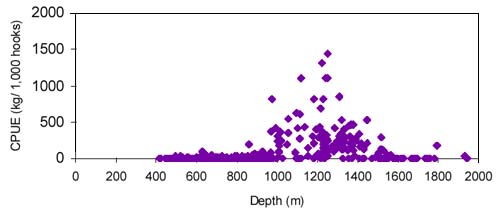
FIGURE 30
Variation in CPUE (kg per 1000 hooks) for Centroscymnus coelolepis, based on longline
surveys in 1999 and 2000 in ICES area VIb, Hatton Bank
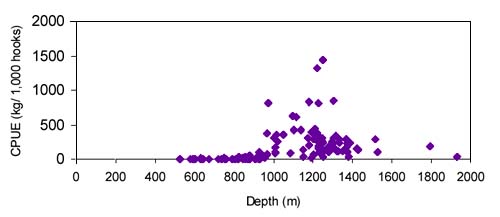
FIGURE 31
Variation in CPUE (kg per 1000 hooks) for Centroscymnus coelolepis, based on a longline
survey in 1997 in ICES area X, Mid-Atlantic Ridge
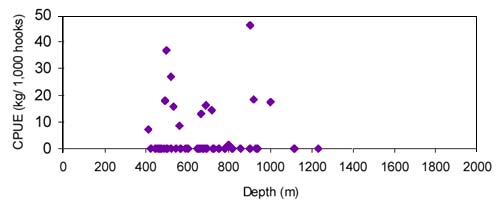
FIGURE 32
Variation in CPUE (kg per 1000 hooks) for Centroscymnus coelolepis, based on longline
surveys in 1999 and 2000 in ICES area XII, Hatton Bank
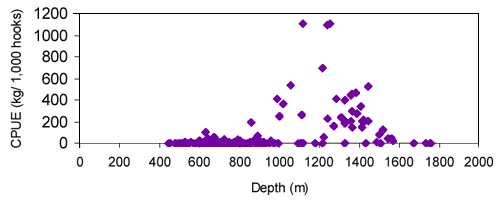
FIGURE 33
Variation in CPUE (kg per haul)
for Centroscymnus coelolepis, based on trawl surveys in 1993 and 1998
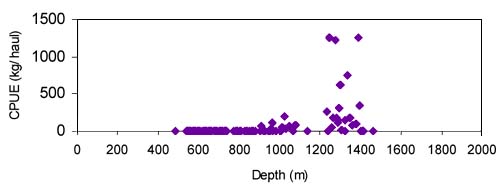
FIGURE 34
Variation in CPUE (kg per haul)
for Centroscymnus coelolepis, based on a trawl survey in 1998 in ICES area VIb
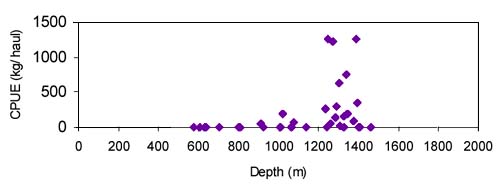
FIGURE 35
Variation in CPUE (kg per haul)
for Centroscymnus coelolepis, based on a trawl survey in 1998 in ICES area XII (Hatton Bank)
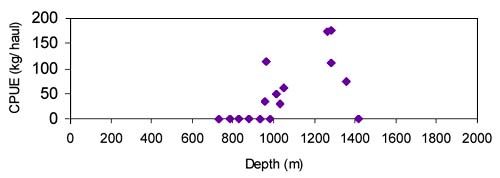
FIGURE 36
Variation in CPUE by depth and
temperature for Centroscymnus coelolepis, based on all longline surveys, where
this species was caught in the period 1991–2000

FIGURE 37
Length frequency for Centroscymnus coelolepis caught
during a longline survey
in ICES area VIb in 1999
FIGURE 38
Length frequency for Centroscymnus coelolepis caught
during a longline survey
in ICES area VIb in 2000
FIGURE 39
Length frequency for Centroscymnus coelolepis caught
during a longline survey
in ICES area XII (Mid-Atlantic Ridge) in 1997
FIGURE 40
Length frequency for Centroscymnus coelolepis caught
during a longline survey
in ICES area XII (Hatton Bank) in 1999
FIGURE 41
Length frequency for Centroscymnus coelolepis caught
during a longline survey
in ICES area XII (Hatton Bank) in 2000
FIGURE 42
Length frequency for Centroscymnus coelolepis caught
during a trawl survey
in ICES area XII (Hatton Bank) in 1998
FIGURE 43
Variation in mean length by depth for Centroscymnus
coelolepis comprizing all samples collected during all surveys
FIGURE 44
Variation in sex ratio (%) with depth in 100 m intervals
for Centroscymnus coelolepis comprizing all samples collected
during all surveys
FIGURE 45
Frequency of occurrence of each maturity stage for
Centroscymnus coelolepis females from ICES areas VIb
and XII (Hatton Bank) in June 1999
FIGURE 46
Frequency of occurrence of each maturity stage for
Centroscymnus coelolepis females from ICES areas VIb
and XII (Hatton Bank) in June 2000
5. LITERATURE CITED
Clarke, M. 2000. Aspects of the biology of three exploited deepwater sharks Centrophorus squamosus, Centroscymnus coelolepis and Deania calceus (Elasmobranchii: Squalidae) from the continental slopes of the Rockall Trough and Porcupine Bank. Phd. Thesis. Department of Zoology, University College, Belfield, Dublin, October 2000. 285 pp.
Hareide, N.-R. & G. Garnes 2001. The distribution and catch rates of deepwater fish along the Mid-Atlantic Ridge from 43° N to 61° N. Journal of Fisheries Research 51 (2001) 297–310.
Stehmann, M. 1998. Maturity Scale E 2 for aplacental and placental viviparous sharks. Hamburg: ISH. Unpublished report.
![]()
![]()
![]()