Annex 1: Example of Sampling Unit level data and results
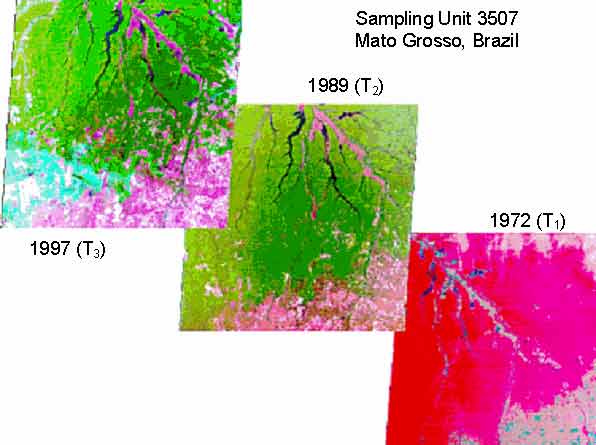
The images, statistical results and flux diagrams shown below exemplify one sampling unit of the 2000 Update study. The Unit represented is located in the State of Mato Grosso, Brazil, path 241, row 69 of the Landsat World Reference System. The images used, reproduced below, were acquired on 22 October 1972 (T1), 7 July 1989 (T2), and 13 July 1997 (T3). The T1 image shows a standard false color composite (forest in red), produced by Eros Data Center, USA, while the other two images present the current standard INPE band combination displaying the forest in green.
The table below shows part of the statistical results produced for the sampling unit 3507, located in the State of Mato Grosso, Brazil. The results here shown refer to the sequential matrices based on the area visible at all three dates, which is, in this case, 2,959,200 hectares. The sequential matrices should be read starting from the left side of the upper matrix, through the total T2 values between the two matrices, and ending at the left side of the lower matrix which shows the totals at T3.
In the lower section of the table the forest-related land cover classes are aggregated in various groupings to form three different definitions of forest, for the three dates.
The definitions of forest vary between F1 which includes only the class Closed Forest, to F3 which includes all land cover classes that present forest characteristics, no matter how degraded or fragmented. F2 is an intermediate definition which best corresponds to the FAO standard definition of forest applied in the approach based on existing country data (FORIS).
The annual change rates are then calculated for each definition of forest and for each period. The trend is then calculated as the percent variation of the annual change rate of the second period over that of the first period. The trends estimated for this sampling unit are very negative, ranging between 300.4 and 381.2 percent depending on the definition adopted. This means that in this area the mean annual rate of deforestation has increased three to four times.
|
Sampling Unit Code |
3507 |
|
|
|
date d/m/y |
years |
MX periods |
|
|
|
|
||
|
|
|
Date T1 image(s) |
05/08/73 |
22/10/72 |
1972.8 |
(years) |
|
Path/row |
241/69 |
|
|
|
|
|
|
Date T2 image |
07/07/89 |
1989.5 |
16.7 |
|
Path/row |
225/69 |
|
|
||
|
|
|
Date T3 image |
13/07/97 |
1997.5 |
8 |
|
Path/row |
225/69 |
|
|
||
|
|
|
|
|
|
|
|
|
|
|
|
|
|
|
|
|
Classes of T2 image |
|
|
||||||||
|
|
|
Closed |
Open |
Long |
Fragm. |
Shrub |
Short |
Other |
Water |
Manmade |
|
|
|
|
|
Forest |
Forest |
Fallow |
Forest |
|
Fallow |
Land |
|
Woody |
|
|
|
T1 image |
|
|
|
|
|
|
|
Cover |
|
Veg. |
|
|
|
|
Closed Forest |
2480.4 |
2346.4 |
9.6 |
8.4 |
14.8 |
13.6 |
5.6 |
82.0 |
|
|
|
|
|
|
Open Forest |
115.2 |
|
104.8 |
|
|
2.8 |
|
7.6 |
|
|
|
|
|
|
Long Fallow |
0.4 |
|
|
0.4 |
|
|
|
|
|
|
|
|
|
|
Fragm.Forest |
|
|
|
|
|
|
|
|
|
|
|
|
|
|
Shrubs |
318.4 |
|
|
|
|
276.4 |
|
41.6 |
0.4 |
|
|
|
|
|
Short Fallow |
|
|
|
|
|
|
|
|
|
|
|
|
|
|
Other Land Cover |
37.6 |
|
|
0.4 |
|
|
|
37.2 |
|
|
|
|
|
|
Water |
|
7.2 |
|
|
|
|
|
|
|
7.2 |
|
|
|
|
Manmade W.Veg |
|
|
|
|
|
|
|
|
|
|
|
|
|
|
|
|
|
|
|
|
|
|
|
|
|
|
|
|
Total T2----> |
2959.2 |
2346.4 |
114.4 |
9.2 |
14.8 |
292.8 |
5.6 |
168.4 |
7.6 |
|
|
|
|
|
|
|
|
|
|
|
|
|
|
|
|
|
|
|
T3 image |
|
|
|
|
|
|
|
|
|
|
|
|
|
|
Closed Forest |
2153.6 |
2153.2 |
|
|
|
|
|
|
0.4 |
|
|
|
|
|
Open Forest |
92.4 |
|
92.4 |
|
|
|
|
|
|
|
|
|
|
|
Long Fallow |
5.2 |
|
|
5.2 |
|
|
|
|
|
|
|
|
|
|
Fragm.Forest |
7.6 |
1.2 |
|
|
6.4 |
|
|
|
|
|
|
|
|
|
Shrubs |
|
293.6 |
12.8 |
0.4 |
1.2 |
3.6 |
263.2 |
0.4 |
11.6 |
0.4 |
|
|
|
|
Short Fallow |
2.8 |
|
|
|
0.4 |
|
2.4 |
|
|
|
|
|
|
|
Other Land Cover |
397.2 |
179.2 |
21.6 |
2.8 |
4.4 |
29.6 |
2.8 |
156.8 |
|
|
|
|
|
|
Water |
|
6.8 |
|
|
|
|
|
|
|
6.8 |
|
|
|
|
Manmade W.Veg |
|
|
|
|
|
|
|
|
|
|
|
|
|
|
|
2959.2 |
|
|
|
|
|
|
|
|
|
|
|
|
|
|
|
|
|
|
|
|
|
|
Period 1 |
Period 2 |
TREND |
|
forest fraction |
1972.9 |
|
1989.6 |
|
1997.6 |
|
|
|
1972.8 |
1989.5 |
(percent |
|
|
|
|
class area |
actual forest |
class area |
actual forest |
class area |
actual forest |
Forest Change |
1989.5 |
1997.5 |
of rate1) |
|
|
Closed Forest (F1) |
1 |
2480.4 |
2480.4 |
2346.4 |
2346.4 |
2153.6 |
2153.6 |
F1 Annual ‘000 ha |
-8.02 |
-24.10 |
300.4 |
||
|
Open Forest |
1 |
115.2 |
115.2 |
114.4 |
114.4 |
92.4 |
92.4 |
|
|
|
|
||
|
Long Fallow |
1 |
0.4 |
0.4 |
9.2 |
9.2 |
5.2 |
5.2 |
F2 Annual ‘000 ha |
-7.97 |
-26.95 |
337.9 |
||
|
Fragm.Forest |
0.33 |
|
|
14.8 |
4.9 |
7.6 |
2.5 |
|
|
|
|
||
|
Manmade W.Veg |
1 |
|
|
|
|
|
|
F3 Annual ‘000 ha |
-7.3 |
-27.65 |
381.2 |
||
|
Total |
|
|
|
2596.0 |
|
2474.9 |
|
2253.7 |
Annual compound rate % |
-0.29 |
-1.16 |
407.2 |
|
|
|
F2 |
|
2595.6 |
|
2462.4 |
|
2246.8 |
|
|
|
|
|
|
|
F3 |
|
2596.0 |
|
2474.9 |
|
2253.7 |
|
|
|
|
|
|
|
|
|
|
|
|
|
|
|
|
|
|
|
|
Definitions of Forest: |
F1 = Closed Forest |
|
|
|
|
|
|
|
|
||||
|
|
|
F2 = Closed Forest + Open Forest + 1/3 Fragmented Forest (best match with FORIS definition) |
||||||||||
|
|
|
F3 = Closed Forest + Open Forest + Fragmented Forest + Long Fallow |
|
|||||||||
While the transition matrices allow for a quantitative estimation of change rates (deforestation, degradation, etc.) they hardly provide a perceivable description of the associated processes. These can be obtained through the diagrams that relate the class-to-class transitions to estimated biomass values for the land cover classes involved. Although the biomass values, and consequent biomass fluxes, are often only indicative, nevertheless the diagrams clearly express the dynamics involved and allow for an inference of causes and typologies. Accompanied by knowledge of socio-economic setting, these results represent excellent objective tools for the understanding of the man-resource interaction and for the formulation of remedial policies.
The diagrams below show the processes of change during the two periods. The comparable scale allow to perceive the dramatic increment of deforestation rate, specially considering that the second diagram refers to a period (1989-1997) which is half of that covered by the first diagram.