![]()
![]()
![]()
Figure 45 shows the fish distribution from Liberia to Ghana, June 1981 and the dominant species in the catches are given in the figure. The total abundance within the part of the shelf surveyed is estimated to about 730 thousand tonnes. The uncovered shallow areas comprised about 10% of the shelf, and if one assumes the same densities in these areas as in the others, the total estimate for the whole shelf would be approximately 800 thousand tonnes. In the surveyed area 70% (500 t.tonnes) of the fish were classified as triggerfish, 17% (130 t.tonnes) as Pelagic 1 and 7% (50 t.tonnes) as Pelagic 2. The “Other Fish” group, consisting mostly of various demersal fishes, comprised only the remaining 7% (50 t. tonnes). Generally, demersal fish were seldom detected by the acoustic system as the species rarely formed aggregates in the area. This is also reflected in the catches in the bottom trawl, Table 11. The table shows that pelagic fish also dominate the bottom trawl catches. Of the typical bottom fish only the families Caproidae, Sparidae and Ariommidae contributed more than 1% to the total catch. Of the total catches in the pelagic trawl (Table 11), 90% is triggerfish, Balistes capriscus, while clupeids and anchovies only contribute 2% each to the catches. The carangids are almost absent from the catches with only 1% of the total catch.
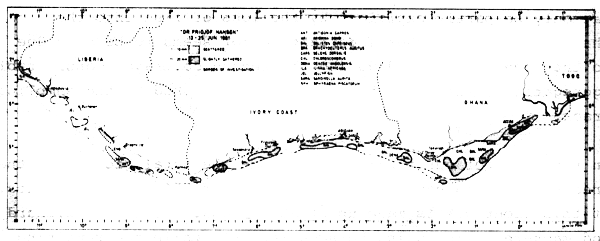
Fig. 45 Fish distribution from Liberia to Ghana, June 1981.
| % incidence in tot. no. of hauls | Mean c. of c. >1kg | % of total catch | MEAN CATCHES OF ALL HAULS REFERRED TO BOTTOM DEPTH STRATA | |||||||||
|---|---|---|---|---|---|---|---|---|---|---|---|---|
| GEAR: BOTTOM TRAWL | ||||||||||||
| NO OF HAULS: 17 TOTAL | 1 | 9 | 7 | 0 | ||||||||
| FAMILY | CATCH GROUPS (kg/h) | |||||||||||
| 1–9 | 10–49 | 50–199 | 200–499 | >500 | <20m | 20–50m | 50–200m | >200m | ||||
| BAL | 0 | 2 | 1 | 1 | 1 | 29 | 1085.2 | 48 | .0 | 600.8 | 2.7 | .0 |
| CAP | 0 | 0 | 0 | 1 | 1 | 12 | 1456.9 | 26 | .0 | .0 | 416.3 | .0 |
| SPA | 1 | 1 | 3 | 2 | 0 | 41 | 138.6 | 9 | .0 | 14.9 | 119.5 | .0 |
| CLU | 2 | 0 | 1 | 2 | 0 | 29 | 123.0 | 6 | 1.6 | 45.7 | 28.9 | .0 |
| CAR | 4 | 2 | 1 | 1 | 0 | 47 | 59.1 | 4 | .0 | 33.2 | 24.9 | .0 |
| ARM | 2 | 0 | 2 | 0 | 0 | 24 | 49.6 | 2 | .0 | .0 | 28.4 | .0 |
| MUL | 1 | 0 | 1 | 0 | 0 | 12 | 35.2 | 1 | .0 | 7.7 | .2 | .0 |
| PRI | 4 | 2 | 1 | 0 | 0 | 41 | 17.3 | 1 | .0 | 2.2 | 14.4 | .0 |
| SER | 0 | 3 | 0 | 0 | 0 | 18 | 16.9 | 1 | .0 | 1.1 | 5.8 | .0 |
| SPH | 2 | 1 | 1 | 0 | 0 | 24 | 33.4 | 1 | 5.2 | 14.3 | .0 | .0 |
| Other fish | 16.1 | 2 | ||||||||||
| MEAN CATCH OF ALL HAULS | 661.5 | 10.0 | 738.6 | 655.6 | .0 | |||||||
| TOTAL NUMBER OF HAULS 17 | 1 | 9 | 7 | 0 | ||||||||
| % incidence in tot. no.of hauls | Mean c. of c. >1kg | % of total catch | MEAN CATCHES OF ALL HAULS REFERRED TO BOTTOM DEPTH STRATA | |||||||||
|---|---|---|---|---|---|---|---|---|---|---|---|---|
| GEAR: PELAGIC TRAWL | ||||||||||||
| NO OF HAULS: 32 TOTAL | 1 | 13 | 18 | 0 | ||||||||
| FAMILY | CATCH GROUPS (kg/h) | |||||||||||
| 1–9 | 10–49 | 50–199 | 200–499 | >500 | >20m | 20–50m | 50–200m | >200m | ||||
| BAL | 0 | 2 | 6 | 2 | 6 | 50 | 1203.5 | 90 | .0 | 871.5 | 440.3 | .0 |
| CLU | 5 | 7 | 4 | 0 | 0 | 50 | 27.5 | 2 | 24.0 | 19.0 | 9.4 | .0 |
| ENG | 4 | 0 | 0 | 1 | 0 | 16 | 74.0 | 2 | .0 | 1.1 | 19.7 | .0 |
| JEL | 1 | 1 | 1 | 1 | 0 | 13 | 109.4 | 2 | .0 | 22.9 | 7.8 | .0 |
| ARM | 3 | 3 | 1 | 0 | 0 | 22 | 38.0 | 1 | .0 | .0 | 14.8 | .0 |
| CAR | 7 | 7 | 1 | 0 | 0 | 47 | 18.6 | 1 | 13.8 | 17.2 | 2.3 | .0 |
| SPH | 2 | 4 | 0 | 0 | 0 | 19 | 16.6 | 1 | .0 | 6.9 | .5 | .0 |
| Other fish | 5.2 | 0 | ||||||||||
| MEAN CATCH OF ALL HAULS | 666.1 | 135.0 | 941.8 | 496.4 | .0 | |||||||
| TOTAL NUMBER OF HAULS 32 | 1 | 13 | 18 | 0 | ||||||||
Liberia
Rough estimates of the biomass in Liberia in June 1981 were (1000 tonnes):
| Triggerfish | 2 |
| Pelagic 1 | 47 |
| Pelagic 2 | 40 |
| Other Fish | 37 |
| Total | 126 |
| Mean density | 24 tonnes/nm2 |
These estimates are for the surveyed shelf area, which was 92% of the shelf. The total estimate could be raised by roughly 10% to compensate for the unsurveyed shallow parts.
The low abundance of fish is also reflected in the catches from 15 trawl hauls, which yielded an average catch of 215 kg/hour. In the entire region from Liberia to Ghana the average catch was 660 kg/hour.
The Pelagic 1 group consists mainly of Sardinella aurita which occurred in 6 of 15 hauls (ratio of occurrence 6/15), S. maderensis (2/15) and Anchoa guineensis (4/15). The Pelagic 2 group consists mostly of Decapterus punctatus (6/15).
Ivory Coast
The biomass estimates for the Ivory Coast were (1000 tonnes):
| Triggerfish | 188 |
| Pelagic 1 | 39 |
| Pelagic 2 | 2 |
| Other Fish | 1 |
| Total | 230 |
| Mean density | 77 tonnes/nm2 |
The shallow uncovered parts are 17% of the total shelf, and the total estimate could be raised to 280 thousand tonnes to compensate for this.
The triggerfish amounted to 80% of the total catch in the area. The Pelagic 1 group consisted of Sardinella aurita, S. maderensis and Anchoa guineensis with ratios of occurrence 6/11, 7/11 and 4/11 respectively. The resources belonging to the Pelagic 2 group seem very small, but Caranx chrysos and Selene dorsalis were present in the catches.
Ghana
The resources in Ghana were estimated to be (thousand tonnes):
| Triggerfish | 314 |
| Pelagic 1 | 40 |
| Pelagic 2 | 10 |
| Other Fish | 14 |
| Total | 378 |
| Mean density | 57 tonnes/nm2 |
The shallow unsurveyed areas make up 8% of the total shelf, and the total estimate can be raised to 410 thousand tonnes to roughly correct for this.
As off the Ivory Coast the triggerfish is the dominant species comprising 82% of the total estimated fish abundance. The Pelagic 1 group consists of Sardinella aurita, S. maderensis and Anchoa guineensis with ratios of occurrence 6/23, 9/23 and 2/23 respectively. The sardinella occurred together with the triggerfish in the area, and it proved impossible to separate the species quantitatively by the traces of the echogrammes. Furthermore, the catchability of the species for the gears used is likely to be unequal but unknown. The composition in the catches could therefore not be used directly to split the species. The estimate of the Pelagic 1 group is thus very uncertain. The triggerfish was, however, clearly dominant on all locations, so the aforementioned problems would have less affect on that estimate.
The Pelagic 2 group consists of Decapterus punctatus and D. rhonchus with ratios of occurrence 8/23 and 3/23 respectively. Other carangids found were Chloroscombrus crysurus, Selene dorsalis and Caranx crysos.
The clupeoids along the coast from Liberia to Ghana consisted of anchovy and round and flat sardinellas. For the Ivory Coast the clupeoids are perhaps overestimated. Off Ghana the sardinella was extensively mixed with triggerfish and the estimate of stock biomass is as mentioned above unfortunately not very reliable.
The carangids (Pelagic 2 group) were not located in substantial quantities in the eastern part of the area. In Liberia, 40 thousand tonnes were allocated to the group, mainly of Decapterus punctatus. There the species formed the southern part of the same population as found off Ghana and Sierra Leone.
![]()
![]()
![]()