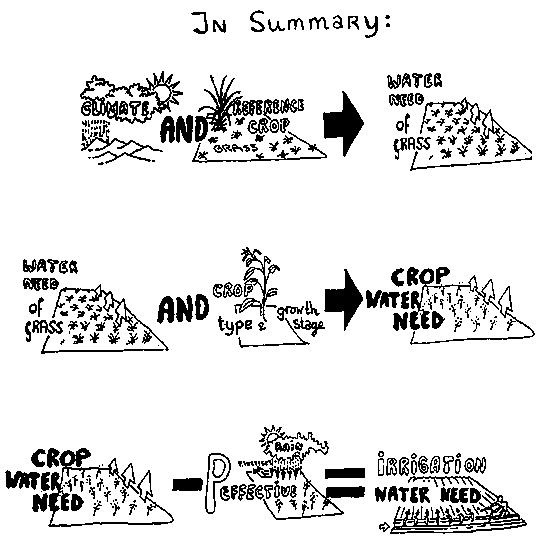
The irrigation water need of a certain crop is the difference between the crop water need and that part of the rainfall which can be used by the crop (the effective rainfall).
For each of the crops grown on an irrigation scheme the crop water need is determined, usually on a monthly basis; the crop water need is expressed in mm water layer per time unit, in this case mm/month.
The effective precipitation is estimated on a monthly basis, using measured rainfall data and Table 6 (or local information, if available).
For all crops and for each month of the growing season, the irrigation water need is calculated by subtracting the effective rainfall from the crop water need.

EXAMPLE
Suppose a tomato crop grown in a certain area has a total growing season of 150 days and the following monthly crop water needs:
|
|
Feb |
Mar |
Apr |
May |
June |
Total |
|
Crop water need (mm/month) |
69 |
123 |
180 |
234 |
180 |
786 |
This means that in February the tomatoes need 69 mm of water, in March 123 mm of water, etc. The water need of tomatoes over the total growing season (February-June: 150 days) is 786 mm.
Suppose the following rainfall data for the area where the tomatoes are grown have been obtained from the Meteorological Service or Ministry of Agriculture.
|
|
Feb |
Mar |
Apr |
May |
June |
Total |
|
Rainfall: P (mm/month) |
20 |
38 |
40 |
80 |
16 |
194 |
This means that the average rainfall for February is 20 mm, for March 38 mm, etc. The rainfall over the total growing season of tomatoes (February-June: 150 days) is 194 mm.
Only part of this rainfall is effective, and the effective rainfall is estimated using Table 6.
|
|
Feb |
Mar |
Apr |
May |
June |
Total |
|
Rainfall: P (mm/month) |
20 |
38 |
40 |
80 |
16 |
194 |
|
Effective rainfall: Pe (mm/month) |
2 |
13 |
14 |
39 |
0 |
68 |
This means that the effective rainfall during February is only 2 mm, during April 13 mm, etc. The effective rainfall during the total growing season of tomatoes (February-June: 150 days) is 68 mm.
Now the Irrigation water need for the tomatoes can be calculated on a monthly basis, as follows:
|
|
Feb |
Mar |
Apr |
May |
June |
Total |
|
Crop water need (mm/month) |
69 |
123 |
180 |
234 |
180 |
786 |
|
Effective rainfall: Pe (mm/month) |
2 |
13 |
14 |
39 |
0 |
68 |
|
Irrigation water need (mm/month) |
67 |
110 |
166 |
195 |
180 |
718 |
Looking at the example for the month March, it can be seen that tomatoes need 123 mm during March. Of this 123 mm, 13 mm is supplied by the rainfall. The remaining (123 -13 =) 110 mm have to be supplied by irrigation. The total water need of tomatoes over the entire growing season is 786 mm of which 68 mm is supplied by rainfall. The remaining quantity (786 - 68 = 718 mm) has to be supplied by irrigation.
When looking at the calculations above, it is obvious that the month May is the month of peak irrigation water need (195 mm Irrigation water in May). If the tomatoes would be the only crop grown on the Irrigation scheme, the canals would have to be designed in such a way that they allow a flow large enough to supply indeed a net water layer of 195 mm to the whole area covered by tomatoes during the month May. In other words, for designing an irrigation scheme, the month of peak water supply is the critical month.
How to go about determining the scheme irrigation water supply and how to divide the irrigation water between the various crops and fields will be dealt with in Volume 4 of the Irrigation Water Management Training Manuals.
