The pattern of worker welfare is interesting. For some economies (numbers 1-4 and 12-15), worker welfare declines more under this policy compared to the flexible exchange rate policy, while for the other economies the decline is smaller. To delve into the reasons for this consider expression (5.4) for the change in worker welfare, and use the expressions for the change in the nominal wage and the domestic prices from Appendix B (equations B.27, B.28 and B.39). By substitution we obtain the following expression for the change in worker welfare.
![]() (8.1)
(8.1)
where, using the notation of Appendix B
 (8.2)
(8.2)
and
![]() (8.3)
(8.3)
Under regime Ac the changes in the two domestic prices are determined by the exchange rate changes and the exogenous price changes.
![]() (8. 4)
(8. 4)
![]() (8.5)
(8.5)
where ![]() denotes
the exchange rate adjustment. Under regime Ar the
exchange rate does not adjust and instead the implicit tariff tmr
adjusts. The corresponding changes in domestic prices are
denotes
the exchange rate adjustment. Under regime Ar the
exchange rate does not adjust and instead the implicit tariff tmr
adjusts. The corresponding changes in domestic prices are
![]() (8.6)
(8.6)
![]() (8.7)
(8.7)
If we substitute expressions (8.4) and (8.5) in (8.1 ) we
obtain the change in worker welfare ![]() under regime Ac. If we use
expressions (8.6) and (8.7) we obtain the change in worker
welfare under regime Ar. If we take the difference
between these two expressions we obtain
under regime Ac. If we use
expressions (8.6) and (8.7) we obtain the change in worker
welfare under regime Ar. If we take the difference
between these two expressions we obtain
![]() (8.8)
(8.8)
It has already been noted in the discussion of Table 18 that
the increase in the implicit tariff ![]() is larger than the increase in the
exchange rate under regime Ac. Hence the second term
in (8.8) is always positive. The first term will be positive
(negative) if
is larger than the increase in the
exchange rate under regime Ac. Hence the second term
in (8.8) is always positive. The first term will be positive
(negative) if ![]() .
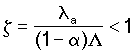
The parameter
.
The parameter ![]() is
a structural parameter in the economy and depends on the share of
labour employed in agriculture and the value added shares of
labour and imports in the two sectors. If
is
a structural parameter in the economy and depends on the share of
labour employed in agriculture and the value added shares of
labour and imports in the two sectors. If ![]() is smaller than the share of food in
private expenditure, then it is possible that the expression
(8.8) is negative, in which case the decline in worker welfare is
smaller under the rationing regime. It can indeed be seen from
Table 1 that all economies for which the change in worker welfare
is higher under Ar compared to regime Ac
are characterized by a relatively large food budget share. In
fact it can be easily calculated from the figures of Table 1 that
these economies exhibit negative and large in absolute terms
values of
is smaller than the share of food in
private expenditure, then it is possible that the expression
(8.8) is negative, in which case the decline in worker welfare is
smaller under the rationing regime. It can indeed be seen from
Table 1 that all economies for which the change in worker welfare
is higher under Ar compared to regime Ac
are characterized by a relatively large food budget share. In
fact it can be easily calculated from the figures of Table 1 that
these economies exhibit negative and large in absolute terms
values of ![]()
The conclusion from the above analysis is that if a developing economy responds to an external terms of trade shock by adjusting the exchange rate, then it is likely to lose surplus, in addition to losses in GDP and worker welfare. If, on the other hand, it responds by rationing imports, then it will most likely increase the amount of generated surplus, at the cost of reduced GDP, and in many case reduced worker welfare. However, the possibility exists, especially in least developed economies with large food budget shares, that the negative external shock can produce both increased surplus, as well as improved worker welfare.
We now turn to responses induced by changes in the availability of external finance. Table 19 present the responses of our 20 stylized economies to a decrease in the volume of external finance (F) equal to one percent of base GDP. Under flexible exchange rates this leads to a devaluation, increases in exports and decreases in imports, as one would expect from increases in the domestic prices of exports and imports. Gross domestic product, as well as worker welfare decline, and the volume of surplus declines significantly, especially for those least developed economies that initially are characterized by low volumes of total surplus.
Table 20 presents the same responses under the import rationing regime. It can be seen that under import rationing the implicit tariff increases by more than the devaluation of the exchange rate under regime Ac. The welfare of workers declines by mote in all cases, export volumes increase by less, while import volumes decline by more, compared to responses under the flexible exchange rate regime. GDP declines by less, and the increase in agricultural production along with the decline in non-agricultural production are smaller. The volume of surplus, however, declines by smaller amounts compared to the flexible exchange rates. The conclusion is that under import rationing the surplus declines by less under an external financing decline, compared to a policy of flexible exchange rates. The cost is lower worker welfare.
The results in this Chapter might help understand the responses of several developing countries under shocks in the early 1980s. It was shown here that under import rationing the volume of surplus would adjust in a more favourable fashion compared to a policy of flexible exchange rates.
Clearly if most of the surplus is appropriated by the government, then overvaluation seems like a rational response on its part.
Table 19 Responses (percent changes) to a 1 percent decrease in the availability of external finance (as a share of GDP) under flexible exchange rate
| Economy type |
Exchange rate |
Worker welfare |
Export volume |
Import volume |
Profits |
Taxes* | Surplus | GDP | Production of | Consumption of | ||
| Agriculture | Non- agriculture |
Agriculture | Non agriculture |
|||||||||
| 1 | 1.10 | -0.32 | 1.84 | -2.93 | -1.82 | 0.00 | -8.98 | -0.53 | 0.26 | -1.82 | -0.84 | -0.04 |
| 2 | 1.08 | -0.30 | 2.06 | -3.05 | -1.97 | 0.00 | -9.64 | -0.52 | 0.32 | -1.97 | -0.66 | -0.05 |
| 3 | 1.04 | -0.26 | 2.41 | -3.11 | -2.07 | 0.00 | -10.34 | -0.48 | 0.36 | -2.07 | -0.58 | 0.00 |
| 4 | 1.06 | -0.27 | 2.68 | -3.32 | -2.25 | 0.00 | -11.25 | -0.49 | 0.34 | -2.25 | -0.53 | -0.00 |
| 5 | 0.89 | -0.46 | 3.27 | -3.73 | -2.84 | 0.00 | -23.84 | -0.57 | 0.37 | -2.84 | -0.42 | -0.50 |
| 6 | 0.81 | -0.40 | 4.04 | -3.79 | -2.98 | 0.00 | -26.48 | -0.51 | 0.39 | -2.98 | -0.42 | -0.37 |
| 7 | 1.17 | -0.39 | 5.75 | -4.57 | -3.40 | 0.00 | -20.59 | -0.57 | 0.43 | -3.40 | -0.41 | -0.37 |
| 8 | 0.85 | -0.41 | 4.64 | -4.26 | -3.41 | 0.00 | -30.13 | -0.52 | 0.38 | -3.41 | -0.39 | -0.45 |
| 9 | 0.53 | -0.38 | 4.02 | -3.88 | -3.35 | 0.00 | -58.64 | -0.43 | 0.38 | -3.35 | -0.35 | -0.44 |
| 10 | 0.85 | -0.34 | 5.38 | -4.95 | -4.10 | 0.00 | -35.10 | -0.46 | 0.49 | -4.10 | 0.21 | -0.65 |
| 11 | 0.52 | -0.32 | 4.61 | -4.58 | -4.06 | 0.00 | -68.40 | -0.38 | 0.48 | -4.05 | -0.17 | -0.68 |
| 12 | 1.78 | -0.29 | 3.35 | -3.53 | -1.75 | 0.00 | -6.34 | -0.61 | 0.36 | -1.75 | -1.22 | 0.22 |
| 13 | 1.77 | -0.27 | 3.64 | -3.69 | -1.92 | 0.00 | -6.81 | -0.60 | 0.44 | -1.92 | -0.93 | 0.18 |
| 14 | 1.67 | -0.22 | 4.19 | -3.67 | -2.00 | 0.00 | -7.24 | -0.56 | 0.49 | -2.00 | -0.80 | 0.25 |
| 15 | 1.72 | -0.24 | 4.58 | -3.92 | -2.19 | 0.00 | -7.86 | -0.58 | 0.47 | -2.19 | -0.71 | 0.24 |
| 16 | 1.50 | -0.39 | 5.59 | -4.30 | -2.80 | 0.00 | -12.69 | -0.64 | 0.58 | -2.80 | -0.45 | -0.33 |
| 17 | 1.45 | -0.38 | 6.61 | -4.39 | -2.94 | 0.00 | -13.94 | -0.61 | 0.52 | -2.94 | -0.50 | -0.19 |
| 18 | 1.47 | -0.33 | 7.61 | -4.82 | -3.34 | 0.00 | -15.77 | -0.57 | 0.57 | -3.34 | -0.38 | -0.24 |
| 19 | 1.06 | -0.30 | 5.93 | -4.38 | -3.32 | 0.00 | -20.51 | -0.48 | 0.55 | -3.32 | -0.30 | -0.29 |
| 20 | 0.99 | -0.25 | 6.10 | -4.22 | -3.23 | 0.00 | -20.42 | -0.42 | 0.59 | -3.23 | -0.28 | -0.19 |
Table 20 Responses (percent changes) to a 1 percent decrease in the availability of external finance (as a share of GDP)
| Economy type |
Change in implicit tariff |
Worker welfare |
Export volume |
Import volume |
Profits |
Taxes* | Surplus | GDP | Production of | Consumption of | ||
| Agriculture | Non- agriculture |
Agriculture | Non agriculture |
|||||||||
| 1 | 2.16 | -0.61 | 0.89 | -3.88 | -1.72 | 0.45 | -5.63 | -0.31 | 0.15 | -1.72 | -0.36 | -0.74 |
| 2 | 2.12 | -0.56 | 1.20 | -3.91 | -1.79 | 0.41 | -6.28 | -0.30 | 0.19 | -1.79 | -0.39 | -0.67 |
| 3 | 2.13 | -0.51 | 1.48 | -4.03 | -1.91 | 0.39 | -6.99 | -0.30 | 0.22 | -1.91 | -0.36 | -0.64 |
| 4 | 2.16 | -0.49 | 1.81 | -4.19 | -2.02 | 0.36 | -7.78 | -0.30 | 0.21 | -2.02 | -0.39 | -0.59 |
| 5 | 1.95 | -0.57 | 2.59 | -4.41 | -2.46 | 0.28 | -17.60 | -0.38 | 0.24 | -2.46 | -0.40 | -0.77 |
| 6 | 1.92 | -0.51 | 3.24 | -4.59 | -2.68 | 0.24 | -20.43 | -0.36 | 0.28 | -2.68 | -0.38 | -0.70 |
| 7 | 2.93 | -0.50 | 4.52 | -5.79 | -2.86 | 0.28 | -15.18 | -0.36 | 0.27 | -2.86 | -0.40 | -0.69 |
| 8 | 1.95 | -0.49 | 4.02 | -4.89 | -2.94 | 0.22 | -23.80 | -0.36 | 0.26 | -2.94 | -0.41 | -0.62 |
| 9 | 1.21 | 0.45 | 3.61 | -4.29 | -3.08 | 0.15 | 49.91 | -0.34 | 0.30 | -3.08 | -0.36 | -0.61 |
| 10 | 1.93 | -0.40 | 5.06 | -5.27 | -3.35 | 0.19 | -28.57 | -0.31 | 0.33 | -3.35 | -0.34 | -0.55 |
| 11 | 1.10 | -0.36 | 4.67 | 4.52 | -3.42 | 0.12 | -60.04 | -0.29 | 0.36 | -3.42 | -0.32 | -0.44 |
| 12 | 4.06 | -0.66 | 1.22 | -5.67 | -1.61 | 0.59 | -3.49 | -0.28 | 0.16 | -1.61 | 0.39 | -0.80 |
| 13 | 4.01 | -0.60 | 1.65 | -5.68 | -1.67 | 0.55 | -3.89 | -0.27 | 0.20 | -1.67 | -0.42 | -0.72 |
| 14 | 4.05 | -0.55 | 2.03 | -5.83 | -1.78 | 0.52 | -4.32 | -0.27 | 0.24 | -1.78 | -0.39 | -0.69 |
| 15 | 4.13 | -0.53 | 2.49 | -6.01 | -1.88 | 0.49 | -4.79 | -0.28 | 0.23 | -1.88 | -0.42 | -0.63 |
| 16 | 3.94 | -0.56 | 3.70 | -6.19 | -2.25 | 0.40 | -8.21 | -0.33 | 0.30 | -2.25 | -0.39 | -0.77 |
| 17 | 4.08 | -0.54 | 4.45 | -6.55 | -2.47 | 0.37 | -9.39 | -0.34 | 0.29 | -2.47 | -0.40 | -0.74 |
| 18 | 4.16 | -0.48 | 5.54 | -6.89 | -2.72 | 0.33 | -10.99 | -0.33 | 0.32 | -2.72 | -0.38 | -0.66 |
| 19 | 2.69 | -0.43 | 4.83 | -5.48 | -2.79 | 0.26 | -15.49 | -0.30 | 0.35 | -2.79 | -0.36 | -0.54 |
| 20 | 2.63 | -0.39 | 4.88 | -5.43 | -2.80 | 0.25 | -15.61 | -0.28 | 0.39 | -2.80 | -0.32 | -0.54 |