


What growth rates have occurred?
Table 11 shows the recent growth rates for all Asia-Pacific economies for which such information could be found in a comparable form. There is clearly a wide performance spectrum.
In his overview of current economic trends in the whole region, Edwards (1997) reports that the two decades from 1974 to 1994 witnessed the developing economies of Asia and the Pacific sustain an average growth rate of about seven times that of the world average. East Asia led but South Asia, although slower, was also above the world average. China's economy is reported to have doubled in just six years (Naisbitt (1996)). According to Hohol (1997), in the "four tigers" (Republic of Korea, Hong Kong SAR, China, Taiwan Province of China and Singapore) real GDP doubled every eight years between 1960-1985. Republic of Korea, whose GDP per capita was in 1962 identical to Sudan's at $110 and Taiwan Province of China, whose income at $160 was equivalent to that of the former Zaire in the same year, are now practically developed countries.
Thus, while forty years ago Asian economies produced less than 5% of global GNP, by 1990, this share had reached 25% and is still growing rapidly. Based on pre-crisis expectations, Hohol (1997) speculated that by the turn of the century, Asia's economy was likely to be bigger than either North America's or western Europe's while another ten years later, in 2020, Asia's economy could be larger than that of North America and western Europe combined. Hohol further speculated that "in the quarter-century after 1995, Asia will account for half the world-wide sales growth in the markets for almost every product and service save the most advanced ...".
According to Naisbitt (1996), there are fundamental shifts occurring even within Asia as a group of developing countries in that region begin to catch up with the industrialised world: Japanese exports to OECD countries fell from 9% in 1986 to 7.7% in 1994. In the same period, the 10 emerging Asian economies (China, India, Taiwan Province of China, Republic of Korea, Hong Kong SAR, China, Indonesia, Malaysia, the Philippines, Singapore and Thailand) increased their share of the OECD market from 9.8 to 14.5%.
Table 11 - Asia-Pacific countries/territories - 1978-1998 Real GDP Growth (% per annum)
Country/territory |
1978-88 |
1988 |
1989 |
1990 |
1991 |
1992 |
1993 |
1994 |
1995 |
1996 |
1997 |
1998 |
Advanced Industrial Economies (AIEs) |
||||||||||||
Australia |
3.2 |
4.7 |
4.4 |
1.5 |
-1.1 |
2.3 |
3.5 |
5.4 |
3.2 |
3.6 |
2.2 |
2.9 |
Japan |
3.0 |
5.7 |
4.4 |
4.7 |
3.6 |
0.7 |
-0.1 |
0.3 |
0.7 |
4.0 |
3.2 |
3.7 |
New Zealand |
2.0 |
3.9 |
-1.4 |
0.1 |
-3.7 |
0.3 |
5.5 |
4.1 |
2.2 |
2.7 |
3.7 |
3.0 |
Newly Industrialising Economies (NIEs) |
||||||||||||
Hong Kong SAR, China* |
8.3 |
8.0 |
2.6 |
3.4 |
5.1 |
6.3 |
6.4 |
5.4 |
5.0 |
4.7 |
4.7 |
5.3 |
Korea, Rep. of |
7.7 |
11.3 |
6.4 |
9.5 |
9.1 |
5.1 |
5.8 |
8.6 |
9.0 |
9.0 |
7.0 |
6.9 |
Singapore |
6.9 |
11.1 |
9.6 |
8.8 |
6.7 |
6.0 |
10.1 |
10.1 |
8.9 |
8.8 |
7.0 |
8.0 |
Taiwan Province of China |
8.7 |
7.8 |
8.2 |
5.4 |
7.6 |
6.8 |
6.3 |
6.5 |
6.1 |
6.0 |
5.7 |
6.3 |
North Asia |
||||||||||||
China, PR of |
9.5 |
11.3 |
4.1 |
3.8 |
9.3 |
14.2 |
13.5 |
12.6 |
10.2 |
9.7 |
9.0 |
8.0 |
Mongolia |
6.5 |
8.5 |
4.2 |
-5.6 |
-9.2 |
-9.5 |
-3.0 |
2.3 |
6.3 |
2.6 |
3.5 |
4.5 |
Korea, D.P.R. * |
n.a |
n.a |
n.a |
n.a |
n.a |
n.a |
n.a |
n.a |
-5.0 |
n.a |
n.a | |
SE Asia |
||||||||||||
Brunei |
||||||||||||
Cambodia |
9.9 |
3.5 |
1.2 |
7.6 |
7.0 |
4.1 |
4.0 |
7.6 |
6.0 |
6.4 |
7.0 | |
Indonesia |
5.2 |
5.8 |
9.1 |
9.0 |
8.9 |
7.2 |
7.3 |
7.5 |
8.1 |
7.8 |
8.0 |
7.0 |
Lao, PDR of |
5.0 |
-2.1 |
9.9 |
6.7 |
4.0 |
7.0 |
5.9 |
8.1 |
7.1 |
6.9 |
7.2 |
7.4 |
Malaysia |
5.6 |
8.9 |
9.0 |
9.7 |
8.6 |
7.8 |
8.3 |
9.2 |
9.5 |
8.8 |
8.5 |
8.5 |
Myanmar |
3.8 |
-11.4 |
3.7 |
2.8 |
-0.7 |
9.7 |
5.9 |
6.8 |
7.2 |
6.0 |
.. |
.. |
Philippines |
1.8 |
6.8 |
6.2 |
3.0 |
-0.6 |
0.3 |
2.1 |
4.4 |
4.8 |
5.5 |
6.0 |
6.5 |
Thailand |
6.4 |
13.3 |
12.2 |
11.6 |
8.1 |
8.1 |
8.3 |
8.8 |
8.7 |
6.7 |
6.1 |
6.6 |
Vietnam |
4.5 |
5.1 |
7.8 |
4.9 |
6.0 |
8.6 |
8.1 |
8.8 |
9.5 |
9.5 |
9.5 |
9.3 |
South Asia |
||||||||||||
Bangladesh |
4.1 |
3.5 |
5.0 |
5.1 |
4.1 |
4.8 |
4.8 |
4.7 |
4.7 |
4.7 |
5.4 |
6.0 |
Bhutan |
7.8 |
1.1 |
4.7 |
6.6 |
3.5 |
4.1 |
5.7 |
6.0 |
7.0 |
6.4 |
.. |
.. |
India |
4.5 |
8.7 |
7.4 |
5.9 |
1.7 |
4.1 |
4.2 |
5.7 |
6.8 |
6.8 |
7.0 |
7.0 |
Maldives |
9.5 |
8.7 |
9.3 |
16.2 |
7.6 |
6.3 |
6.2 |
6.6 |
7.2 |
6.5 |
.. |
.. |
Nepal |
3.2 |
4.3 |
4.6 |
6.4 |
4.1 |
3.4 |
7.1 |
3.0 |
5.8 |
6.1 |
4.5 |
5.0 |
Pakistan |
6.5 |
4.8 |
4.7 |
5.6 |
8.2 |
5.0 |
0.8 |
3.8 |
4.5 |
6.1 |
5.2 |
6.5 |
Sri Lanka |
5.0 |
2.7 |
2.3 |
6.2 |
4.6 |
4.3 |
0.9 |
5.6 |
5.4 |
3.8 |
5.7 |
5.9 |
Pacific Islands |
||||||||||||
Cook Islands |
-0.3 |
6.4 |
10.5 |
0.4 |
0.4 |
.. |
.. |
.. |
.. | |||
Fiji |
1.7 |
3.5 |
13.9 |
3.2 |
1.5 |
4.8 |
3.5 |
4.2 |
2.4 |
.. |
.. |
.. |
Guam |
||||||||||||
Kiribati |
-5.8 |
10.6 |
-2.2 |
-3.2 |
2.8 |
-1.6 |
0.9 |
1.8 |
2.5 |
.. |
.. |
.. |
Marshall Is. |
.. |
5.1 |
-1.7 |
3.2 |
0.1 |
0.1 |
4.1 |
2.8 |
3.7 |
.. |
.. |
.. |
Micronesia. |
.. |
3.6 |
-1.7 |
-2.7 |
4.3 |
-1.2 |
5.7 |
1.4 |
1.0 |
.. |
.. |
.. |
N. Mariana Is. |
||||||||||||
New Caledonia |
||||||||||||
PNG |
2.2 |
2.9 |
-1.4 |
-3.0 |
9.5 |
11.8 |
16.6 |
5.6 |
-4.7 |
.. |
.. |
.. |
Solomon Is. |
2.6 |
1.3 |
4.3 |
1.0 |
2.0 |
12.3 |
4.0 |
5.8 |
6.9 |
.. |
.. |
.. |
Tonga |
-2.7 |
5.8 |
-0.4 |
3.1 |
4.1 |
1.6 |
.. |
.. |
.. | |||
Vanuatu |
2.9 |
0.6 |
4.5 |
5.2 |
4.5 |
-0.7 |
4.4 |
2.6 |
3.2 |
.. |
.. |
.. |
Western Samoa |
2.4 |
-1.5 |
6.4 |
-9.4 |
-2.1 |
-0.9 |
6.3 |
-7.8 |
6.7 |
.. |
.. |
.. |
Sources: For developing countries, Table A2, AsDB Outlook 1996-97 unless otherwise declared. For advanced industrial economies, IMF "World Economic Outlook", October 1996 & May 1997. 1996 - 1998 data from Table A1 of AsDB Outlook 1997/98. * From World Factbook, US Govt. (CIA Website)
Taking into account a range of countries, the World Bank (1995a) reported 1994 Asian regional growth at 9 to 10%, about the same as in 1993. It was associated with export growth's acceleration to 16% (from 13% in 1993) and particularly fast growth of intra-regional trade. Table 2 summarises recent growth rates for total and per capita GDP. The variation among countries was considerable: Edwards (1997) reports that between 1965 and 1980, South Asia growth has averaged about 1.4% compared with an average of 4.5% for the whole of Asia and the Pacific. By contrast, in the case of PR China, growth has been so fast (accompanied by inflation in double-digits) that government sought to avoid overheating and was implementing an austerity programmes aimed at slowing down growth from about 14% to 11.5 to 12%. Very rapid growth in an economy of PR China's size can, if sustained even for a few years, significantly raise regional totals and weighted averages.
In which countries did the most miraculous growth occur? How did the miracle happen; why did it happen in the countries it did; what ingredients explain it? These are among the controversial questions which challenge analysts today.
In an effort to solve the question, the World Bank embarked on a research project which has resulted in one of the most all-encompassing recent looks at the issue. The report states that from 1965 to 1990, the 23 economies of East Asia grew faster than all other regions of the world, most of the growth being in the following eight economies: Japan, the four tigers (Hong Kong SAR, China, the Republic of Korea, Singapore and Taiwan Province of China); and the three newly industrializing economies (NIEs) of south-east Asia, Indonesia, Malaysia, and Thailand. The World Bank called these eight "high-performing Asian economies" (HPAEs) but to them must be added PR China which has also registered exceptional performance during the most recent decade but also maintained creditable performance since 1978 when it adopted its socialist market economy principles.
The Bank reports that since 1960, the HPAEs grew over twice as fast as the rest of East Asia, roughly three times as fast as Latin America and South Asia, and 25 times faster than sub-Saharan Africa. The HPAEs share in world exports rose from 8% in 1965 to 13% in 1980 and 18% in 1990, with manufactured exports providing most of this growth. The proportion of the absolutely poor dropped from 58% in 1960 to 17% in 1990 in Indonesia, and from 37% to less than 5% in Malaysia. The HPAEs are the only group of developing economies in which savings exceeds investment, making them exporters of capital.
Table 12 - Average annual percentage growth of real GDP for 1966-1994 (at 1987 prices and exchange rates)
1993 GDP (US$ billions) |
1966-73 |
1974-90 |
1991-93 |
1993 |
1994 | |
World |
18,688 |
5.1 |
3.0 |
1.2 |
1.3 |
2.8 |
High-income |
14,600 |
4.8 |
2.9 |
1.3 |
1.1 |
3.0 |
Japan |
2,965 |
9.9 |
4,0 |
1.8 |
0.1 |
0.8 |
Low and middle income |
4,028 |
6.9 |
3.5 |
0.8 |
1.7 |
2.0 |
Asia |
1,497 |
5.9 |
6.3 |
7.0 |
7.4 |
7.8 |
East Asia and Pacific |
1,067 |
7.9 |
7.1 |
8.7 |
9.4 |
9.3 |
PR China |
430 |
8.5 |
8.2 |
12.3 |
13.7 |
11.7 |
Korea, Rep. |
215 |
11.2 |
8.5 |
6.4 |
5.4 |
8.0 |
Indonesia |
112 |
6.6 |
6.1 |
6.5 |
6.4 |
6.6 |
South Asia |
431 |
3.7 |
4.9 |
3.2 |
2.9 |
4.7 |
India |
343 |
3.7 |
4.8 |
2.9 |
2.7 |
4.7 |
Source: Extracted from Table 1, World Bank (1995a)
Table 13 - Average annual percentage growth rates of real per capita GDP for 1966-1994 (at 1987 prices and exchange rates)
1993 GDP* |
1966-73 |
1974-90 |
1991-93 |
1993 |
1994 | |
World |
3,500 |
3.1 |
1.2 |
-0.4 |
-0.2 |
1.2 |
High-income |
17,570 |
3.8 |
2.2 |
0.7 |
.05 |
2.4 |
Japan |
23,800 |
8.6 |
3.2 |
1.5 |
-0.2 |
0.6 |
Low + middle income |
850 |
4.5 |
1.5 |
-0.9 |
-0.5 |
0.3 |
Asia |
510 |
3.4 |
4.3 |
5.2 |
5.5 |
6.0 |
East Asia and Pacific |
615 |
5.2 |
5.4 |
7.2 |
7.8 |
7.6 |
PR China |
360 |
5.8 |
6.6 |
11.0 |
12.5 |
10.5 |
Korea, Rep. |
4,860 |
8.8 |
7.0 |
5.4 |
4.6 |
7.0 |
Indonesia |
580 |
4.1 |
3.9 |
4.7 |
4.2 |
5.1 |
South Asia |
360 |
1.3 |
2.6 |
1.1 |
0.7 |
2.7 |
India |
380 |
1.4 |
2.6 |
0.9 |
0.8 |
2.9 |
Source: Extracted from Table 2, World Bank (1995a). *(US$ per capita).
The commencement of accelerated growth and development seems to be occurring sequentially in Asia: a kind of "help thy neighbour" pattern of economic growth has been observed partly based on cultural and ethnic affinities and ties but clearly also benefiting form enlightened self-interest. The Asian Development Bank (1996) has observed that since the second world war, a wave-like sequence of growth acceleration, maturity, and deceleration has occurred starting with Japan, followed by the newly industrialising economies (NIEs), and now by the rapidly-growing Southeast Asian economies - a sequence described as the "flying geese" pattern.
Already in line for rapid development in this sequential leaping pattern are the Philippines and several South Asian economies which are capturing the benefits of liberalisation, key among them being India, Pakistan, Bangladesh, Myanmar and Sri Lanka. Other economies stand to gain as these also become more prosperous and create markets for or become sources of investment for their neighbours; this continues the chain of causation.
Leading the "miracle" and earliest in the process was Japan, which is alone in the first tier: Japan's post-war record of growth is yet to be surpassed - it now has a mature economy with growth centred around the G-7 rates of 2-3% annually but after 1997 much less. Yet Japan has already grown so much that even though by now it's economy grows so much slower than for its neighbours, it still dwarfs the economies of its neighbours. The next tier in the pre 1997 miracle category comprised of the newly industrialising economies normally called the "Asian Tigers" - Republic of Korea, Hong Kong SAR, China, Taiwan Province of China and Singapore.
The third tier is a set of very rapidly industrialising countries - PR China, Malaysia, Thailand, Indonesia and very recently, Vietnam. A key element to note is that these countries have not only achieved very high rates of growth (other countries also have) but that until 1997 they sustained it for so long. All had growth driven by exports and high investment levels. While OECD markets and investment was important but these economies were increasingly buffered by their own markets and by investment from their own savings both within their own borders and in neighbouring Asian countries. Apart from PR China, all countries in this group also happen to be members of ASEAN, which has been Asia's fastest-growing sub-region with a 1994 weighted GDP growth rate of 7.47% according to ASEAN (1995).
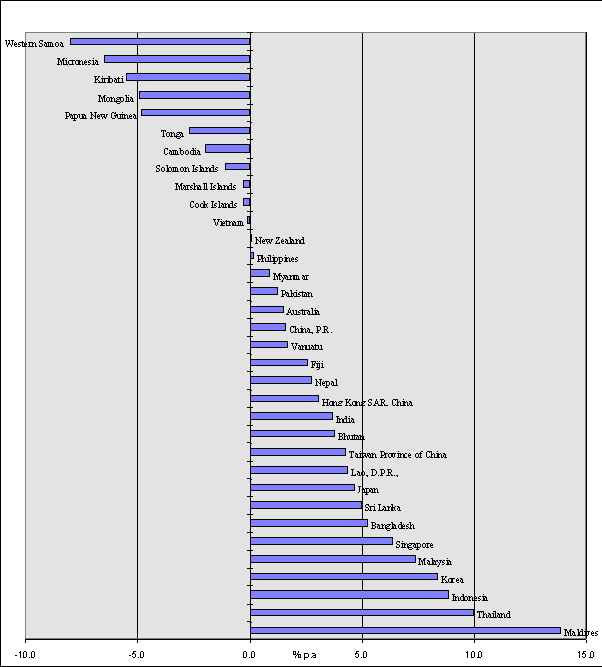
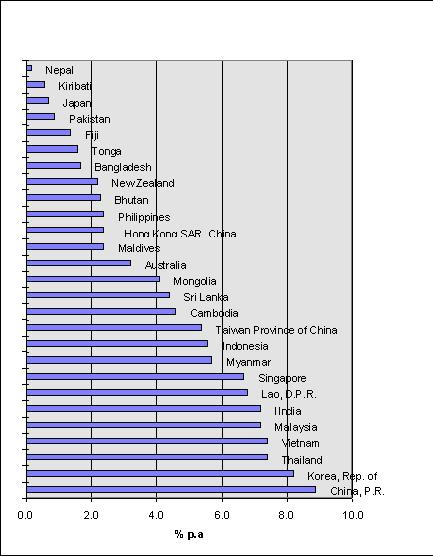
A fourth tier of economies comprises those benefiting from liberalisation and other reforms. Their growth rates accelerated in recent years even though they never achieved the rates of the "miracle" countries. This category includes economies of some populous countries: India, Pakistan, Philippines, Myanmar and Bangladesh but also of Sri Lanka and Laos. Taken together, the region's countries and territories show a graduation in levels of per capita income (figure 21) and in growth rate of their economies (Figures 22 & 23).
Figure 21: Range of average GNP per capita in 1994
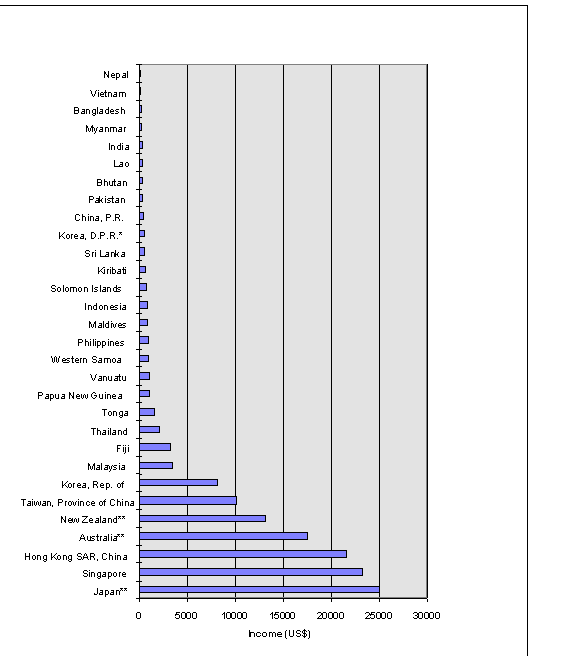
Source: See Annex Table A2.
Figure 22: GDP growth rates by country and territory in 1990
Source: See Annex Table A3.
Figure 23: GDP growth rates by country and territory in 1995
Source: See Annex Table A3.
