6. The data used for this study were obtained from a number of sources including government reports dating back to 1902, and several independent research studies. Much of the data must be understood as approximations or estimates as detailed census was not a practice over most of the historical period in African areas. The numbers are thus indicative of movements and trends, as perceived by reasonably well-informed individuals, but caution should be exercised before drawing exact relationships from the data.
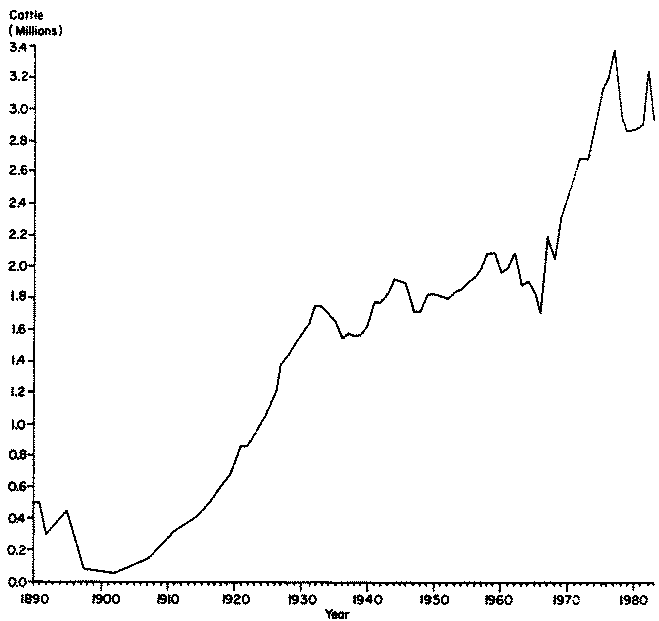
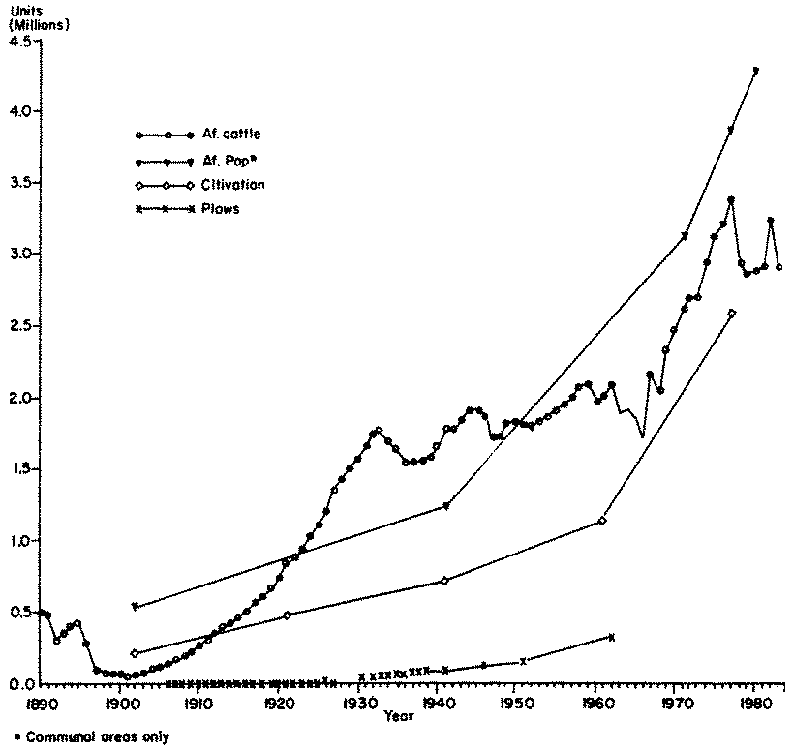
7. African cattle numbers in Zimbabwe appear to have passed through six distinct periods since 1890, with each of these periods defined in terms of the apparent forces acting on livestock numbers (see Figure 1). These phases are: 1) 1890-1896, when relatively stable or growing African livestock herds came up against European expansion; 2) 1896-1902, when rinderpest and East Coast Fever drastically reduced the African herd; 3) 1902-1932, when the herd recovered and grew rapidly to a new peak more than three times the pre-rinderpest levels: 4) 1932-1966, when cattle numbers passed through a variable period of growth and decline, 5) 1966-1977, when the herd again sustained a rapid increase; and 6) 1977-1980, when the herd declined sharply, apparently because of political and economic instability in Zimbabwe, rather than overgrazing.
8. We attempt to look at these trends in light of key variables influencing livestock production in African areas of Zimbabwe. However, several important gaps in the data will be evident. Very little data is available for the historical period regarding either primary (range) production or secondary (livestock) production. Although fairly good data are available on the number of cattle owned by Africans, the data identifying the areas grazed by Africans herds are sparse. Similarly, only indirect information is available concerning changes in the productivity of such land, e.g., the amount of forage produced. Sandford (1982) cites Kelly (1973) as one of the few available studies on range productivity, but concludes, "...Whereas Kelly's study appears to show, prima facie, that the productivity of communal grazing may be higher than that of [European settler] ranching, the critical piece of missing information is the trend in ecological degradation." Most importantly, little data is available regarding the value of livestock services and products through time, especially draft services, milk, and dung.
1890-1896
9. Little is known about the growth of cattle herds in the Zimbabwe region prior to the arrival of Europeans, but African cattle numbers in Zimbabwe have been estimated at about 500,000 in the 1890s (West, 1968). At the time Europeans arrived, Africans practiced a system of moving cultivation, which was viable as long as land was plentiful. According to Palmer (1977a), both of the dominant tribes in Zimbabwe, the Shona and the Ndebele, were primarily agriculturalists, not pastoralists. In fact, the Africans conducted substantial trade in agricultural surpluses with Europeans during the first decades of European settlement. Livestock were not then used by Africans for draft services but were valued for milk, dung and other cultural purposes. After clashes with Africans between 1893-96, Europeans expropriated land, and seized 100,000 to 200,000 head of African cattle, most of which were subsequently sold in South African markets to raise cash (Phimister, 1977).
Figure 1. African-owned Cattle in Zimbabwe 1890-1983
10. According to Yudelman (1964), land was abundant relative to population. Such views were prevalent at least amongst the Europeans at the time and were used to justify claims on vast areas for settlement. The land in Zimbabwe was of varying quality ranging from the fertile high veld (25%), to the middle veld (40%), to the dry low veld (35%) (Palmer. 1977a). Africans historically had occupied the best land, using the remainder only occasionally. The Europeans acquired most of the higher quality land for themselves and future settlers, displacing the Africans to less attractive areas (Palmer, 1977a).
11. In 1895, a land commission reserved specific areas of about 4 million acres as native tracts (Rifkind, 1968). This land, while reportedly of poor quality, was expected to give some protection to the tribes against European encroachment (Yudelman, 1964). Nonetheless, disputes over the European presence led to native uprisings in 1896-97, by both the Ndebele and Shona. European efforts to defuse the situation and end further bloodshed resulted in the establishment of 20 million acres of African reserves, but located outside the European priority areas.
1896-1902
12. The spread of rinderpest through eastern and southern Africa dramatically reduced cattle herds. The rinderpest epidemic began in Zimbabwe in 1896, and resulted in heavy losses within a short period. Rinderpest had entered Zimbabwe from the north where the Zambesi River had delayed the disease's movement south. Mass cattle slaughterings and containment were employed to limit the spread of the disease. Nonetheless in a short time the epidemic had reached the South African territories as well, where another 2.5 million cattle died (Mack, 1970). The cattle slaughter undertaken by the Europeans was incomprehensible to the Africans, who were already suffering from drought and European land encroachment, and further contributed to the uprisings during 1896-97. Transport and supply in the region were severely disrupted (prices surged higher) as oxen carts were the principal means of transport of the time
13. With rinderpest under control after 1898, cattle were imported from other areas of Africa to help initiate the recovery. But, the herds were further ravaged in the early 1900s by the onset of East Coast Fever. In total European theft, disease, and efforts at disease control reduced the African cattle herds in Zimbabwe to 25,000 to 50,000 head of cattle (90%-95% losses). While East Coast Fever, Nagana (tsetse), and Foot and Mouth Disease played a part in native cattle losses throughout the historical period under consideration, disease never again affected the herd on c similar scale in subsequent periods.
14. By 1902, with native reserves extended to over 20 million acres and the herd drastically reduced, land availability was not a constraint to increased livestock production, even though the land quality of African reserves was inferior to that which had been used previously. In addition, many Africans worked as shareholders on European land, maintaining cattle and crop production outside the reserve areas. The ratio of the African human to cattle populations stood at about 10:1 in 1902, up from the roughly 1:1 ratio which existed prior to the wave of cattle diseases and European encroachment. This implied substantial demand for more animals. The plow had been introduced and, as it was rapidly adopted by Africans, further contributed to cattle demand. The stage was thus set for livestock herd growth and recovery.
1902-1932
15. From 1902 to 1932, the African cattle herd expanded rapidly from less than 50,000 to about 1,750,000 animals. This increase implies an extremely high annual growth rate, exceeding 12%. For comparison, Dahl and Hjort (1976) estimate that the maximum biological rate of growth attainable by a cattle herd under African pastoral conditions is approximately 114.. Given the high growth rate in our case, animal slaughter was surely kept low. However, this is consistent with the African practice of using animals primarily for milk, draft services, and dung. Furthermore, the herd growth was accomplished despite European actions to impose rents when possible and to further restrict areas of African cattle grazing. Africans were increasingly isolated from markets and sometimes faced exorbitant charge for compulsory cattle dipping - which generally had to be carried out in European owned dips (Palmer, 1977a). Compulsory dipping, which by 1923 covered 3/4 of African cattle herds, had been introduced to reduce tick-borne diseases. While dipping probably improved herd health and contributed to growth, it also increased the cost of carrying cattle.
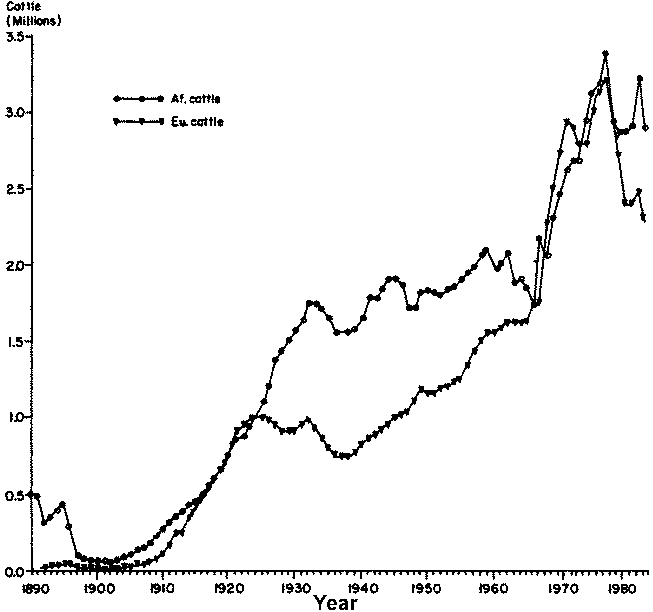
16. Of note, the European cattle herds expanded from 12,000 in 1900 to over a million animals in 1924, surpassing even the high growth exhibited by the African herds. Much of the growth, though, can be attributed to purchases of African cattle, as illustrated by the fact that in 1919 alone, Africans sofa approximately 20,000 head of cattle to the Europeans at prices of £7-8 each.
17. As shown in Figure 2, the African and European herds have essentially moved in the same direction except during the period 1925-1929, and 1959-1966. In the first period African herds expanded and European herds contracted while in the second period the opposite occurred. What were the reasons for the European decline in the first period? A commercial export market had been established to Johannesburg in 1916 (Palmer, 1977a), and by the mid-20s Zimbabwe (Southern Rhodesia) was exporting to South Africa, the Belgian Congo, Mozambique, Northern Rhodesia, and Europe. South Africa was the dominant market receiving 80% of the exports (Palmer, 1977a). Demand for beef ran high through World War 1. However, external demand for Zimbabwean beef - which was of low quality and which faced high transportation costs - then slackened and remained low until the late 1930s when another war provided for increased demand. Meanwhile, Zimbabwe's internal market rapidly became flooded, and prices plummeted. During 1925-38, many Europeans liquidated their holdings and moved into cotton and tobacco (Palmer, 1977a). The decline in the European herd averaged 2.4% per year over the period.
18. The continued increase in African herds after 1924 does not appear directly related to the reduction in European herds, though it is possible that some Europeans made additional grazing areas available to Africans. The combined European and African herds rose rapidly. Moreover, the principal actions taken by the white settler producers was not to sell animals to Africans, who offered little demand, but to seek government assistance in marketing abroad. To help dispose of domestic surpluses, the government entered into an agreement with a South African meat packing concern, thus beginning state intervention in the cattle industry. Under the arrangement, the government at first subsidized Rhodesian exports (72,738 exported in 1927 according to Palmer, 1977a) and teen, a decade later, exercised an option to take over the private Rhodesian concern that had been formed to supply the South Africans. The takeover resulted in the creation of the Cold Storage Commission in 1937-38, 8 state agency which subsequently dominated trade in beef (Phimister, 1978).
Figure 2. African 8 European Cattle Holdings 1890-1983
19. The African human population roughly doubled between 1902-1932 (530,000 to 1,080,000) growing at about 2.5% annually. Because livestock herds grew even more rapidly than population, a 1:1 ratio in African cattle to population was reattained in 1922. Increases in livestock herds continued to outpace growth in the human population through 1932. The area cultivated by Africans expanded at 3.2% annually (from 592,000 to 1,529,000 acres) also increasing more rapidly than the rate of population growth. This increase apparently resulted from the need to farm larger areas of lower quality land in order to produce a given level of output and from the ability to cultivate larger areas with the use of draft animals and the plow. Africans were increasingly forced out of European and onto reserve areas as European settlement and farming expanded, and sharecropping arrangements were made progressively unviable economically (Palmer, 1977a). Due to crowding and the adoption of sedentary agricultural practices, cultivation in the reserves intensified. The use of plows increased almost 50 fold from a reported 1,079 in 1907 to 52.2,3 in 1932 (a rate of increase of about 17% per year).
20. Grain production reportedly rose over the 1902-32 period by only 1.4-2.0 times (Yudelman, 1964; Mhlanga, 1982) slightly slower than the increase in population. Native cattle production should have been affected in two, potentially offsetting, ways by this development: 1) the area and overall quality of the open range would have been reduced (as better quality lands were naturally chosen for cultivation); yet 2) crop stubble would have provided increased fodder for livestock after harvest. Since land was apparently not a constraining factor to cattle herd growth over this period, the effect on livestock numbers of lost rangeland was probably small. 2 Nonetheless, when considering degradation, it is important to keep in mind the ecological impact of keeping expanding livestock herds on increasingly marginal land through time.
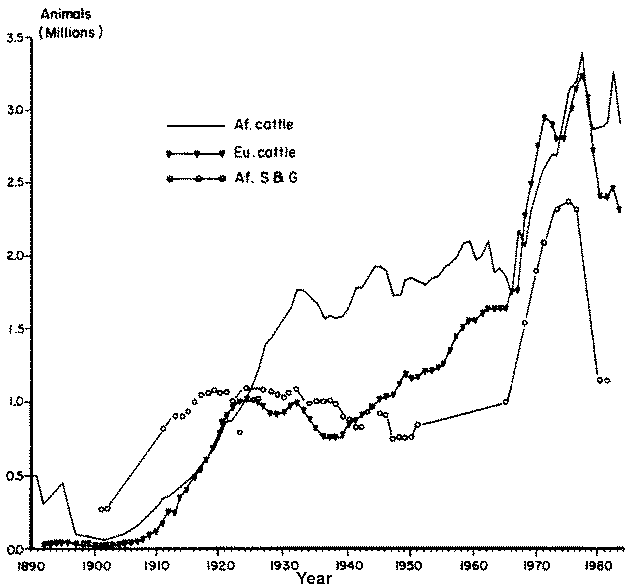
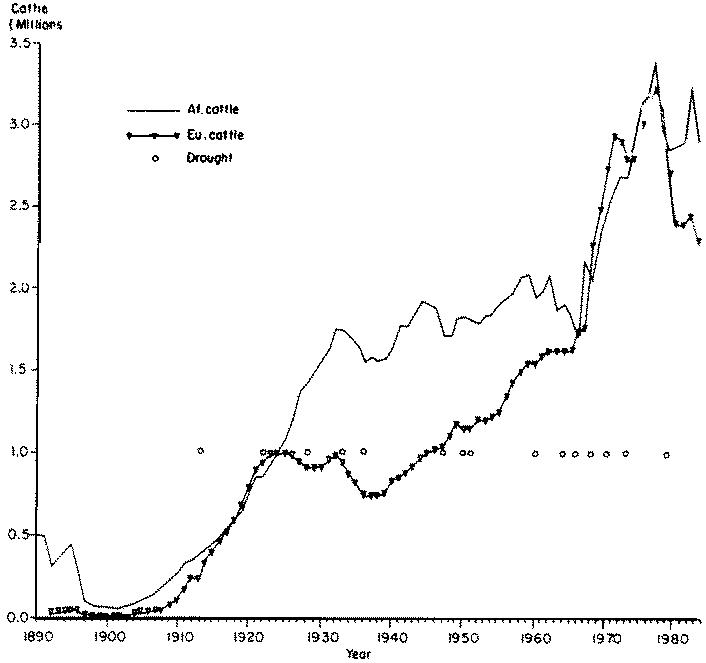
21. Also of note, small stock (goats and sheep) numbers showed the same high growth rate as native cattle during 1902-1919, but then entered a long phase of oscillation and gradual decline, quite similar to the European cattle herd (see Figure 3). Our data are insufficient to indicate the cause of the negative trend in sheep and goats and in particular, whether they are related to a ceiling in land expansion. The reports of drought increased during this period (1922, 1928. 1933 and 1936), which could point toward a livestock production system bumping against resource limits. It seems unlikely, however, that drought should have induced pastoralists to part with small stock and to retain cattle, as the former usually fare better under harsh conditions and, being more prolific, recover faster.
22. In 1930, African settlements were further circumscribed by the passing of the Land Apportionment Act. The Act increased the area reserved for Europeans to 48 million acres and also created 7.5 million acres of Native Purchase Areas. There was a corresponding reduction in unreserved areas. The provision for Native Purchase Areas permitted some African expansion, but was actually designed to preclude future African access to the better situated areas which were designated for Europeans. The total land designated to the estimated 1,080,000 Africans was now just under 30 million acres, while the total area designated to the 50,100 Europeans was 48 million acres. The legislation also facilitated the eviction of Africans from European land, further isolating the Africans from access to markets for their crop production. This was designed to reduce competition between African and European farmers. It made African producers necessarily more self-sufficient, and probably increased their relative dependence on livestock as opposed to crop production, though Palmer (1977a) suggests that Africans suffered cattle declines due to the lost access to the rangelands (Palmer, 1977a).
1932-1965
23. Beginning in 1932-33, the African herd entered a three decade period of significant oscillation about an essentially static trend. Herd numbers totalled about 1,750,000 in 1932 and about 1,850,000 in 1965, an overall increase of less than 6%. Between 1932 and 1965, three cycles occurred, each apparently correlated with drought (see Figure 4). Had the story ended here, it might have appeared that overgrazing was indeed the primary problem. However, in 1966 a sustained increase in herd numbers began again. It is therefore important to understand what forces restrained African herd growth during 1932-1965, and what permitted their subsequent resurgence.
Figure 3. African and European Cattle, & African Smallstock 1890-1983
24. The Great Depression reduced international demand and thereby domestic prices. An outbreak in Zimbabwe of Foot and Mouth Disease in 193132 also interrupted Zimbabwean exports. Droughts in 1933 and again in 1936 contributed to a drop in African cattle of 200.000 head, or roughly 11% of the herd. The area cultivated by Africans also dropped significantly in the mid-30s before a recovery in 1937. All of this seems to have contributed to a sense of doom. Palmer (1977a) quotes a 1939 government commission as describing African grazing areas as being in a state where "rehabilitation appears almost impossible..." and "heading for ruin". The government proposed voluntary destocking, but these efforts failed as Africans were unwilling to sell at the low prices then prevailing. The European ranchers, many of whom moved out of the industry during the Depression, were also reportedly unhappy about the government promotion of African destocking because of the added downward pressure on prices it would create.
25. Both European and African herds began a recovery in the late 1930s, and their combined total rose fairly smoothly until the late 1950s, albeit at a lower rate than prior to 1930. The African population continued to grow at about 2.5% annually (from 1.235,000 in 1941 to 2,05:3.000 in 1961). Total cultivated acreage by Africans increased from 1,181,138 acres (about 478,000 ha) in 1921 to 2,804,585 acres (about 1,135,000 ha) in 1961 (see Figure 5) or at 2.1% annually. However, given the reduced growth rate of African herds, and the continued growth in the African population, the ratio of human population to cattle exceeded 1:1 by the 1950s for the first time since 1921.
26. Under the weight of increased African population, intensified cultivation, and larger livestock herds, government reports began to express increased concern with deteriorating land resources. However, much of the concern over land resources could have bee- related to or mixed with motives to reduce or limit African claims on land. By the 1940s, with the recovery from the Depression and the start of World War 11, a stronger market and higher prices for livestock emerged, increasing European demand for livestock holdings and land on which to keep them. This increased still further even after the end of the war as European immigration increased sharply from 4,000 per year in the late 1930s to 14,000 per year in the late 1940s and early 1950s, creating new settler demand for land and renewed government desire to reduce the number of Africans on European-designated lands.
Figure 4. African and European Cattle, Drought 1890-1983
27. Whatever the motive, a series of legislative and government actions were then implemented to reduce African herds. The Natural Resources Act of 1941 provided for compulsory destocking of African areas. The Native Cattle Marketing Act of 1947 was also established allegedly to help alleviate the pressures of livestock on the land (but also perhaps to provide European settlers with additional cattle at low prices, by which to stock their lands). Through the Act, the government provided for cattle disposals to be channelled through organized sales at 100 auction sites established in African areas. Africans were "required" to sell their cattle directly to the Cold Storage Commission (CSC), with exceptions granted only by special permits. The prices for African cattle were from 10-19% below comparable prices in the European open markets, encouraging considerable illegal trade (Yudelman, 1964). The market system was changed in 1956 to remedy previous shortcomings which had benefited the European rancher to the detriment of the African. Official prices were raised and Africans could again sell their cattle at open auctions at competitive prices.
28. The Native Development Fund Act of 1948 followed the Native Cattle Marketing Act, providing for a 10% levy and additional marketing charges on African cattle sold at the official auctions. The reported purpose of the Fund was to finance rural development and conservation works in African areas. This may in fact have ultimately benefited African producers, but the levy was also a tax on sales, lowering the price received by Africans and reducing incentives to produce.
29. As a result of these events and another drought, African cattle holdings in 1948 fell 10% below 1945 levels. It is perhaps surprising that they fell no further as the government's intent was clearly to bring about a larger decline in herds. In fact cattle numbers began to climb again in 194950. However, further efforts at compulsory destocking, plus drought in the early 1950s, succeeded to bring about a small herd reduction in 1951 and 1952.
Figure 5. African Population, Cattle & Cultivation (ha) 1890-1983
30. In 1951, the Native Land Husbandry Act (NLHA) was passed. It sought to change radically native land tenure by individuating land holdings and assigning communal grazing rights that could be exchanged in a market. However, the Act quickly encountered severe problems of implementation. For one, land availability per African family turned out to be less than projected. The new tenure arrangements also conflicted sharply with traditional African land customs, and African workers in urban areas feared loss of their rural land claims. As a result, African political opposition became intense, and native unrest mounted. With the government subjected to increasing pressure, the NLHA was abandoned in 1962.
31. The NLHA never had great effect. African cattle numbers rose through 1958-59, when drought, and perhaps controls, reduced the herd again. A slight recovery thereafter was followed by a more severe drought and a further herd decline in 1965-66.
32. The instability in African livestock production during this three decade period could be the result of a system under increasing population, cultivation, and livestock pressures. Marginal areas were being brought into use, and this land was presumably more subject to deterioration and less apt to quick recovery in the event of drought.
33. However, the stagnation in the African herd seems more likely to have reflected the impact of government policies and African land insecurity. The African livestock controls that were to reduce ecological pressures also provided additional cattle to the European livestock sector. It is somewhat striking that during almost the entire period after 1937, the European herd continued to increase while the African herd fluctuated in response to drought and controls. Indeed, by 1965, European and African herds were nearly equal for the first time since 1924.
34. During the period of NLHA unrest, the amount of land designated to African areas was enlarged from about 30 million to 42 million acres. However, of the total, 8.6 million acres were virtually useless for grazing because of tsetse fly infestation (Advisory Committee on African Agricultural Production, n.d.). Thus, from the mid-1950s to the early 1960s, the ratio of effective African land to cattle rose only slightly.
35. The government also began to increase investments in African areas. From 1941 to 1949, £2.13 million was spent for rural development: 50% on conservation works and water development, 8% on roads, 6.4% on agricultural education, and 21% on wages for European and African agricultural staff. From 1950 to 1958, government expenditure on rural development rose over 7-fold, to £15.7 million: 60% on soil conservation, water development, roads, and buildings, 12% on dipping and marketing services, 2.5% on research demonstrations and teaching, and 20% on European and African salaries (Yudelman and Makings, 1960). The increased investments were probably responsible for expanded range use and livestock productivity. Yet, while increased investments are noted, some perspective is provided by the following: from 1945-46 to 1953-54, £2 million was spent specifically on African agriculture; over the same period, £12 million was voted to the European sector (Palmer, 1977b). Further, Europeans had almost all the available credit through the Land Bank (Yudelman, 1965).
1966-1977
36. It is not until 1966, about a decade after the increases in expenditure and in land allocation, that African and European cattle numbers began a sustained expansion. Between 1966 to 1977, the African herd grew at approximately 6% per year, from 1,714,000 to 3,388,000 animals 3. In absolute numbers, which is perhaps the issue of greater relevance where environmental pressures are concerned, the herd grew more rapidly than during any other time in the historical periods considered. Sandford (1982) noted the possibility that some of the increase may have been "reappearances" due only to underreporting during the previous period of regulatory controls. But other factors were apparently operative as well. Domestic consumption of beef grew at an annual rate of 11%, rising from 48,050 tons in 1965 to 111,300 tons in 1983 (Rodriguez, 1985). This is partially reflective of growing national income and population, but also a result of government subsidization of domestic consumption. Exports represented 44-68% of total commercial beef sales for the 1965-77 period with South Africa still the main export market. Prices in South Africa exhibited a steady upward trend from 1966 to 1977 (Doran et al, 1978). Rodriguez (1985) reported that real domestic beef prices in Zimbabwe trended slightly downward over the period 1970 to 1978.
37. The 1969 Land Tenure Act, which replaced the Land Apportionment Act, essentially divided the country between the African and European populations, bringing the total African area to just under 45 million acres. Yet, the land to cattle ratio declined in the 1970s under the expansion of cattle numbers. Population and cultivated area also continued to increase at high rates, with the amount of land cultivated per person continuing to rise. However, while total agricultural output rose, yields did not (LeRoux et al, 1978), presumably due to increasing cultivation of marginal land.
38. African small stock herds also grew rapidly during this period, as did European cattle numbers. Thus, the total number of livestock units grazed in Zimbabwe expanded dramatically (see figure 3). This is not the behavior expected of a system pressing against resource constraints. Whitlow (1979) has noted that the ratio of small stock to cattle was up during the 1970s, implying a deteriorating range. However, the increase in this ratio is small, and it declines again when the herds all decrease after 1977 contrary to expectation if the decline were motivated by a decrease in range conditions.
39. The three droughts reported over the 1966-77 period each temporarily interrupted herd growth, but had no sustained impact on the upward trend in livestock numbers (see figure 4). Yet, according to professional and official estimates, stocking rates in the communal areas grew rapidly from 1961 to 1975-76 to rates far in excess of carrying capacities (Sandford, 1982). Although Sandford concluded that the carrying capacity estimates involve a large amount of guesswork, he has elsewhere argued cogently that higher stocking rates should, ceteris paribus, result in both greater frequency of reported drought and in the effects of such drought on production (Sandford, 1978). That is not apparent here.
40. The trend of output in terms of beef (as opposed to draft, milk, and dung) is below that of the 1950 to 1970 period, from an average of 210,000 head annually in the 1950s to about 170,000 in the 1970s (Sandford, 1982). Does this indicate overgrazing? It is difficult to say given that beef accounts for such a small proportion of total output. This decline could be due to greater use of cattle for activities such as draft. Studies by Danckwerts (n.d., but mid-1970s) and DEVAG (n.d., but early 1980s) assert that 82.595% of the value of the traditional herd comes from draft services, milk, and manure. Thus, rather small changes in these outputs could offset changes in beef output. 4 Nonetheless, the decrease in slaughter is partly explained by greater herd retention to facilitate the high growth of the 1966-77 period. Although the data provide only approximate indications, the herd rate of production clearly increases from the 1950s to the 1970s. Consider the following argument. The total production of beef is equal to the number of animals slaughtered plus or minus the change in the number of animals in the herd. 5 The average annual addition to the herd during the period 1950-59 was 26,000 animals and average slaughter was 200,000 animals; summed they amount to 226,000. Dividing this output by the size of the here in 1950, yields the production rate for the period - 12.3%. The same figures for the period 1968-77 are 135,000, 170,000, and a total of 305,000, which divided by the herd in 1968 yields a production rate of 15.0%. As the production rate has increased, there is no evidence of overgrazing.
1978-1980
41. The period of 1978-80 is one of steep decline in all livestock populations. This seems to be a direct result of civil unrest in the rural areas and the resulting breakdown of government and private services (dipping, extension, supplies, etc.), livestock theft, and economic uncertainty. Insufficient information is available to us to determine whether climatic or resource constraints (drought in 1979) played a significant part in this development, but the dramatic decline in European herds - where range management was thought to be superior -suggests that other factors must have been dominant.