![]()
![]()
A record of all fishing stations with total catch and the main species caught is shown in Appendix II.
The main purpose of the fishing experiments is to obtain information on the species - and size compositions of the catch recorded by the acoustic instruments. The catch rates from such fishing experiments are not indicative of the rates which may be attained in commercial fishing since the fishing operations are not concentrated in the areas of highest fish density. Even so catch rates from bottom trawling may in a general way corroborate acoustic findings on fish density. In pelagic trawling, low catchability of fast swimming schooling species often represent a problem even for sampling for simple identification
The duration of the trawl hauls is usually restricted to 30 min in order to save time, but catch rates are standardized to 1 hour hauls.
A total of 116 hauls were made. Their distribution on areas and the range and mean value of the five highest catches in the bottom trawls were: (in tonnes per hour)
|
Area |
Number hauls |
Catch 5 highest dem. |
||
|
|
Pelagic |
Demer. |
Range |
Mean |
|
Baia dos Tigres |
2 |
12 |
2,4-7,0 |
4,2 |
|
Porto Alex. - Benguela |
2 |
4 |
|
|
|
Benguela - Luanda |
23 |
28 |
1,0-1,8 |
1,3 |
|
Luanda - Cabinda |
33 |
12 |
1.2-2.7 |
2.6 |
Figure 1. Cruise tracks, hydrographical section and fishing stations Porto Alexandre to Cunene R.
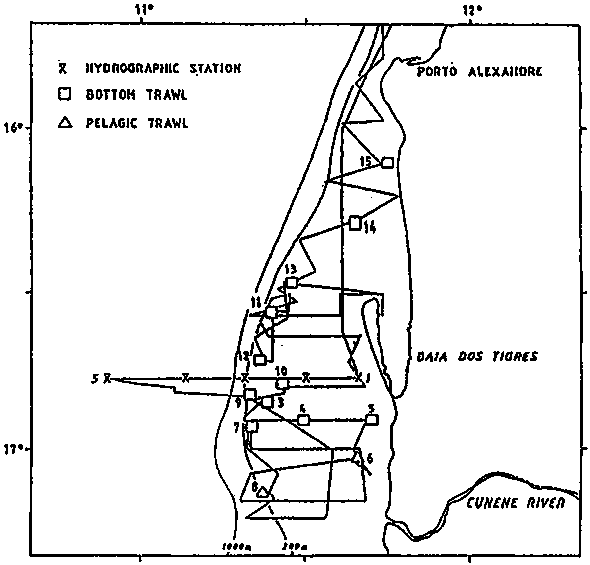
Figure 2. Cruise tracks and fishing stations Porto Alexandre to Benguela.
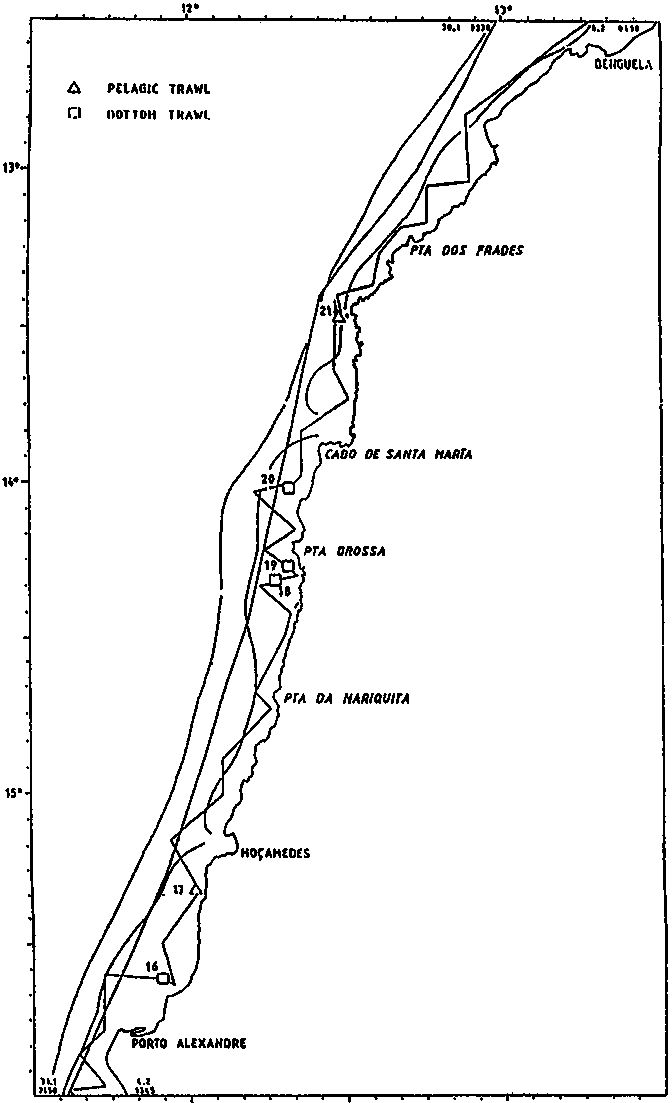
Figure 3. Cruise tracks, hydro-graphical sectins and fishing stations Benguela-Luanda.
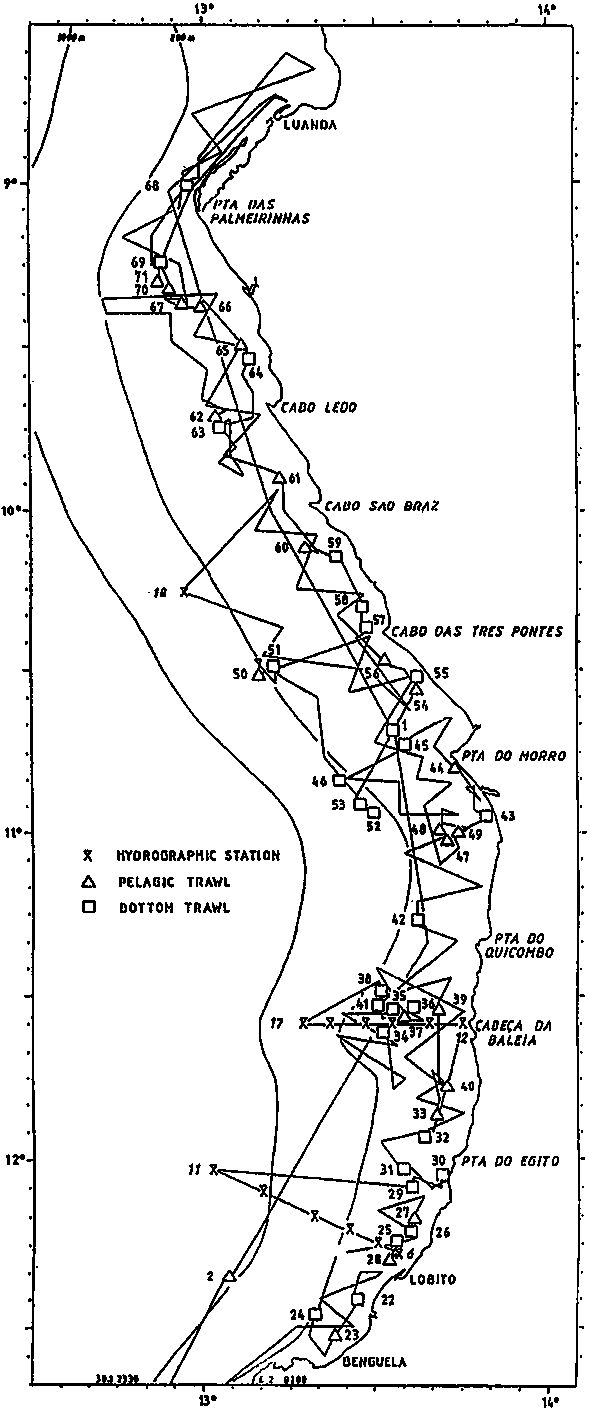
Figure 4. Cruise track and stations worked from Luanda to Cabinda
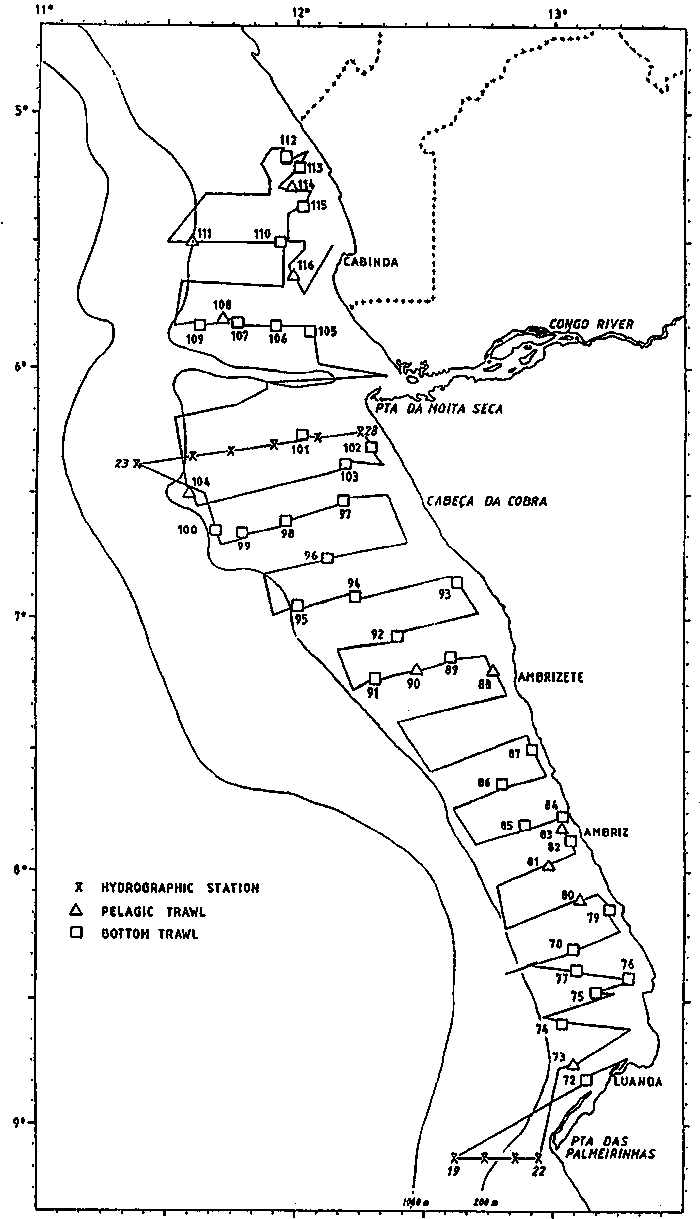
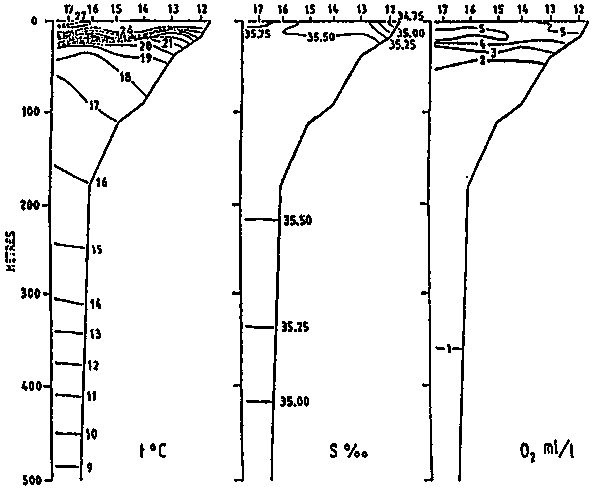
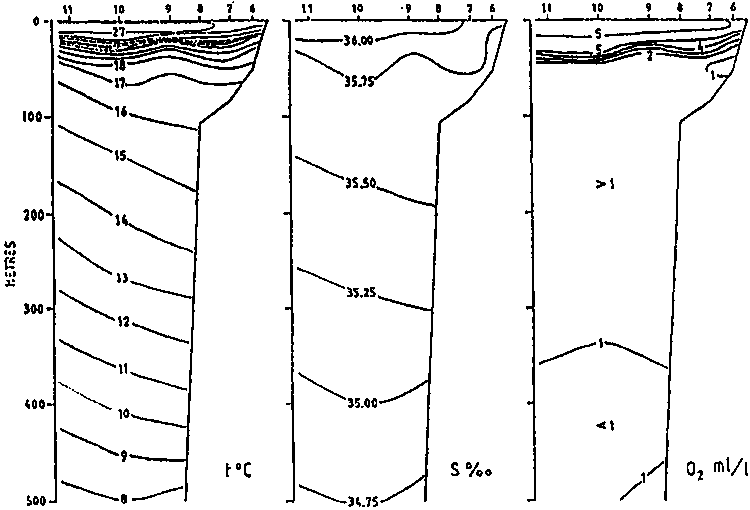
Figure 5. Distribution of temperature, salinity and oxygen in the hydrographical sections off Baia Dos Tigres, Lobito and Cabeca da Baleia.
CABECA DA BALEIA - 9 FEB 1985
LOBITO - 7 FEB 1985
BAIA DOS TIGRES - 1 FEB 1985
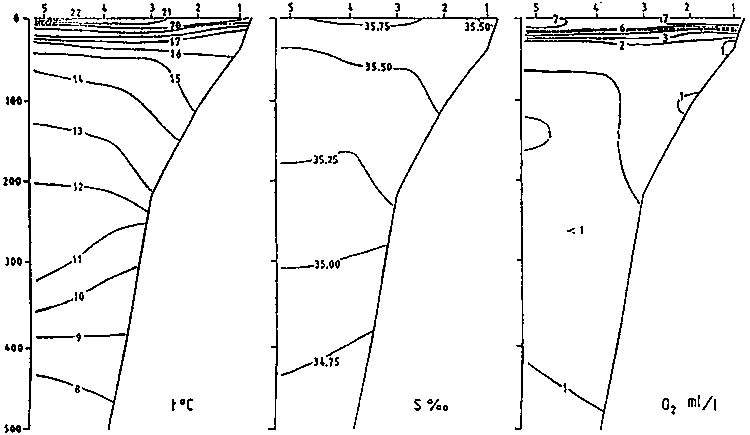
Figure 6. Distribution of temperature, salinity and oxygen in the hydrographical sections off Pta. das Palmerinhas and Pta. da Moita Seca.
PONTA DA MOITA SECA - 22-23 FEB 1985
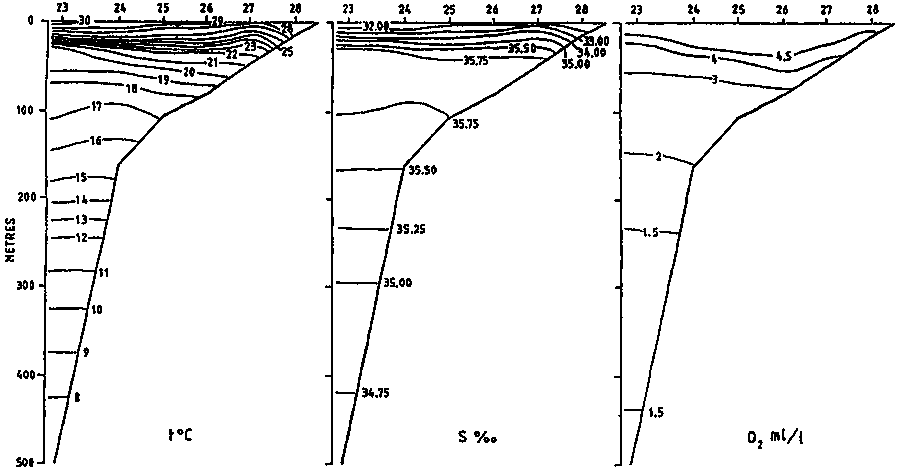
PONTA DAS PALMEIRINHAS - 17-18 FEB 1985
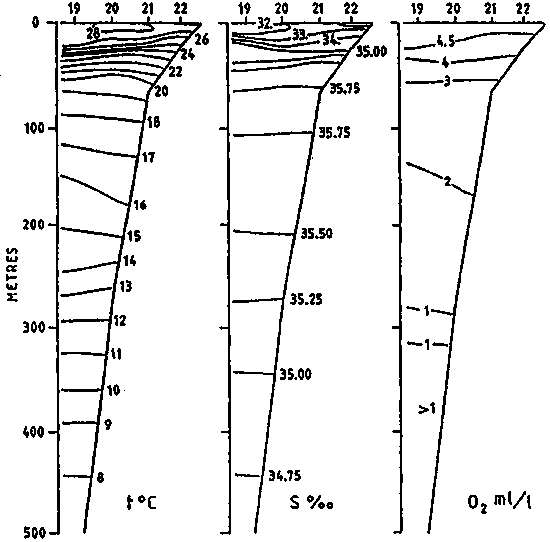
Figure 7. Bottom conditions in the Baia dos Tigres area. Yellow: smooth and even; green: generally smooth but more uneven; blue: very steep.
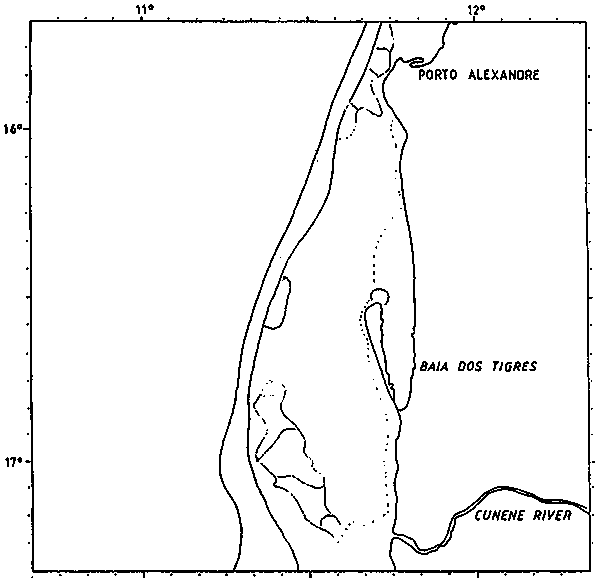
Figure 8. Bottom conditions Porto Alexandre to Benguela. Yellow- smooth and even; Green- generally smooth but more uneven; Red - rough; Blue - very steep.
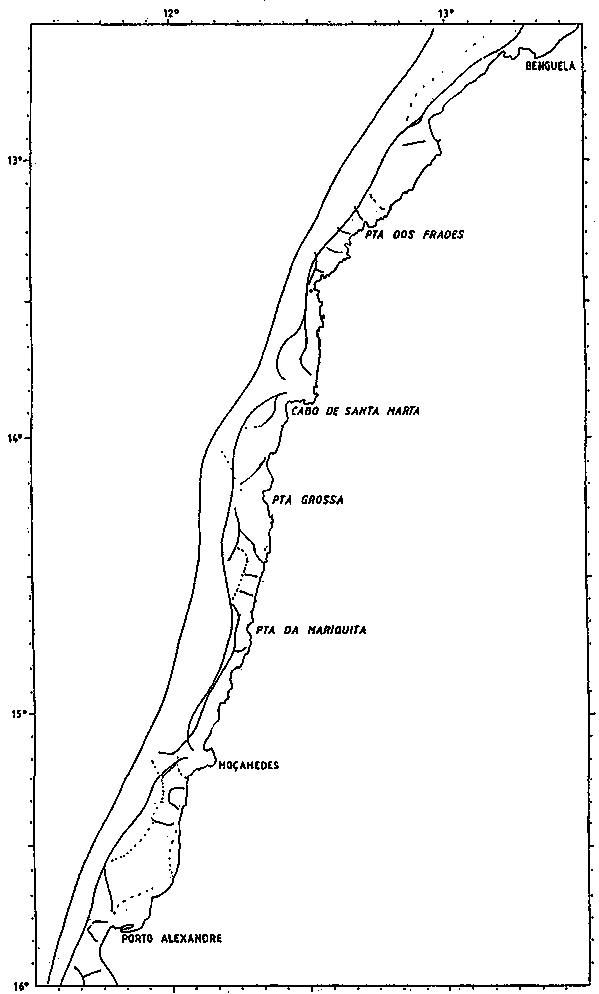
Figure 9. Bottom conditions Benguela to Luanda. Yellow, smooth and even; Green- generally smooth but more uneven; Red- rough; Blue- very steep.
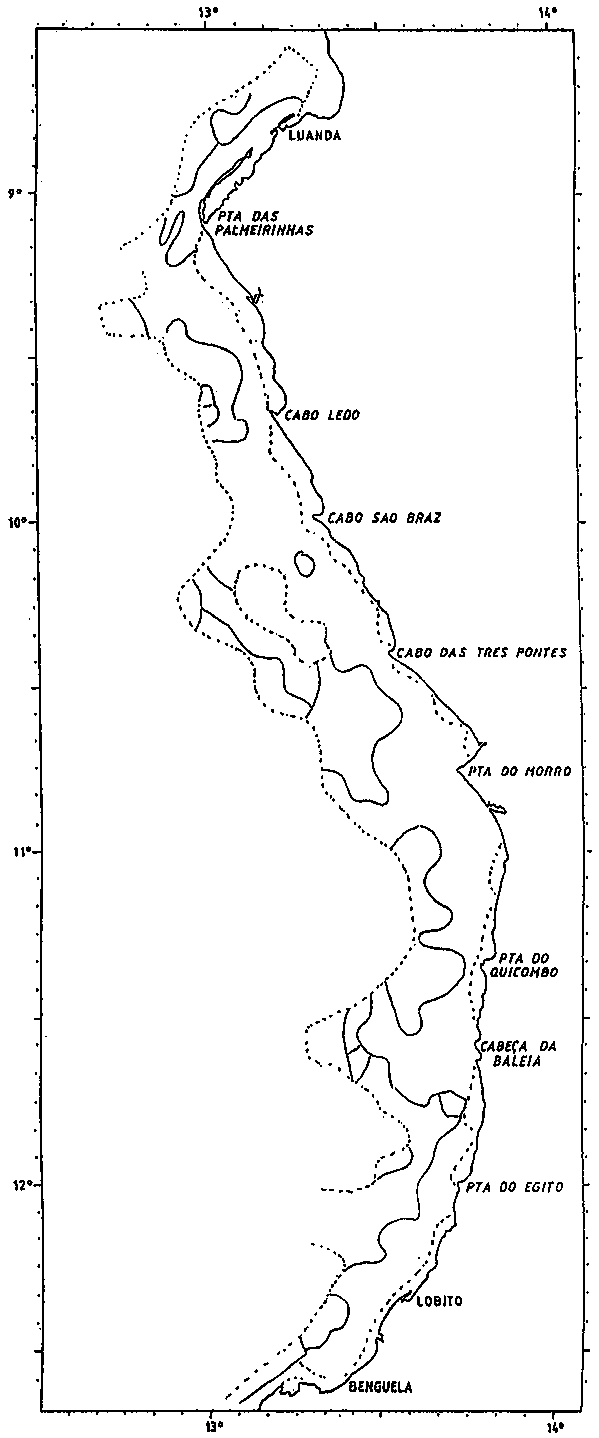
Figure 10. Bottom conditions Luanda to Cabinda. Yellow- smooth and even; Green- generally smooth but more uneven; Red- rough; Blue- very steep.
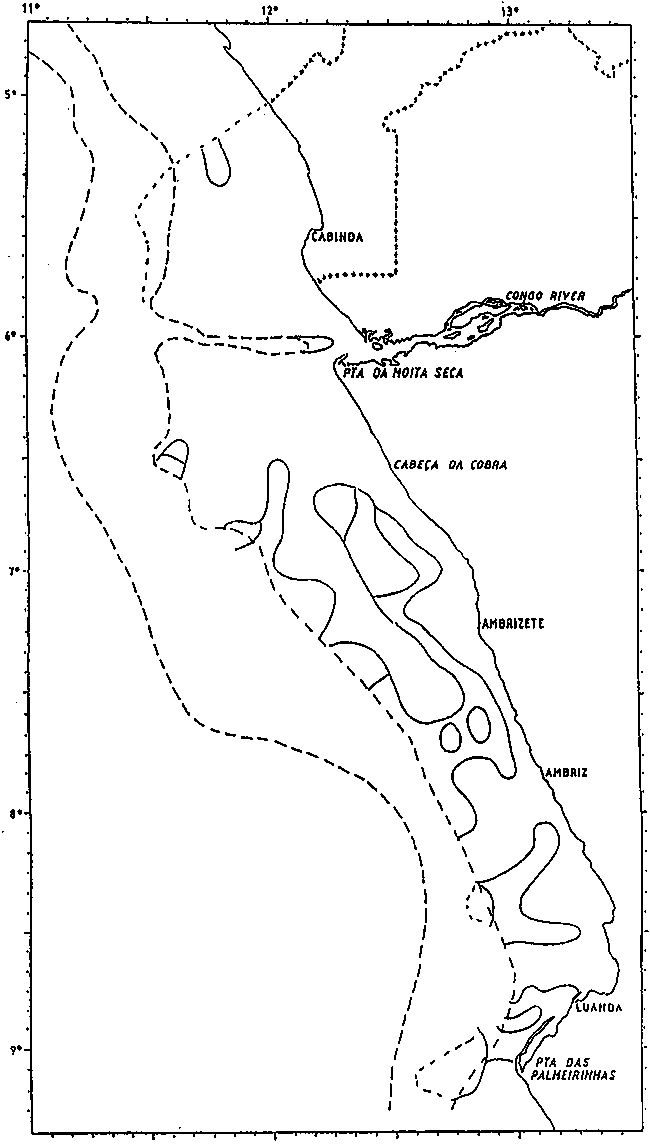
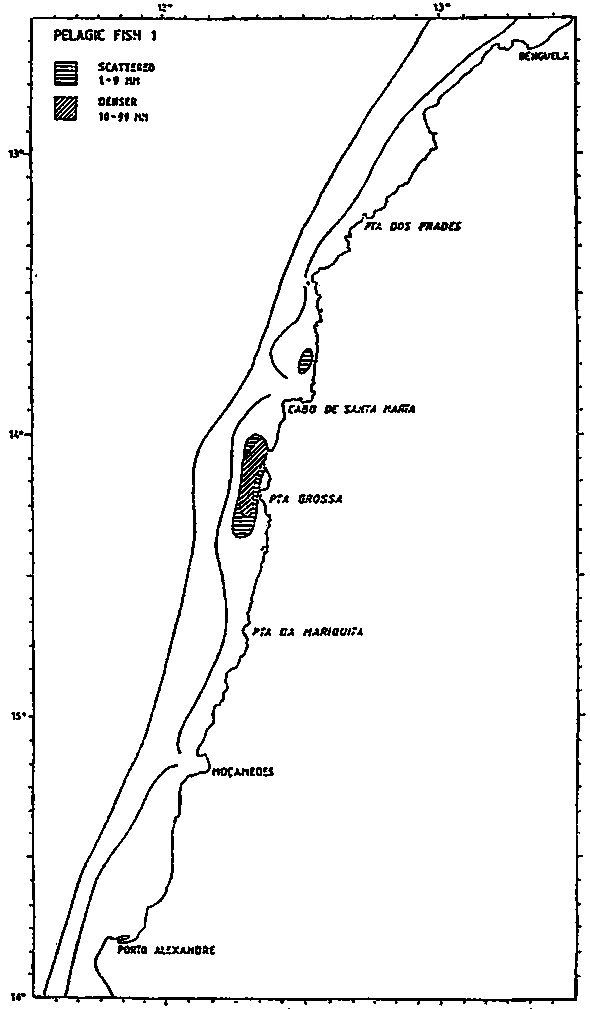
Figure 11. Distribution of “Pelagic I” in the Baia dos Tigres area. Samples indicate a mixture of Sardinella aurita and Sardinops ocellata.
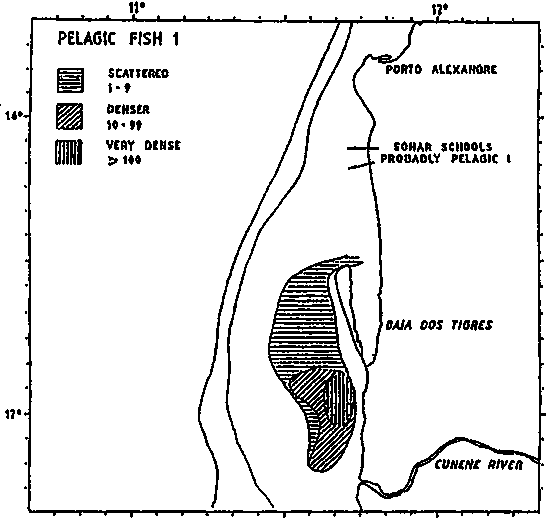
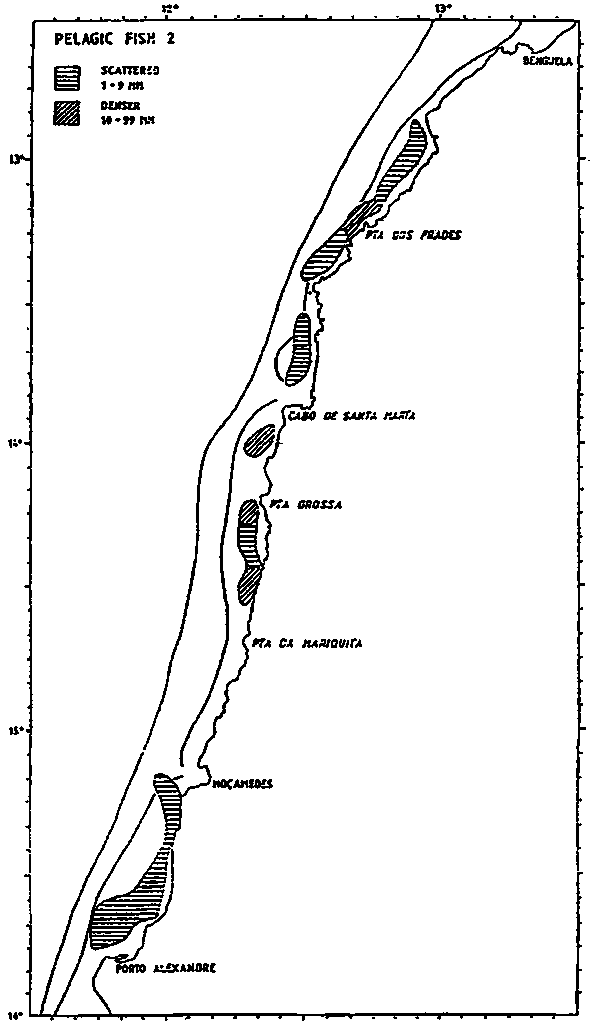
Figure 12. Distribution of “Pelagic II” in the Baia dos Tigres area. Almost exclusively Trachurus capensis.
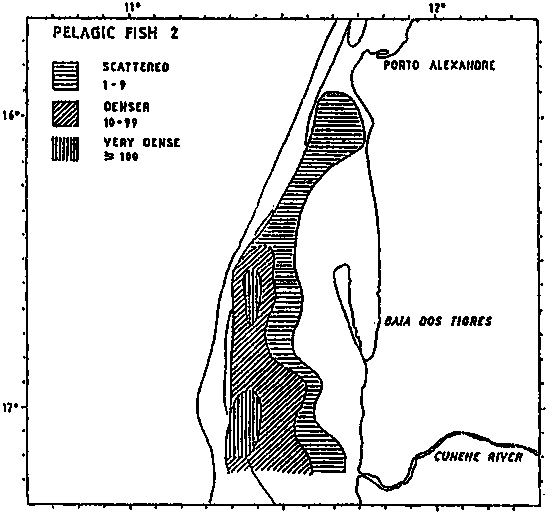
Figure 13. Distribution of demersal fish in the Baia dos Tigres area. Dominant species Merluccius sp. and Dentex macropthalmus.
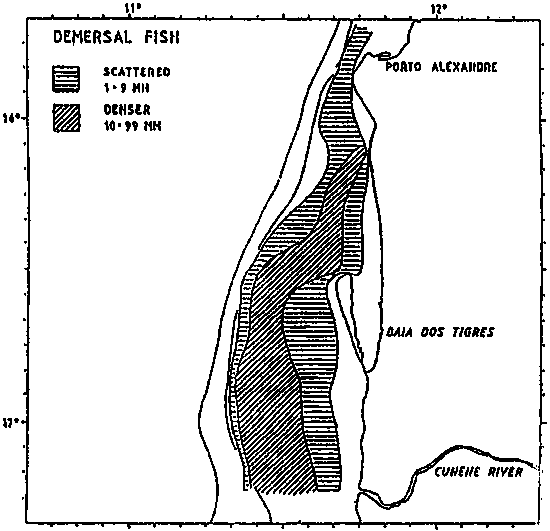
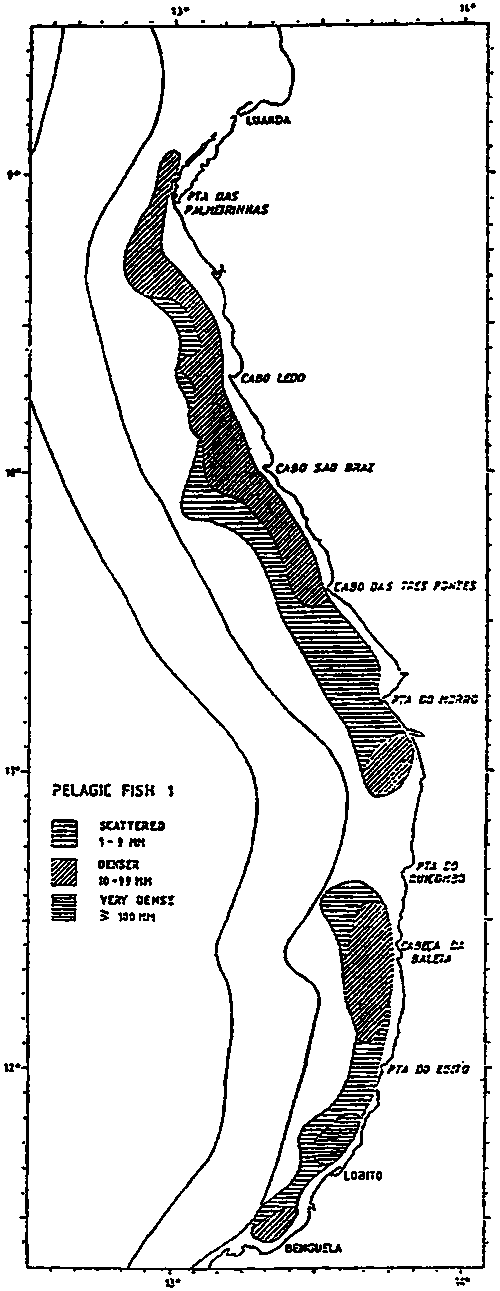
Figure 14. Distribution of the three categories of fish between Porto Alexandre and Benguela
PELAGIC FISH 1
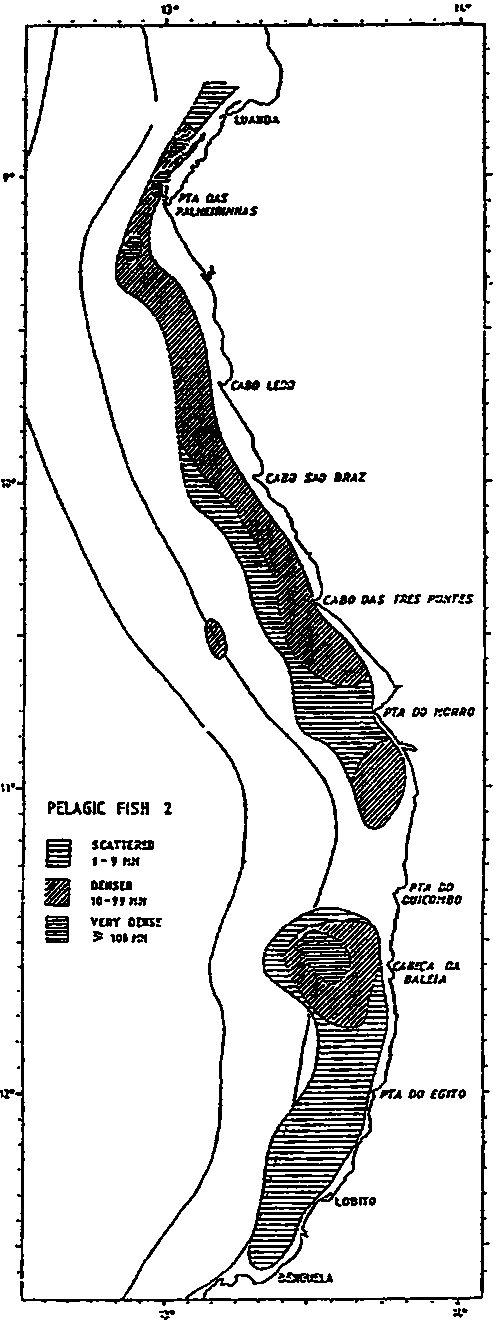
PELAGIC FISH 2
DEMERSAL FISH
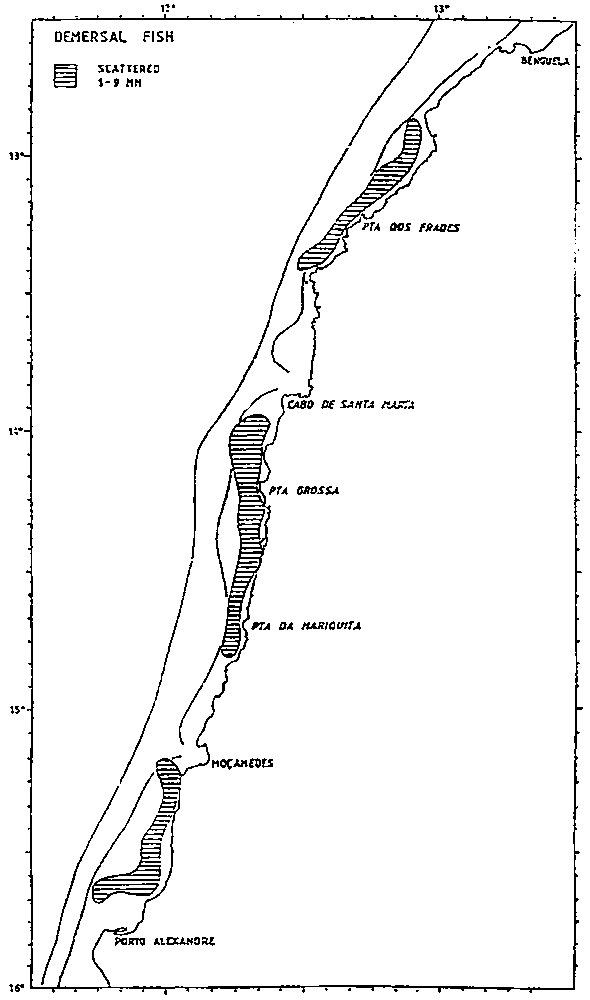
Figure 15. Distribution of the three categories of fish between Benguela and Luanda; “Pelagic I” sardinellas and anchovy; “Pelagic II” Trachurus trecae other carangids, scombrids etc; “Demersal” sparids, sciaenids, trichiurids etc.
PELAGIC FISH 1
PELAGIC FISH 2
DEMERSAL FISH
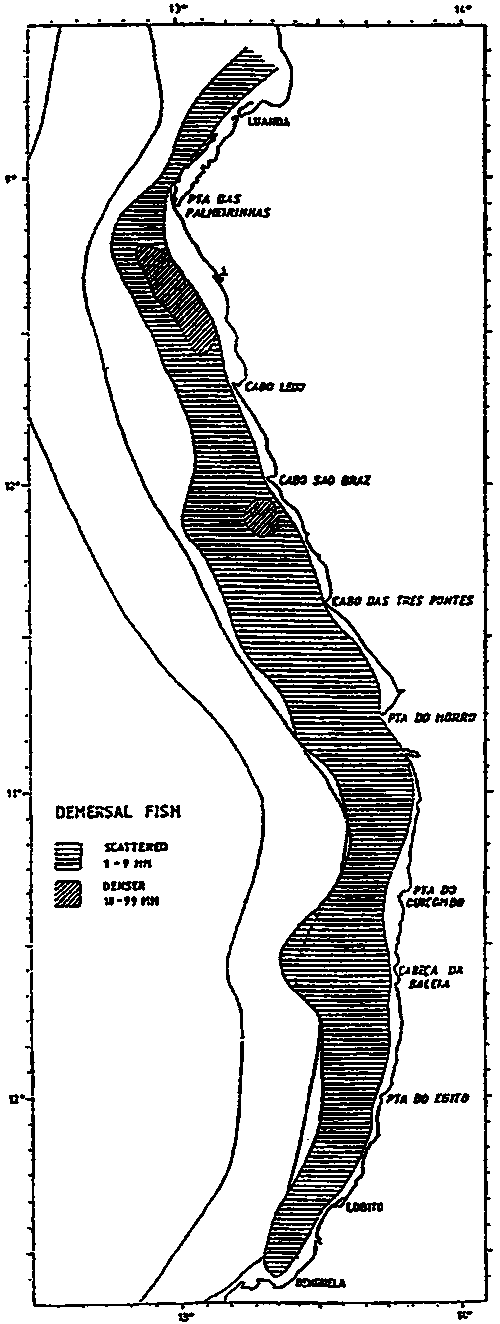
Figure 16. Distribution of small pelagic fish from Luanda to Cabinda.
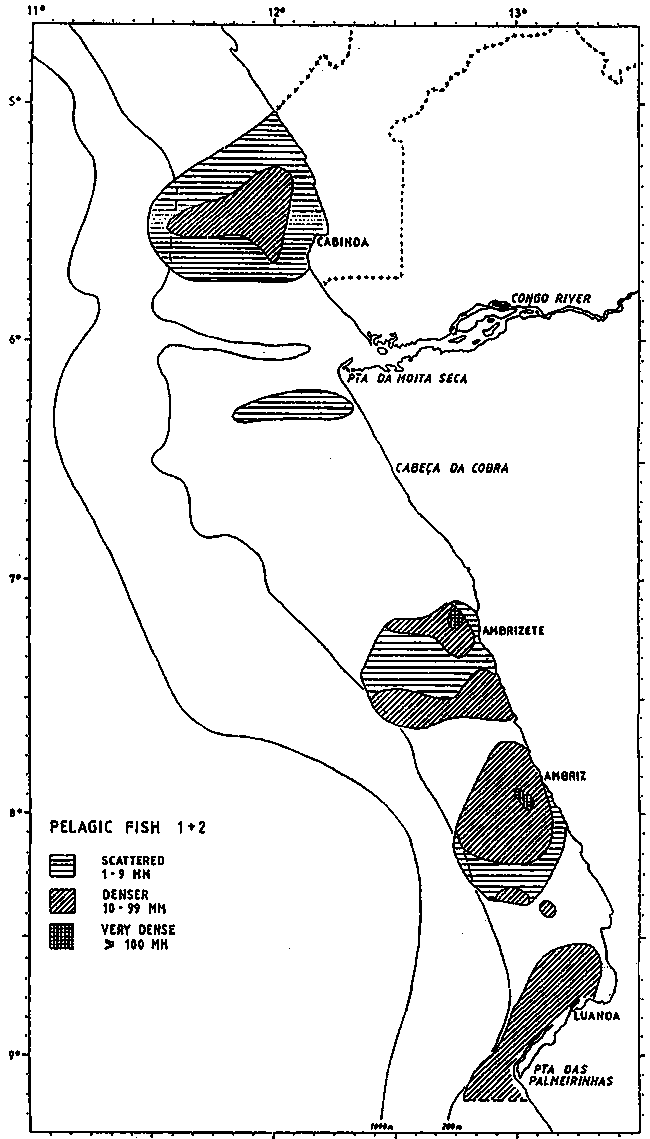
Figure 17. Distribution of “demersal” fish from Luanda to Cabinda.
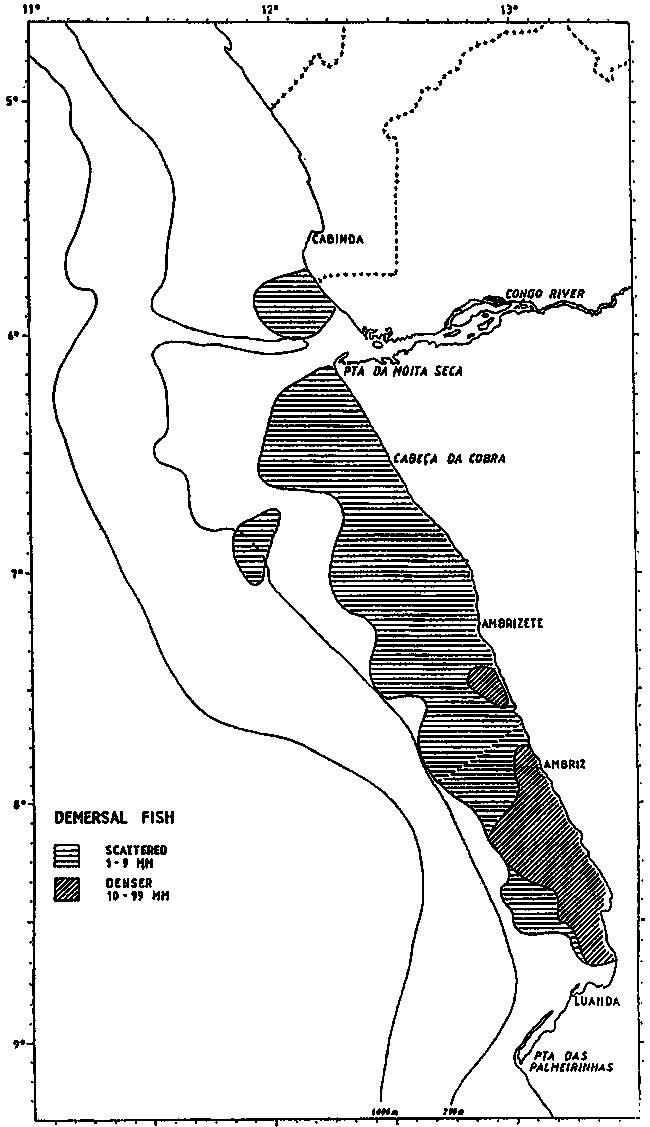
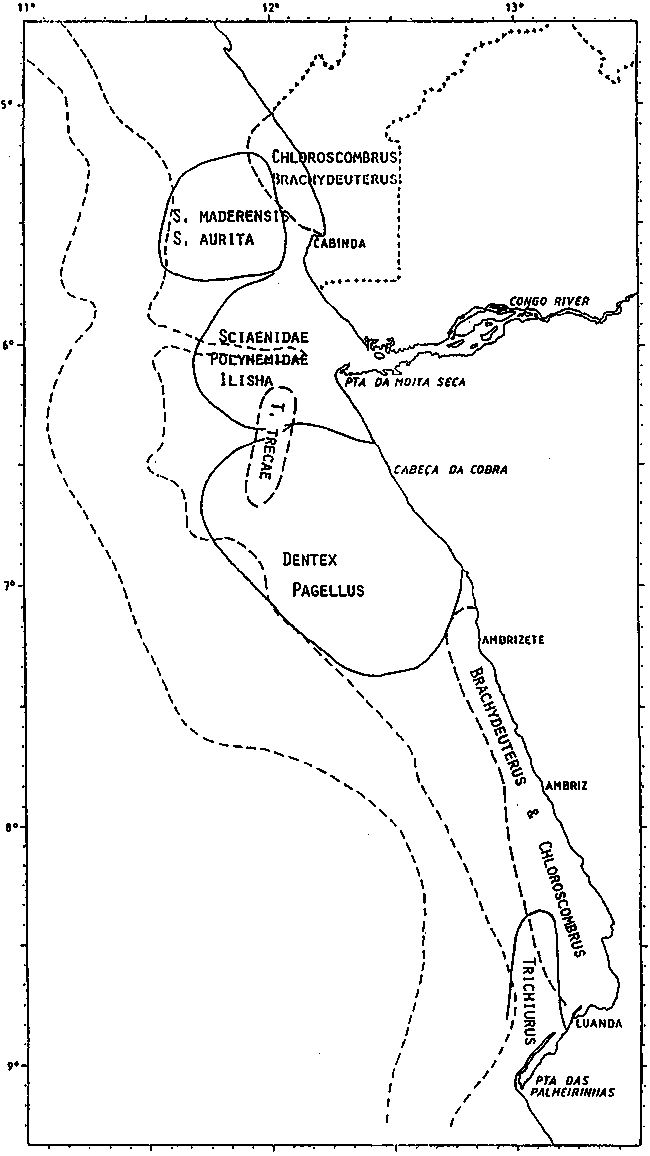
Figure 18. Main fish communities from Luanda to Cabinda.
![]()
![]()