![]()
![]()
|
Exhibit 1: Dairy Cow Populations by Region and Production
System |
||||||||
|
Production |
Region |
TOTAL |
||||||
|
SSA |
ASIA |
CSA |
WANA |
OECD |
EE+CIS |
OTH DVP |
||
|
LGT |
4,042 |
769 |
3,836 |
355 |
2,735 |
0 |
0 |
11,737 |
|
LGH |
2,781 |
0 |
4,966 |
0 |
279 |
0 |
440 |
8,466 |
|
LGA |
11,399 |
0 |
256 |
261 |
1,342 |
0 |
480 |
13,738 |
|
MRT |
3,139 |
311 |
996 |
0 |
32,416 |
47,820 |
0 |
84,682 |
|
MRH |
4,521 |
6,687 |
22,080 |
0 |
985 |
0 |
0 |
34,273 |
|
MRA |
2,880 |
16,136 |
2,896 |
8,539 |
0 |
0 |
0 |
30,451 |
|
MIT |
0 |
932 |
1,916 |
0 |
6,668 |
2,467 |
0 |
11,983 |
|
MIH |
0 |
9,882 |
390 |
0 |
89 |
0 |
0 |
10,361 |
|
MIA |
0 |
11,952 |
2,899 |
4,807 |
664 |
0 |
110 |
20,432 |
|
LLR |
0 |
0 |
0 |
0 |
0 |
0 |
0 |
0 |
|
TOTAL |
28,762 |
46,669 |
40,235 |
13,962 |
45,178 |
50,287 |
1,030 |
226,123 |
|
Exhibit 2: Other Cattle Populations by Region and Production
System |
||||||||
|
Production |
Region |
TOTAL |
||||||
|
SSA |
ASIA |
CSA |
WANA |
OECD |
EE+CIS |
OTH DVP |
||
|
LGT |
11,465 |
11,123 |
20,635 |
713 |
13,203 |
0 |
0 |
57,139 |
|
LGH |
23,214 |
19,979 |
123,697 |
0 |
6,667 |
0 |
6,069 |
179,626 |
|
LGA |
45,238 |
4,164 |
11,034 |
421 |
21,685 |
0 |
6,607 |
89,149 |
|
MRT |
18,340 |
11,189 |
8,716 |
0 |
112,925 |
33,425 |
0 |
184,595 |
|
MRH |
20,031 |
53,350 |
85,782 |
0 |
7,954 |
0 |
0 |
167,117 |
|
MRA |
16,555 |
56,754 |
24,846 |
9,240 |
2,775 |
0 |
0 |
110,170 |
|
MIT |
0 |
12,017 |
2,750 |
0 |
12,353 |
1,275 |
0 |
28,395 |
|
MIH |
0 |
74,727 |
2,739 |
0 |
1,936 |
0 |
0 |
79,402 |
|
MIA |
1,854 |
77,552 |
7,232 |
8,181 |
3,705 |
0 |
233 |
98,757 |
|
LLR |
0 |
0 |
0 |
0 |
15,064 |
51,167 |
0 |
66,231 |
|
TOTAL |
136,697 |
320,855 |
287,431 |
18,555 |
198,267 |
85,867 |
12,909 |
1,060,581 |
SSA = Sub-Saharan Africa
ASIA = Asia
CSA = Central and South America
WANA = West Africa and North Africa
OECD = OECD countries
EE + CIS = Eastern Europe and the Commonwealth of Independent
States (former Soviet Union)
OTH DVP = Other developed countries (South Africa and
Israel)
Production System Definitions:
LGx = livestock grazing system
MRx = mixed farming (crops and animals) rainfed
system
MIx = mixed farming (crops and animals) irrigated
system
xxT = temperate environment
xxH = humid environment
xxA = arid environment
LLR = landless ruminant animals
|
Exhibit 3: Cattle Densities by Region and Production
System |
|
|
|
Region: |
Production System: |
|
S = SSA |
1 = LGT |
|
A = Asia |
2 = LGH |
|
C = CSA |
3 = LGA |
|
W = WANA |
4 = MRT |
|
O = OECD |
5 = MRH |
|
E = EE+CIS |
6 = MRA |
|
D = Other Developed |
7 = MIT |
|
|
8 = MIH |
|
|
9 = MIA |
|
Exhibit 4: Distribution of Cattle Among Feeding Situations:
By Region |
||||||
|
Region |
Distribution Across Regions (%)a |
Distribution Within Regions (%)b |
||||
|
Graze |
Graze |
Stall-fed |
Graze |
Graze |
Stall-fed |
|
|
SSA |
51 |
43 |
6 |
42 |
12 |
2 |
|
ASIA |
10 |
30 |
60 |
18 |
20 |
42 |
|
CSA |
0 |
85 |
15 |
0 |
49 |
9 |
|
WANA |
59 |
0 |
41 |
9 |
0 |
3 |
|
OECD |
12 |
36 |
52 |
15 |
16 |
24 |
|
EE+CIS |
25 |
1 |
75 |
16 |
0 |
20 |
|
OTH DVP |
0 |
98 |
2 |
0 |
2 |
0 |
|
TOTAL |
16 |
44 |
40 |
100 |
100 |
100 |
a Percentage of cattle in each feeding situation within the region. The percentages add to 100% within the region.b Percentage of cattle in each region within the feeding situation. The percentages add to 100% within the feeding situation.
|
Exhibit 5: Distribution of Cattle Among Feeding Situations: By Production
System |
||||||
|
Production |
Distribution Across Systems (%)a |
Distribution Within Systems (%)b |
||||
|
Graze |
Graze |
Stall-fed |
Graze |
Graze |
Stall-fed |
|
|
LGT |
19 |
81 |
0 |
6 |
10 |
0 |
|
LGH |
28 |
72 |
0 |
26 |
24 |
0 |
|
LGA |
82 |
18 |
0 |
42 |
3 |
0 |
|
MRT |
12 |
33 |
55 |
16 |
16 |
29 |
|
MRH |
0 |
58 |
42 |
0 |
21 |
16 |
|
MRA |
7 |
28 |
65 |
5 |
7 |
18 |
|
MIT |
0 |
61 |
39 |
0 |
4 |
3 |
|
MIH |
0 |
84 |
16 |
0 |
13 |
3 |
|
MIA |
8 |
9 |
82 |
5 |
2 |
19 |
|
LLR |
0 |
0 |
100 |
0 |
0 |
13 |
|
TOTAL |
16 |
44 |
40 |
100 |
100 |
100 |
a Percentage of cattle in each feeding situation within the system. The percentages add to 100% within the system.b Percentage of cattle in each system within the feeding situation. The percentages add to 100% within the feeding situation.
|
Exhibit 6: Summary Cattle Characteristics Estimated
for |
|||||
|
Region |
Weight (kg) |
Net Energy Intakes (MJ/day)a |
|||
|
NEm |
NEfeed |
NEg |
NEo |
||
|
Dairy Cows |
|||||
|
SSA |
211 |
18.6 |
1.6 |
0.0 |
3.5 |
|
ASIA |
189 |
17.1 |
0.4 |
0.0 |
14.9 |
|
CSA |
409 |
30.5 |
1.7 |
0.0 |
14.1 |
|
WANA |
191 |
17.2 |
1.5 |
0.0 |
9.9 |
|
OECD |
600 |
40.6 |
2.6 |
0.0 |
48.0 |
|
EE+CIS |
391 |
29.5 |
0.0 |
0.0 |
21.6 |
|
OTH DVP |
459 |
33.2 |
3.8 |
0.0 |
42.7 |
|
Other Cattle |
|||||
|
SSA |
146 |
13.5 |
3.4 |
0.6 |
1.6 |
|
ASIA |
130 |
12.4 |
2.3 |
0.6 |
1.5 |
|
CSA |
282 |
22.1 |
3.4 |
1.0 |
2.6 |
|
WANA |
132 |
12.5 |
4.6 |
0.6 |
1.5 |
|
OECD |
319 |
24.3 |
4.0 |
5.7 |
4.3 |
|
EE+CIS |
270 |
21.4 |
3.9 |
1.0 |
2.5 |
|
OTH DVP |
316 |
24.1 |
2.7 |
1.1 |
2.8 |
a Net energy intake in MJ per day defined as follows: NEm = net energy for maintenance; NEfeed = net energy for the feeding situation; NEg = net energy for growth; NEo = net energy for other purposes, including pregnancy, lactation, and work. Net energy intakes are averages across production systems within the region.
|
Exhibit 7: Feed Characteristics for Dairy Cows by Region
and Production System |
|||||||
|
Production |
Region |
||||||
|
SSA |
ASIA |
CSA |
WANA |
OECD |
EE+CIS |
OTH DVP |
|
|
LGT |
60-6.0 |
60-6.0 |
60-6.0 |
60-6.0 |
65-6.0 |
NA |
NA |
|
LGH |
60-6.0 |
NA |
60-6.0 |
NA |
65-6.0 |
NA |
60-6.0 |
|
LGA |
60-6.0 |
NA |
60-6.0 |
60-6.0 |
65-6.0 |
NA |
60-6.0 |
|
MRT |
60-6.0 |
60-6.0 |
60-6.0 |
NA |
65-6.0 |
60-6.0 |
NA |
|
MRH |
60-6.0 |
60-6.0 |
60-6.0 |
NA |
65-6.0 |
NA |
NA |
|
MRA |
60-6.0 |
60-6.0 |
60-6.0 |
60-6.0 |
NA |
NA |
NA |
|
MIT |
NA |
60-6.0 |
60-6.0 |
NA |
65-6.0 |
60-6.0 |
NA |
|
MIH |
NA |
60-6.0 |
60-6.0 |
NA |
65-6.0 |
NA |
NA |
|
MIA |
NA |
60-6.0 |
60-6.0 |
60-6.0 |
65-6.0 |
NA |
60-6.0 |
|
LLR |
NA |
NA |
NA |
NA |
NA |
NA |
NA |
NA = not applicable (there are no cattle in the region/production system)
|
Exhibit 8: Feed Characteristics for Other Cattle by
Region and Production System |
|||||||
|
Production |
Region |
||||||
|
SSA |
ASIA |
CSA |
WANA |
OECD |
EE+CIS |
OTH DVP |
|
|
LGT |
55-6.5 |
60-6.0 |
60-6.0 |
60-6.0 |
60-6.0 |
NA |
NA |
|
LGH |
50-7.5 |
55-6.0 |
55-6.0 |
NA |
60-6.0 |
NA |
55-6.0 |
|
LGA |
50-7.5 |
50-6.5 |
50-6.5 |
50-6.5 |
60-6.0 |
NA |
50-6.5 |
|
MRT |
55-6.5 |
60-6.0 |
60-6.0 |
NA |
65-6.0 |
60-6.0 |
NA |
|
MRH |
50-7.5 |
50-6.0 |
55-6.0 |
NA |
65-6.0 |
NA |
NA |
|
MRA |
50-7.5 |
50-6.5 |
50-6.5 |
50-6.5 |
65-6.0 |
NA |
NA |
|
MIT |
NA |
60-6.0 |
60-6.0 |
NA |
65-6.0 |
60-6.0 |
NA |
|
MIH |
NA |
55-6.0 |
55-6.0 |
NA |
65-6.0 |
NA |
NA |
|
MIA |
50-7.5 |
55-6.0 |
55-6.0 |
55-6.0 |
65-6.0 |
NA |
55-6.0 |
|
LLR |
NA |
NA |
NA |
NA |
75-3.5 |
75-6.0 |
NA |
NA = not applicable (there are no cattle in the region/production system)
|
Exhibit 9: Enteric Fermentation Emissions Factors for
Dairy Cows by Region and Production System |
||||||||
|
Production |
Region |
TOTAL |
||||||
|
SSA |
ASIA |
CSA |
WANA |
OECD |
EE+CIS |
OTH DVP |
||
|
LGT |
34.1 |
31.3 |
60.9 |
30.4 |
89.2 |
NA |
NA |
55.4 |
|
LGH |
32.3 |
NA |
69.3 |
NA |
102.0 |
NA |
82.6 |
58.9 |
|
LGA |
34.2 |
NA |
74.3 |
49.1 |
102.0 |
NA |
82.5 |
43.6 |
|
MRT |
28.2 |
91.7 |
57.0 |
NA |
103.3 |
69.5 |
NA |
80.9 |
|
MRH |
28.8 |
32.1 |
52.0 |
NA |
119.9 |
NA |
NA |
47.0 |
|
MRA |
29.0 |
34.2 |
54.0 |
38.9 |
NA |
NA |
NA |
37.0 |
|
MIT |
NA |
41.9 |
54.7 |
NA |
99.6 |
64.7 |
NA |
80.8 |
|
MIH |
NA |
31.8 |
67.8 |
NA |
120.2 |
NA |
NA |
33.9 |
|
MIA |
NA |
34.9 |
58.0 |
31.8 |
119.9 |
NA |
149.2 |
40.8 |
|
LLR |
NA |
NA |
NA |
NA |
NA |
NA |
NA |
NA |
|
TOTAL |
32.0 |
34.1 |
56.1 |
36.5 |
102.5 |
69.3 |
89.7 |
59.6 |
NA = not applicable (there are no cattle in the region/production system)
|
Exhibit 10: Enteric Fermentation Emissions Factors
for Other Cattle by Region and Production System |
||||||||
|
Production |
Region |
TOTAL |
||||||
|
SSA |
ASIA |
CSA |
WANA |
OECD |
EE+CIS |
OTH DVP |
||
|
LGT |
29.7 |
25.6 |
39.7 |
25.8 |
56.1 |
NA |
NA |
38.6 |
|
LGH |
45.0 |
29.0 |
45.0 |
NA |
62.5 |
NA |
49.1 |
44.0 |
|
LGA |
45.0 |
35.9 |
55.9 |
36.2 |
62.5 |
NA |
60.9 |
51.3 |
|
MRT |
29.7 |
22.3 |
39.4 |
NA |
46.8 |
44.1 |
NA |
42.8 |
|
MRH |
39.3 |
28.6 |
44.3 |
NA |
48.5 |
NA |
NA |
38.9 |
|
MRA |
39.3 |
27.5 |
54.6 |
36.2 |
49.5 |
NA |
NA |
36.7 |
|
MIT |
NA |
22.3 |
39.7 |
NA |
48.0 |
38.5 |
NA |
35.9 |
|
MIH |
NA |
25.2 |
42.6 |
NA |
46.8 |
NA |
NA |
26.3 |
|
MIA |
45.0 |
22.1 |
45.0 |
29.2 |
49.5 |
NA |
43.0 |
25.9 |
|
LLR |
NA |
NA |
NA |
NA |
21.0 |
24.6 |
NA |
23.8 |
|
TOTAL |
40.1 |
25.6 |
45.4 |
32.7 |
47.9 |
32.4 |
55.1 |
38.1 |
NA = not applicable (there are no cattle in the region/production system)
|
Exhibit 11: Cattle Enteric Fermentation Methane Emissions
by Region and Production System |
||||||||
|
Production |
Region |
TOTAL |
||||||
|
SSA |
ASIA |
CSA |
WANA |
OECD |
EE+CIS |
OTH DVP |
||
|
LGT |
479 |
309 |
1,054 |
29 |
985 |
0 |
0 |
2,855 |
|
LGH |
1,134 |
579 |
5,915 |
0 |
445 |
0 |
334 |
8,408 |
|
LGA |
2,425 |
150 |
635 |
28 |
1,493 |
0 |
442 |
5,174 |
|
MRT |
634 |
278 |
400 |
0 |
8,632 |
4,799 |
0 |
14,743 |
|
MRH |
917 |
1,739 |
4,950 |
0 |
504 |
0 |
0 |
8,110 |
|
MRA |
734 |
2,113 |
1,514 |
667 |
137 |
0 |
0 |
5,165 |
|
MIT |
0 |
307 |
214 |
0 |
1,257 |
209 |
0 |
1,987 |
|
MIH |
0 |
2,199 |
143 |
0 |
101 |
0 |
0 |
2,444 |
|
MIA |
83 |
2,135 |
494 |
392 |
263 |
0 |
26 |
3,394 |
|
LLR |
0 |
0 |
0 |
0 |
316 |
1,259 |
0 |
1,574 |
|
TOTAL |
6,406 |
9,808 |
15,320 |
1,116 |
14,133 |
6,266 |
803 |
53,853 |
|
Exhibit 12: Enteric Fermentation Methane Emissions
for Dairy Cows by Region and Production System |
||||||||
|
Production |
Region |
TOTAL |
||||||
|
SSA |
ASIA |
CSA |
WANA |
OECD |
EE+CIS |
OTH DVP |
||
|
LGT |
.138 |
24 |
234 |
11 |
224 |
0 |
0 |
650 |
|
LGH |
90 |
0 |
344 |
0 |
28 |
0 |
36 |
499 |
|
LGA |
390 |
0 |
19 |
13 |
137 |
0 |
40 |
599 |
|
MRT |
88 |
29 |
57 |
0 |
3,349 |
3,325 |
0 |
6,847 |
|
MRH |
130 |
214 |
1,149 |
0 |
118 |
0 |
0 |
1,612 |
|
MRA |
84 |
553 |
157 |
332 |
0 |
0 |
0 |
1,125 |
|
MIT |
0 |
39 |
105 |
0 |
664 |
160 |
0 |
968 |
|
MIH |
0 |
314 |
26 |
0 |
11 |
0 |
0 |
351 |
|
MIA |
0 |
417 |
168 |
153 |
80 |
0 |
16 |
835 |
|
LLR |
0 |
0 |
0 |
0 |
0 |
0 |
0 |
0 |
|
TOTAL |
921 |
1,590 |
2,258 |
509 |
4,631 |
3,484 |
92 |
13,486 |
|
Exhibit 13: Enteric Fermentation Methane Emissions
for Other Cattle by Region and Production System |
||||||||
|
Production |
Region |
TOTAL |
||||||
|
SSA |
ASIA |
CSA |
WANA |
OECD |
EE+CIS |
OTH DVP |
||
|
LGT |
341 |
285 |
820 |
18 |
741 |
0 |
0 |
2,205 |
|
LGH |
1,044 |
579 |
5,572 |
0 |
417 |
0 |
298 |
7,910 |
|
LGA |
2,035 |
150 |
616 |
15 |
1,356 |
0 |
403 |
4,575 |
|
MRT |
545 |
250 |
343 |
0 |
5,283 |
1,474 |
0 |
7,896 |
|
MRH |
787 |
1,525 |
3,802 |
0 |
386 |
0 |
0 |
6,498 |
|
MRA |
650 |
1,560 |
1,357 |
334 |
137 |
0 |
0 |
4,039 |
|
MIT |
0 |
268 |
109 |
0 |
593 |
49 |
0 |
1,019 |
|
MIH |
0 |
1,885 |
117 |
0 |
91 |
0 |
0 |
2,092 |
|
MIA |
83 |
1,718 |
326 |
239 |
183 |
0 |
10 |
2,559 |
|
LLR |
0 |
0 |
0 |
0 |
316 |
1,259 |
0 |
1,574 |
|
TOTAL |
5,486 |
8,218 |
13,062 |
607 |
9,503 |
2,782 |
711 |
40,368 |
|
Exhibit 14: Summary Methane Emissions from Enteric
Fermentation |
|||||
|
|
Dairy Cows |
Other Cattle |
Buffalo |
Sheep/Goats |
Total |
|
Emissions by Region |
|||||
|
SSA |
0.9 |
5.5 |
0.0 |
1.4 |
7.8 |
|
ASIA |
1.6 |
8.2 |
7.6 |
2.6 |
19.9 |
|
CSA |
2.3 |
13.1 |
0.1 |
0.7 |
16.1 |
|
WANA |
0.5 |
0.6 |
0.2 |
1.2 |
2.6 |
|
OECD |
4.6 |
9.5 |
0.0 |
2.7 |
16.8 |
|
EE+CIS |
3.5 |
2.8 |
0.0 |
1.3 |
7.6 |
|
OTH DVP |
0.1 |
0.7 |
0.0 |
0.3 |
1.1 |
|
Emissions by Production System |
|||||
|
LGT |
0.7 |
2.2 |
0.0 |
1.1 |
3.9 |
|
LGH |
0.5 |
7.9 |
0.0 |
0.9 |
9.3 |
|
LGA |
0.6 |
4.6 |
0.0 |
1.7 |
6.8 |
|
MRT |
6.8 |
7.9 |
0.0 |
1.8 |
16.6 |
|
MRH |
1.6 |
6.5 |
1.2 |
0.7 |
9.9 |
|
MRA |
1.1 |
4.0 |
2.2 |
1.4 |
8.8 |
|
MIT |
1.0 |
1.0 |
0.4 |
0.6 |
2.9 |
|
MIH |
0.4 |
2.1 |
1.7 |
0.5 |
4.7 |
|
MIA |
0.8 |
2.6 |
2.4 |
1.4 |
7.3 |
|
LLR |
0.0 |
1.6 |
0.0 |
0.1 |
1.6 |
|
Total Emissions |
13.5 |
40.4 |
7.9 |
10.1 |
71.9 |
|
Exhibit 15: Methane Emissions from Cattle by Region and
Production System |
|
Emissions by Region Emissions by Production System |
|
Exhibit 16: Methane Emissions from Livestock by Region
and Production System |
|
Emissions by Region Emissions by Production System |
|
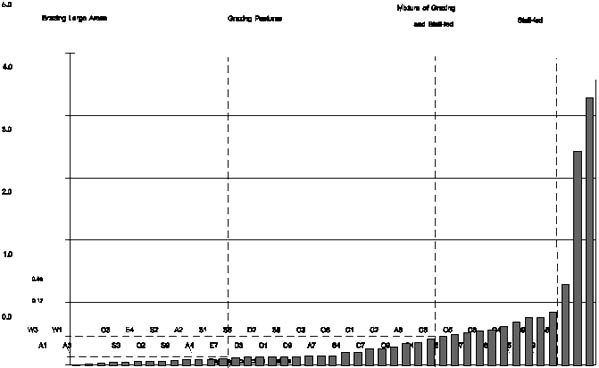
Exhibit 17: Emissions Per Unit of Milk Produced versus
Dairy Cow Emissions |
|
0 |
|
Region: |
Production System: |
|
S = SSA |
1 = LGT |
|
A = Asia |
2 = LGH |
|
C = CSA |
3 = LGA |
|
W = WANA |
4 = MRT |
|
O = OECD |
5 = MRH |
|
E = EE+CIS |
6 = MRA |
|
D = Other Developed |
7 = MIT |
|
|
8 = MIH |
|
|
9 = MIA |
|
|
10 = LLR |
|
Exhibit 18: Emissions Per Unit of Meat Produced versus
Total Cattle Emissions |
|
0 |
|
Region: |
Production System: |
|
S = SSA |
1 = LGT |
|
A = Asia |
2 = LGH |
|
C = CSA |
3 = LGA |
|
W = WANA |
4 = MRT |
|
O = OECD |
5 = MRH |
|
E = EE+CIS |
6 = MRA |
|
D = Other Developed |
7 = MIT |
|
|
8 = MIH |
|
|
9 = MIA |
|
|
10 = LLR |
|
Exhibit 19: Manure Management and Methane Conversion
Factors for Cattle Manure |
||||||||||
|
Region |
Regional Methane Conversion Factors |
Dairy Cows |
Other Cattle |
|||||||
|
Percent of Manure Managed Dry |
Average Methane Conversion Factor |
Percent of Manure Managed Dry |
Average Methane Conversion Factor |
|||||||
|
Dry |
Wet |
Grazing |
Stall-fed |
Grazing |
Stall-fed |
Grazing |
Stall-fed |
Grazing |
Stall-fed |
|
|
SSA |
1.5% |
35.0%* |
100% |
100% |
1.5% |
1.5% |
100% |
100% |
1.5% |
1.5% |
|
ASIA |
2.0% |
35.0% |
100% |
80% |
2.0% |
8.6% |
100% |
100% |
2.0% |
2.0% |
|
CSA |
1.5% |
35.0%* |
100% |
100% |
1.5% |
1.5% |
100% |
100% |
1.5% |
1.5% |
|
WANA |
2.0% |
65.0%* |
100% |
100% |
2.0% |
2.0% |
100% |
100% |
2.0% |
2.0% |
|
OECD |
1.5% |
35.0% |
100% |
70% |
1.5% |
11.6% |
100% |
75% |
1.5% |
9.9% |
|
EE+CIS |
1.0% |
20.0% |
100% |
80% |
1.0% |
4.8% |
100% |
50% |
1.0% |
10.5% |
|
OTH DVP |
1.5% |
35.0%* |
100% |
100% |
1.5% |
1.5% |
100% |
100% |
1.5% |
1.5% |
Manure from all grazing cattle managed dry. Portion of manure from stall-fed cattle managed wet estimated from Safley et al. (1992) and USEPA (1994). Methane Conversion Factors (MCFs) from USEPA (1994) based on approximate temperature regime and type of liquid manure management facilities typically used in each region. MCFs marked with “*” are not used in the analysis because all manure is estimated to be handled in a dry form. The average MCFs for dairy cows and other cattle are estimated by weighting the dry and wet regional MCFs by the appropriate portions of manure managed in dry and wet forms.
|
Exhibit 20: Manure Management Emissions Factors for
Dairy Cows by Region and Production System |
||||||||
|
Production |
Region |
TOTAL |
||||||
|
SSA |
ASIA |
CSA |
WANA |
OECD |
EE+CIS |
OTH DVP |
||
|
LGT |
1.2 |
1.5 |
2.2 |
1.5 |
5.2 |
NA |
NA |
2.5 |
|
LGH |
1.2 |
NA |
2.5 |
NA |
5.9 |
NA |
5.5 |
2.3 |
|
LGA |
1.2 |
NA |
2.7 |
2.4 |
5.9 |
NA |
5.5 |
1.9 |
|
MRT |
1.0 |
19.0 |
2.1 |
NA |
46.4 |
14.8 |
NA |
26.2 |
|
MRH |
1.0 |
6.6 |
1.9 |
NA |
53.8 |
NA |
NA |
4.2 |
|
MRA |
1.0 |
7.1 |
1.9 |
1.9 |
NA |
NA |
NA |
4.6 |
|
MIT |
NA |
8.7 |
2.0 |
NA |
44.7 |
13.8 |
NA |
28.7 |
|
MIH |
NA |
6.6 |
2.4 |
NA |
53.9 |
NA |
NA |
6.8 |
|
MIA |
NA |
7.2 |
2.1 |
1.5 |
53.8 |
NA |
9.9 |
6.7 |
|
LLR |
NA |
NA |
NA |
NA |
NA |
NA |
NA |
NA |
|
TOTAL |
1.2 |
7.0 |
2.0 |
1.8 |
42.5 |
14.8 |
6.0 |
13.8 |
NA = not applicable (there are no cattle in the region/production system)
|
Exhibit 21: Manure Management Emissions Factors for
Other Cattle by Region and Production System |
||||||||
|
Production |
Region |
TOTAL |
||||||
|
SSA |
ASIA |
CSA |
WANA |
OECD |
EE+CIS |
OTH DVP |
||
|
LGT |
0.9 |
0.9 |
1.1 |
1.0 |
2.6 |
NA |
NA |
1.4 |
|
LGH |
1.2 |
1.2 |
1.4 |
NA |
2.9 |
NA |
2.6 |
1.5 |
|
LGA |
1.2 |
1.5 |
1.8 |
1.5 |
2.9 |
NA |
3.3 |
1.9 |
|
MRT |
0.9 |
0.8 |
1.1 |
NA |
8.0 |
1.4 |
NA |
5.3 |
|
MRH |
1.1 |
1.2 |
1.4 |
NA |
4.3 |
NA |
NA |
1.4 |
|
MRA |
1.1 |
1.2 |
1.7 |
1.5 |
2.0 |
NA |
NA |
1.3 |
|
MIT |
NA |
0.8 |
1.1 |
NA |
5.4 |
1.2 |
NA |
2.9 |
|
MIH |
NA |
1.0 |
1.3 |
NA |
8.0 |
NA |
NA |
1.2 |
|
MIA |
1.2 |
0.9 |
1.4 |
1.2 |
2.0 |
NA |
2.3 |
1.0 |
|
LLR |
NA |
NA |
NA |
NA |
13.5 |
5.1 |
NA |
7.0 |
|
TOTAL |
1.1 |
1.1 |
1.4 |
1.4 |
6.8 |
3.6 |
3.0 |
2.5 |
NA = not applicable (there are no cattle in the region/production system)
|
Exhibit 22: Cattle Manure Management Emissions by Region
and Production System |
||||||||
|
Production |
Region |
TOTAL |
||||||
|
SSA |
ASIA |
CSA |
WANA |
OECD |
EE+CIS |
OTH DVP |
||
|
LGT |
15 |
12 |
31 |
1 |
49 |
0 |
0 |
108 |
|
LGH |
32 |
24 |
186 |
0 |
21 |
0 |
18 |
282 |
|
LGA |
71 |
6 |
20 |
1 |
72 |
0 |
25 |
195 |
|
MRT |
19 |
15 |
12 |
0 |
2,402 |
755 |
0 |
3,203 |
|
MRH |
27 |
109 |
160 |
0 |
88 |
0 |
0 |
384 |
|
MRA |
21 |
181 |
49 |
30 |
6 |
0 |
0 |
287 |
|
MIT |
0 |
18 |
7 |
0 |
365 |
36 |
0 |
425 |
|
MIH |
0 |
143 |
5 |
0 |
20 |
0 |
0 |
168 |
|
MIA |
2 |
158 |
16 |
17 |
43 |
0 |
2 |
239 |
|
LLR |
0 |
0 |
0 |
0 |
204 |
260 |
0 |
464 |
|
TOTAL |
186 |
667 |
486 |
50 |
3,270 |
1,050 |
44 |
5,755 |
|
Exhibit 23: Manure Management Emissions for Dairy Cows
by Region and Production System |
||||||||
|
Production |
Region |
TOTAL |
||||||
|
SSA |
ASIA |
CSA |
WANA |
OECD |
EE+CIS |
OTH DVP |
||
|
LGT |
5 |
1 |
8 |
1 |
14 |
0 |
0 |
29 |
|
LGH |
3 |
0 |
12 |
0 |
2 |
0 |
2 |
20 |
|
LGA |
14 |
0 |
1 |
1 |
8 |
0 |
3 |
26 |
|
MRT |
3 |
6 |
2 |
0 |
1,503 |
709 |
0 |
2,222 |
|
MRH |
5 |
44 |
41 |
0 |
53 |
0 |
0 |
143 |
|
MRA |
3 |
114 |
6 |
16 |
0 |
0 |
0 |
139 |
|
MIT |
0 |
8 |
4 |
0 |
298 |
34 |
0 |
344 |
|
MIH |
0 |
65 |
1 |
0 |
5 |
0 |
0 |
71 |
|
MIA |
0 |
86 |
6 |
7 |
36 |
0 |
1 |
137 |
|
LLR |
0 |
0 |
0 |
0 |
0 |
0 |
0 |
0 |
|
TOTAL |
33 |
325 |
81 |
24 |
1,918 |
743 |
6 |
3,131 |
|
Exhibit 24: Manure Management Emissions for Other Cattle
by Region and Production System |
||||||||
|
Production |
Region |
TOTAL |
||||||
|
SSA |
ASIA |
CSA |
WANA |
OECD |
EE+CIS |
OTH DVP |
||
|
LGT |
10 |
11 |
23 |
1 |
35 |
0 |
0 |
79 |
|
LGH |
29 |
24 |
174 |
0 |
20 |
0 |
16 |
262 |
|
LGA |
56 |
6 |
20 |
1 |
64 |
0 |
22 |
169 |
|
MRT |
16 |
9 |
10 |
0 |
900 |
46 |
0 |
981 |
|
MRH |
22 |
65 |
119 |
0 |
35 |
0 |
0 |
240 |
|
MRA |
18 |
67 |
43 |
14 |
6 |
0 |
0 |
148 |
|
MIT |
0 |
10 |
3 |
0 |
67 |
2 |
0 |
81 |
|
MIH |
0 |
78 |
4 |
0 |
15 |
0 |
0 |
98 |
|
MIA |
2 |
71 |
10 |
10 |
8 |
0 |
1 |
102 |
|
LLR |
0 |
0 |
0 |
0 |
204 |
260 |
0 |
464 |
|
TOTAL |
153 |
342 |
405 |
26 |
1,352 |
308 |
38 |
2,624 |
|
Exhibit 25: Summary Methane Emissions from Manure
Management |
|||||
|
|
Dairy Cows |
Other Cattle |
Buffalo |
Sheep/Goats |
Total |
|
Emissions by Region |
|||||
|
SSA |
0.0 |
0.2 |
0.0 |
0.1 |
0.2 |
|
ASIA |
0.3 |
0.3 |
0.5 |
0.1 |
1.3 |
|
CSA |
0.1 |
0.4 |
0.0 |
0.0 |
0.5 |
|
WANA |
0.0 |
0.0 |
0.0 |
0.0 |
0.1 |
|
OECD |
1.9 |
1.4 |
0.0 |
0.1 |
3.3 |
|
EE+CIS |
0.7 |
0.3 |
0.0 |
0.0 |
1.1 |
|
OTH DVP |
0.0 |
0.0 |
0.0 |
0.0 |
0.1 |
|
Emissions by Production System |
|||||
|
LGT |
0.0 |
0.1 |
0.0 |
0.0 |
0.1 |
|
LGH |
0.0 |
0.3 |
0.0 |
0.0 |
0.3 |
|
LGA |
0.0 |
0.2 |
0.0 |
0.1 |
0.3 |
|
MRT |
2.2 |
1.0 |
0.0 |
0.0 |
3.3 |
|
MRH |
0.1 |
0.2 |
0.1 |
0.0 |
0.5 |
|
MRA |
0.1 |
0.1 |
0.1 |
0.0 |
0.5 |
|
MIT |
0.3 |
0.1 |
0.0 |
0.0 |
0.5 |
|
MIH |
0.1 |
0.1 |
0.1 |
0.0 |
0.3 |
|
MIA |
0.1 |
0.1 |
0.2 |
0.0 |
0.5 |
|
LLR |
0.0 |
0.5 |
0.0 |
0.0 |
0.5 |
|
Total Emissions |
3.1 |
2.6 |
0.5 |
0.3 |
6.6 |
|
Exhibit 26: Summary Methane Emissions from Livestock:
Enteric Fermentation and Manure Management |
|||||
|
|
Dairy Cows |
Other Cattle |
Buffalo |
Sheep/Goats |
Total |
|
Emissions by Region |
|||||
|
SSA |
1.0 |
5.6 |
0.0 |
1.4 |
8.0 |
|
ASIA |
1.9 |
8.6 |
8.0 |
2.7 |
21.2 |
|
CSA |
2.3 |
13.5 |
0.1 |
0.7 |
16.6 |
|
WANA |
0.5 |
0.6 |
0.3 |
1.3 |
2.7 |
|
OECD |
6.5 |
10.9 |
0.0 |
2.7 |
20.1 |
|
EE+CIS |
4.2 |
3.1 |
0.0 |
1.3 |
8.7 |
|
OTH DVP |
0.1 |
0.7 |
0.0 |
0.3 |
1.2 |
|
Emissions by Production System |
|||||
|
LGT |
0.7 |
2.3 |
0.0 |
1.1 |
4.1 |
|
LGH |
0.5 |
8.2 |
0.0 |
0.9 |
9.6 |
|
LGA |
0.6 |
4.7 |
0.0 |
1.7 |
7.1 |
|
MRT |
9.1 |
8.9 |
0.0 |
1.9 |
19.9 |
|
MRH |
1.8 |
6.7 |
1.2 |
0.7 |
10.4 |
|
MRA |
1.3 |
4.2 |
2.3 |
1.5 |
9.3 |
|
MIT |
1.3 |
1.1 |
0.4 |
0.6 |
3.4 |
|
MIH |
0.4 |
2.2 |
1.8 |
0.5 |
5.0 |
|
MIA |
1.0 |
2.7 |
2.6 |
1.5 |
7.7 |
|
LLR |
0.0 |
2.0 |
0.0 |
0.1 |
2.1 |
|
Total Emissions |
16.6 |
43.0 |
8.4 |
10.5 |
78.5 |
|
Exhibit 27: Comparison of Global Livestock Methane
Emissions Estimates |
||||
|
|
Cattle |
Buffalo |
Sheep/Goats |
Total |
|
Enteric Fermentation |
||||
|
This Study |
53.9 |
7.9 |
10.1 |
71.9 |
|
USEPA (1994) |
58.1 |
7.7 |
10.4 |
76.2 |
|
Manure Management Facilities |
||||
|
This Study |
5.7 |
0.5 |
0.3 |
6.6 |
|
USEPA (1994) |
6.1a |
--a |
-- |
|
a The emissions from manure management facilities for cattle and buffalo are reported together in USEPA (1994). Emissions from sheep and goats are not reported separately in USEPA (1994). Total manure management facility methane emissions from sheep, goats, horses, mules, asses, and camels are reported as 1.2 million tons in USEPA (1994).
|
Exhibit 28: Global Methane Emissions from Other Livestock
in 1990a |
||||||
|
Emissions Type |
Swine |
Poultry |
Camels |
Horses |
Mules/Asses |
Total |
|
Enteric Fermentation |
1.0 |
NE |
0.9 |
1.1 |
0.6 |
2.6 |
|
Manure Management |
5.3 |
1.3 |
0.9b |
7.5 |
||
|
Total |
6.3 |
1.3 |
2.5 |
10.1 |
||
a Source: USEPA (1994).b Manure management facility emissions from sheep, goats, horses, mules, asses, and camels are reported together as 1.2 million tons in USEPA (1994). The portion attributable to camels, horses, mules/asses is estimated at about 0.9 million tons.
|
Exhibit 29: Framework for Evaluating Enteric Fermentation
Emissions Reduction Options |
|
|
|
Exhibit 30: Typical Compositions of Molasses/Urea
Multinutrient Blocks |
||
|
Ingredient |
Amount (%) |
Function |
|
Molasses |
40-60 |
Palatability and Energy |
|
Urea |
4-15 |
Ammonia Source |
|
Lime |
8-10 |
Binding Agent |
|
Mineral/Vitamins |
1-15 |
Nutrient Supplements |
|
Wheat/Rice Bran |
20-30 |
Soluble Protein |
Sources: Leng, 1991; Saadullah, 1991.
|
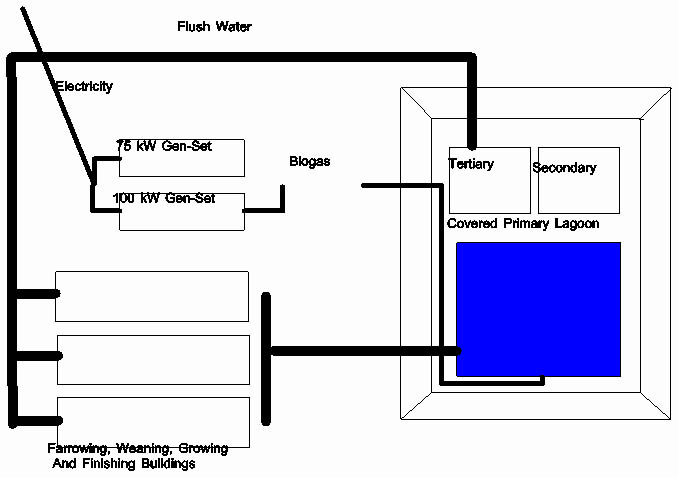
Exhibit 31: Royal Farms Covered Lagoon
System |
|
|
Source: USEPA (1995).
![]()
![]()