Environmental concerns, food scares, production subsidies and institutional reforms have all contributed to the substantial growth in organic production and sales in recent years. Global retail sales of certified organic products have increased to around $16 billion in 2000. In some national markets, a few organic products have obtained shares of 10 or even 15 percent. Organic sales represent a small share, between 1-2 percent, of global food and beverages, but they constitute a growing market that appears to be more than a passing fashion. While many consumers view organic products as catering for the privileged few, the products are gaining greater acceptance.
The market for food is evolving quickly in developed countries. The increase in demand for natural products seems somewhat incongruous given increased sales of processed and convenience (fast) foods. Sales of certified organic food have increasingly moved into supermarket chains and gained much wider exposure. In this changing environment, different and new factors will drive the growth in organic sales in the future.
The purpose of this Chapter is to examine the current state of certified organic agriculture and to assess its situation and outlook in the coming years. While such prognostics are inherently unreliable, it is useful to focus on the factors that may drive the trends. While some of these factors, such as food safety concerns and technological innovations, are unpredictable in magnitude and timing, others are observable (e.g. income growth), constrained by supply side factors (e.g. lack of feed) and determined by institutional changes (e.g. harmonization of standards) and policies (e.g. agricultural subsidies and environmental regulations).
This Chapter describes the distinctive characteristics of organic agriculture that have an impact on marketing and trade of organic commodities. The current situation with organic production, retail marketing and international trade is then presented. Trends and factors driving organic growth suggest the outlook for organic production and sale until 2010 as well as possible implications on commodity trade and land use.
There is no official data for organic production, consumption, trade or prices. National statistics organizations tend to regard organic production as of insufficient importance to be reported separately. The best estimates of the state of organic agriculture relate to land use and retail sales. On the production side, certifying bodies may collect farm-level data, but for reasons of confidentiality may be reluctant to make it publicly available.
Organic sales represent a small share, between 1-2 percent, of global food and beverages, but they constitute a growing market that appears to be more than a passing fashion.
Some production on certified organic farms may be sold as conventional produce due to a lack of market, further complicating data collection. For example, in Australia approximately one third of organically produced crops and livestock is sold in the conventional market1. For some Australian products, especially meats, up to 90 percent is sold on the conventional market. Furthermore, some farmers who farm organically may not bother to become certified. There are also places (e.g. Sweden) where farming systems are subsidized in order to be managed organically but where products are not certified as organic. Finally, some land may be classified as organic starting in a particular year, although little has changed by way of management. Nonetheless, some estimates are available, usually collated from certifying bodies.
Organic agriculture has a number of distinct characteristics. These features determine the driving forces behind the growth in organic production and sales. They are:
The most notable characteristic of organic agriculture is the emphasis on the production process rather than a product itself. With a credible certification scheme, the consumer is ensured that products have been produced according to certain defined standards and are likely to be:
Organic agriculture is a process-oriented, rather than a product-oriented, production system.
These characteristics cannot be seen in the product itself. Consumers may therefore not have a good understanding of what they are buying, and may be more inclined to switch to non-organic products offering somewhat similar characteristics, such as "free range" rather than organic eggs. Future organic sales may compete with products carrying ecolabels, possibly without verification and at a reduced cost as compared to organic products.
The primary feature of all organic production methods is the restriction on the use of:
These constraints tend to require changes in the rotation away from monocultures and, in crop dominated systems, towards some livestock. Crop yields are generally lower on organic farms when compared with high input agricultural systems, especially during conversion years. For example, in Europe, cereal yields were commonly observed to be about 60-70 percent of those obtained under high external input management. Stocking rates on organic pasture also tend to be lower2. As livestock generally provides a lower return per hectare than crops, organic cereal/livestock producers are doubly disadvantaged as they have lower yields, especially during conversion, and a less favourable output mix. However, this may be compensated for by higher output prices as well as lower input costs, and many European organic farmers also receive additional taxpayer-funded subsidies.
Economic performance on organic farms in many countries and numerous crops are often found to be comparable with those on conventional farms, even without additional subsidies and sometimes even without output price premiums. For example, a multi-country study of European organic agriculture concludes that "the profits of organic farms are quite similar to those of comparable conventional farms." The authors3 duly note the usual caveats, in particular that the degree of variation within the samples is very high, highlighting the risks and opportunities available. In an earlier study, Lampkin and Padel (1994) mention similar results in a number of European countries. A Danish study using 1996 data found that all three types of organic farms (cereal, dairy and pig) were similarly or more profitable than their conventional counterparts4. In general, it is easier to convert dairy farms profitably than intensive livestock operations.
The bulk of the cost to the consumer is post farm-gate costs for all food products, conventional and organic. A loaf of bread costs the consumer ten to twenty times what the producer receives for the wheat, partly due to the processing involved (storage, handling, distribution, milling, baking and retailing). But even relatively unprocessed products such as milk are three times as expensive at the retail level. Marketing costs for organic products in particular are higher because of the need for segregation to preserve organic identity. Also, certification and the scale of distribution contribute to high costs. As organic agriculture assumes larger shares of the market, economies of scale should be able to lower these costs significantly.
It is not easy to generalize why consumers buy organic products5. Many consumers believe that the products are better for people's health or have better organoleptic qualities. These claims have proven to be difficult to verify6, although some recent reports suggest that there is a real difference in nutrient and vitamin status7. For some people, food safety seems the major concern, whereas for others, environmental aspects appear paramount.
In comparison with conventional agriculture, organic production methods are considered to have less detrimental environmental effects. This is of course not surprising as the environment is the main objective of organic agriculture. Encouraging a move towards organic agriculture would reduce environmental clean-up costs and lower the damage associated with externalities. Subsidies to organic agriculture are touted as justified because of the environmental benefits they bring. Organic agriculture is one approach that can be used to achieve environmental quality targets. Policy-makers are starting to consider how best to facilitate organic agriculture development in order to maximize environmental benefits.
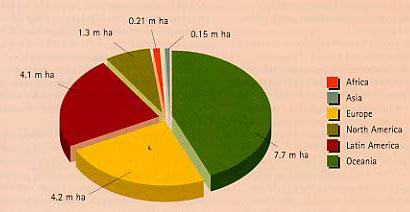
The International Federation of Organic Agricultural Movements (IFOAM) collaborated with the Foundation for Ecology and Agriculture (SOL) in Germany to obtain up-to-date estimates of certified organic land8. According to this study, the global area of land under certified organic agriculture in 2002 was 17.8 million hectares of which:
The lack of a recognized system of organic agriculture data collection worldwide has inherent weaknesses in terms of reliable information. Some unpublished data obtained by FAO in 2002 suggests that the figures above are under-estimates of certified organic lands. In fact:
Those few country examples alone suggest a global certified organic land area in excess of half a million hectares than publicly available figures.
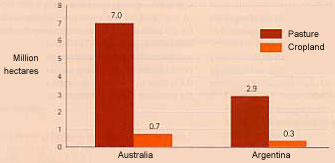
Less than half of the global 18 million hectares of certified organic land is dedicated to arable agriculture. In Australia, about 7 million ha of organic certified lands are extensive grazing lands. These lands belong to a marketing group (the Organic Beef Enterprises), which counts 30 members. One OBE member has the world's largest certified organic property (994 000 ha) as well as four other properties, totaling 3 248 290 ha13. In Argentina, 91 percent of certified organic lands (or 2.9 million ha) are natural pastures for sheep and cattle (e.g. Patagonia) and forest areas for apiculture. Also here, a single owner holds two extensive sheep grazing properties of 0.5 million ha14. In both Australia and Argentina, the extensive nature of livestock systems is the most suitable management option in dryland conditions and large farms are typical. In contrast to these huge organic animal production properties, smallholdings characterize organic arable lands (with few exceptions).
Less than half of the global 18 million hectares of certified organic land is dedicated to arable agriculture.
In the United States of America, at the end of the 1990s, well under 1 percent of crop and pastureland was certified as organic (i.e. 545000 ha15) despite a rapid expansion (23 percent per annum) of retail sales during that decade.
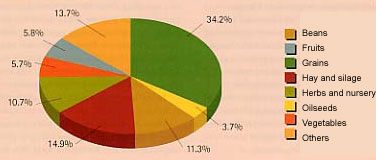
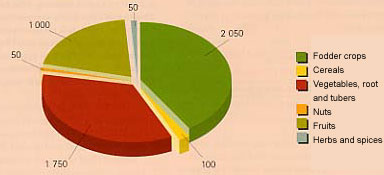
The US Department of Agriculture estimates suggest that the area of certified organic cropland in 1997 was 345 000 hectares, more than double the 1992 estimate. The most significant crops are wheat (50 000 ha), corn (17 000 ha), barley (12 000 ha) and oats (12 000 ha). Overall, organic grains showed a 23 percent annual growth in the two years since the previous survey in 1995. However, these crops comprise only 0.2 percent of the total United States cropped area in grains. In terms of inroads into conventional production, the most significant crops are spelt (37 percent of the conventional area), buckwheat (30 percent), herbs (37 percent) and mixed vegetables on plots of less than 2 ha (37 percent).
The area of organic pasture and rangeland in the United States amounted to 200 000 hectares in 1997, on par with 1992 but an 80 percent increase on 1995. Around one third of the certified organic area in 1997 was in Alaska and almost half was in Colorado, where productivity may not be as high as in other regions. There is little relationship between livestock numbers and certified organic area. Beef cattle numbers fell from 6 796 in 1992 to 4 429 in 1997. The large increases since 1992 have been in dairy cows (up from 2 265 to 12 897) and layer hens (44 000 to 538 000). Adding crop, pasture and rangeland together gives a total area under certified organic production, in 1997, of around 0.2 percent of United States agricultural land16.
Data on certified organic agricultural land use in the European Union indicates an average annual increase of 24.5 percent in the five years to the end of 200017. The data revealed considerable variation across countries in the European Union, with the Nordic countries (Denmark, Finland and Sweden) and Austria utilising in excess of 5 percent of arable land. Greece, Portugal and Spain show high growth rates from a low base. The fastest contribution to total European Union growth in recent years has come from Italy and the United Kingdom, as these countries have a much greater land base than most of the northern European Union countries. Changes in government payments to organic farmers raised organic production significantly in these countries.
Table 1: Certified organic land use in the European Union, 2000 | |||
Country |
Land use (ha) |
Share of total agricultural area |
Average annual growth rates over five years |
Austria |
267 000 |
7.74 |
-4 |
Belgium |
20 265 |
1.52 |
43 |
Denmark |
165 258 |
6.09 |
32 |
Finland |
147 423 |
5.66 |
27 |
France |
370 000 |
1.22 |
26 |
Germany |
546 023 |
3.15 |
12 |
Greece |
24 800 |
0.43 |
60 |
Ireland |
32 355 |
0.73 |
21 |
Italy |
1 040 377 |
6.02 |
38 |
Luxembourg |
1 030 |
0.81 |
13 |
Netherlands |
27 820 |
1.40 |
17 |
Portugal |
50 000 |
1.26 |
36 |
Spain |
380 920 |
1.52 |
74 |
Sweden |
171 682 |
4.99 |
16 |
United Kingdom |
500 000 |
3.15 |
59 |
European Union |
3 744 953 |
2.76 |
24.5 |
Source: Organic Centre Wales | |||
There is also a new category of organic farmers: subsidy farmers. In countries such as Austria, Finland, Italy and Sweden a high proportion of the organic land is managed by farmers that do not sell their products as organic. For example, in Sweden, the organically managed land represents 14 percent of total agricultural lands. However, only 7 percent of this area is certified organic. Sweden is the only country in the European Union where organic farmers can receive subsidies without being certified as organic18.
In Japan, according to an undated International Trade Center report, the area of organic production in 2000 amounted to a mere 1 000 ha, just 0.02 percent of the total area under production. Another estimate suggests 5 000 hectares19. These low estimates are consistent with estimates of imports accounting for 80-90 percent of market share.
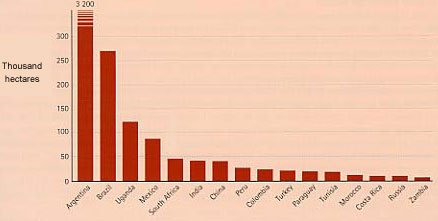
ITC20 reports that approximately one hundred developing countries produce certified organic products in commercial quantities. Land area under organic management in Africa, Asia and Latin America is currently small but increasing rapidly. A prime example is Argentina, where organic production grew from 231 000 ha in 1997 to 3 200 000 ha in 2001, representing a growth of the average sale of organic products of 90 percent per year21. Likewise, land under certified organic management in Africa is expanding. The largest areas are in Uganda (122 000 ha)22 and South Africa (45 000 ha)23.
Other certified organic lands in developing countries include: Brazil (270 000 ha), Mexico (86 000 ha), India (41 000 ha), China (40 000 ha), Peru (27 000 ha), Colombia (23 000 ha), Turkey (21 000 ha), Paraguay (19 000 ha), Tunisia (18 000 ha), Morocco (12 000 ha), Costa Rica (10 000 ha), Russia (10 000 ha) and Zambia (6 700 ha)24.
In the absence of data on production, perhaps the best data to judge the size and growth of the organic market are retail sales. ITC has estimated retail sales of organic foods and beverages in the largest markets at almost $16 billion in 2000, with $7 billion in Europe and $8 billion in the United States (see Table 2).
Table 2: The international market for organic food and beverages | |||
Country |
Retail sales 2000 (US$ m) |
Market share (%) |
Expected medium term |
Germany |
2 200-2 400 |
1.25-1.5 |
10-15 |
United Kingdom |
1 000-1 050 |
1.0 |
25-30 |
Italy |
1 000-1 050 |
1.0 |
15-20 |
France |
750-800 |
1.0 |
15-20 |
Switzerland |
425-450 |
2.0-2.5 |
15-20 |
Denmark |
350-375 |
2.5-3.0 |
10-15 |
Austria |
250-300 |
2.0 |
10-15 |
The Netherlands |
225-275 |
0.75-1.0 |
10-20 |
Sweden |
125-150 |
1 |
20-25 |
Other Europe |
300-400 |
- |
- |
Sub-Total (Europe) |
6 625-7 250 |
- |
- |
United States |
8 000 |
1.5 |
15-20 |
Japan |
300* |
- |
15-20 |
Australia |
170 |
- |
- |
New Zealand |
59 |
- |
- |
Argentina |
20 |
- |
- |
China |
12 |
- |
- |
Taiwan |
10 |
- |
- |
Philippines |
6 |
- |
- |
Total |
15 202-15 827 |
1.0 |
15-20** |
Source: ITC 2001, US Department of Agriculture 2000, and own calculations. | |||
The Japanese market is dominated by imports, with perhaps 80 to 90 percent of the market supplied from overseas. The US Department of Agriculture reports that organic sales in Japan reached $3.2 billion in 2000 but perhaps only ten percent of the market, $300 million, was truly organic25. The market appears to be growing strongly (15 percent) from a low base, although some exporters report confusion in the market since the introduction of the Japan Organic Standards in 2001 and a 90 percent fall in organic exports to Japan. It appears some retailers found continuity of supply a problem with the higher standards and dispensed with organic sales altogether, choosing instead to focus on "chemical-free" products. Many of these had previously been labelled as "organic" and, after the introduction of the standards, were re-labelled and promoted as "green"26. As a further barrier, organic fruit imported into Japan risks being randomly fumigated. If this occurs, it can no longer be sold as organic. Such impediments limit development of the organic market in Japan.
ITC has estimated retail sales of organic foods and beverages in the largest markets at almost $16 billion in 2000, with $7 billion in Europe and $8 billion in the United States.
The United States of America, the world's largest single market worth US$8 billion in 2000, expects a strong growth in organic retail sales, perhaps reaching $20 billion in 2005. The current estimate represents growth of 23 percent per year over the previous ten years. The growth in recent years is attributed to concerns about genetically modified organisms and supermarkets adding organic lines to their shelves27.
There is some evidence that organic premiums in the United States are as high as in Europe. Premiums of 100 percent for several major fruits and vegetables and milk products were consistently observed throughout the 1990s. Kortbetch-Olesen, 2002, however, suggests consumer premiums are generally within the range of 10-20 percent, although exporters may occasionally receive 100 percent premiums if supplies are short. In the United States markets, consumers appear more concerned about the environment than is the case in Europe, where food safety and health seems more of an issue28. The US Department of Agriculture predicts organic agriculture will remain an expanding sector for some time. In contrast to Europe, in the past the US taxpayer has not subsidized organic growers specifically, although some states provide financial assistance with certification. This is likely to change with the US 2002 Farm Bill, which provides for nation-wide organic certification cost-share assistance.
In the European Union, food retailing chains or processing companies are active in increasing the supply of organic products in order to improve their competitiveness by responding to growing consumer demand for organic food. Wholesalers or processors offer producers long-term contracts which guarantee a price premium for organic products over several years. Price premiums for organic commodities are 20 percent lower in countries with a high involvement of general food retailers (e.g. Austria, Denmark, Switzerland), mainly due to lower distribution costs. In 2000, The European Union was a net importer of organic cereals, oilseeds, vegetables and meat and a net exporter of organic olives, wine and dairy products. Price premiums varied, in 2000, from 31 percent for organic red table wine up to 113 percent for organic chicken. Countries (e.g. Denmark, Sweden) which have the highest market share by volume for organic products have a common national label and consumer recognition of this label29.
The role of big food industries in boosting organic agriculture is further illustrated by the New Zealand dairy sector. The entry of New Zealand Milk Products, Fonterra's manufacturing and ingredients marketing division, in September 2002, into processing organic milk to produce organic cheddar cheeses will change the composition and quantity of organic exports. The decision to enter the organic market has come after extensive market evaluation to ensure that market premiums of at least 20 percent are sustainable for the long-term, in order to match the higher costs structure (of both on-farm production and processing)30.
In most developing countries, there are no markets for certified organic products. In some countries, however, organic urban markets are developing (e.g. Argentina, Brazil, China, Egypt, Jordan). Expanding demand for organic foods in developed countries is expected to benefit developing country exports, via new market opportunities and price premiums, especially for tropical and out-of-season products. Developing country exporters, however, will need to meet the production and certification of those in developed countries and overcome consumer preferences for local production.
In spite of high growth rates, sales of organic agricultural products in industrialized countries in 2000 are estimated at less than 2 percent of total retail food sales. However, in particular countries and for particular products the market share of organic agricultural products can be appreciably larger. Organic horticulture products in British Columbia, Canada, occupy 8.7 percent of commercial sales31. Organic food sales in Denmark occupied 3 percent of the market. In Germany individual commodities such as organic milk products had over 10 percent market share and organic baby foods 80-90 percent32. Organic coffee accounts for 0.2 percent of world coffee consumption and up to 0.5 percent of the United States and European Union coffee markets33.
In spite of the positive growth rates listed in Table 2, organic sales have stalled in some markets or for some products in countries which have previously experienced sustained growth for several years (e.g. Austria, Denmark, the Netherlands and Switzerland)34. This indicates that markets do not expand continuously and may reverse due to changes in supply raising or lowering prices, policies and promotion effects, or plain fickleness on the part of buyers. Clearly, different markets are being driven by different factors.
Growth of organic vegetable consumption flattened out in the Netherlands in 1997, yet doubled in Belgium, Greece and Switzerland35. Cereal sales also fell in the Netherlands from 1993 to 199736 while growth continued strongly in Finland. In the United States, the organic sector grew rapidly between 1972 and 1975, collapsed, and began to slowly grow again between 1978 and 1981. Between 1981 and 1983, the United States organic sector was not exempt from the chain of bankruptcies that affected the whole agriculture sector. Combined to USDA's unfavourable policy towards organic agriculture, the infrastructure for producing and marketing organic commodities took almost the entire decade to be rebuilt to the 1980 levels.
There seems no obvious relationship between share of organic production as measured in area under organic management and the share of the organic market, in Europe at least37. Market shares for milk products vary tenfold between Sweden (2-3 percent) and Finland (0.2-0.3 percent), yet the share of land under organic management is similar.
ITC reports that the "organic market transparency is far from optimal": there is need for data compiled over several years in order to identify growing markets and forecast market development.
As markets mature, it is reasonable to expect information to flow quickly through the markets, implying that producers, distributors and consumers respond rapidly to changes. This is evidenced by the absence of large price shocks and of regional price differences between markets. For storable or easily transportable commodities, such as wheat and rice, one would expect relatively similar prices across the single market of Europe. In the organic sector, this seems to hold true for milk products, with premiums across Europe of around 20-30 percent, but not so for the other major products.
As the organic market matures, it should become more efficient. Oversupply of organic products cannot be absorbed by markets unless all market actors work together to benefit from the economies of scale. Larger volumes of organic products should lead to a lowering of the organic premium, in particular by reducing transport costs and the marketing margin.
As the organic market matures, it should become more efficient. Oversupply of organic products cannot be absorbed by markets unless all market actors work together to benefit from the economies of scale.
Marketing margins represent a stumbling block to future rapid expansion of the organic food sector. Traditionally, organic products were sold through alternative channels, that is, farm-to-home deliveries, farm gates, open-air markets, specialty and health food stores rather than supermarkets. Some consumers enjoyed the feeling of obtaining their food directly from the producers, almost as if they had grown it themselves, and producers had opportunities to capture some of the marketing margins.
With increased distance between producers and consumers and the entry of traders and retailers in the organic sector, organic marketing margins raised. There are of course reasons for the high margins. Margins are payments for storage, transport, handling, packaging, processing and insurance. With organic producers comprising a small proportion of the agricultural industry, individual producers are dispersed, adding to the costs of transport. Storage may be more expensive without pesticides. The need for segregation may increase costs of handling and require individual packaging and labelling. Sometimes the absence of infrastructure (mills that could maintain segregation between conventional and organic products) meant producers had to perform some of these handling functions themselves.
There appears to be significant scope for a reduction in marketing costs as the organic market grows and matures. Economies of scale should reduce these costs to near the margins for conventional products. If marketing costs could be reduced to conventional levels, additional costs of production of 10-20 percent, perhaps even 50 percent, would almost be unnoticed by consumers. This could result in a rapid expansion of organic market share.
For example, conventional produce for which the farmer receives US$100 is sold to the final consumer for US$200. Organic premiums of 25 and 20 percent for the producer and consumer respectively imply that the organic producers are receiving US$125 (=US$100*125 percent) and the organic consumers paying US$240 (=US$200*120 percent). Hence, the organic marketing margin is US$115 (that is, US$240-125) compared with the conventional margin of US$100 (that is, US$200-100). Where the marketing margins are high, for products with a high degree of processing for example, the retail premium should be relatively low. This is the case with Danish cereals (Table 3). Where the retail premium is zero, the extra production costs are absorbed before getting to the consumer.
Table 3: Producer and retail premiums in Denmark, 1997-1998 | ||
Organic product |
Producer premium (%) |
Retail premium (%) |
Vegetables |
25-50 |
20-50 |
Cereals |
60-70 |
0-20 |
Dairy products |
20-25 |
20-30 |
Potatoes |
25-50 |
20-50 |
Fruit |
>100 |
50-100 |
Source: Michelsen et al., | ||
Consumers of organic produce have traditionally expressed a preference for minimally processed foods, and organic standards have reflected this to some extent, encouraging minimal levels of processing. To date, the share of processed products and the degree of processing is rather low, with perhaps dairy products, beverages and cereals the exceptions. This low level of processing can be attributed to traditional values as to what organic is, and concerns about the need for, or the absence of, additives to preserve the product.
Limited organic food processing constrains the range of products that can be sold. As the organic industry develops and moves to mainstream markets, there is pressure from some producers and consumers to increase the level of processing. The development of supermarkets, often with vertically integrated systems from producer to consumer, has increased the scope for processed organic foods. These entities are more likely to seek raw materials from abroad if this is found to be advantageous. There is an increasing trade in bulk products from developing countries to developed countries for further processing. Higher degrees of processing means that for many organic products, such as fruit and vegetables, the superficial blemishes are less important.
This trend towards industrialization of organic agriculture is of course resisted by many in the organic community who see it as a move away from traditional values. The size and nature of the certified organic market in the future depends somewhat on how this issue is resolved.
Although there are no official data on trade in organic products, evidence suggests that, with demand outstripping production, trade in organic products in developed countries is relatively significant.
Much of the organic trade occurs intra-European Union and intra-NAFTA countries. Much of the inter-continental organic trade is between the United States and Europe. About one third of the United States organic production is exported, mainly to Canada, Europe and Japan. As already seen, 80-90 percent of organic produce consumed in Japan is imported. About 70 percent of the United Kingdom consumption is imported, mainly from other European Union members.
Increasingly, developing countries are managing to meet the necessary standards and supply tropical and out-of-season products. Export markets are the major outlet for many developing countries' organic producers, given the small size of local markets. Egypt and Morocco have the advantage of proximity to the rapidly expanding European market that seeks fresh products such as oranges all year round. Argentina has third-country status with the European Union, reducing the costs of re-certification and inspection. China has the potential to be a key developing country exporter, with a large agricultural area, low labour costs and proximity to the Japanese market in particular. In future, countries joining the European Union will obviously have increased opportunities to export to current members. Chile is increasing its export of counter-seasonal horticulture products to North America.
Increasingly, developing countries are managing to meet the necessary standards and supply tropical and out-of-season products.
In terms of market access, organic products do not per se receive preferential access over conventional products, and there are significant tariffs (of 100 percent or more) on many agricultural products in most developed countries. However, many agricultural tariffs have a specific component (that is US$/t) so high-value goods face a lower percentage tariff. For example, imports of rice into Japan attract a duty of 402 yen (US$3.07) per kg. In percentage terms, this represents a higher duty on conventional rice compared with the higher-priced organic rice. As a result, such specific tariffs favour the import of organic products.
Since 1995, many agricultural products are imported under tariff rate quotas, with in-quota imports attracting a nominal tariff of perhaps 5 percent while imports outside the quota may face tariffs of 50 or 100 percent or more. At these levels, the tariffs may actually prevent any over-quota imports from coming in, which is often the intention. Quota restrictions such as these should favour high-value products, such as organic goods. This is because the quotas are based on physical quantities, and a greater value of exports can be supplied if the per unit value is higher.
However, what actually happens depends on how the quotas are administered. Many are allocated on a historical basis to countries, which have exported in the past. This makes it difficult for countries without a history of exports to break into the market. The second common method is first-come-first-served. This means that quota is allocated to those who ask in sequence. This favours countries with the ability to export early in the accounting period. It is not clear whether this favours organic exporters or not. Therefore, changes in the way in which imports are regulated may affect different crops and different countries in different ways, some working in favour of organic producers, some against.
Annual growth of organic markets will be around 20 percent in the medium term.
1 Wynen, 2002.
2 Offermann and Nieberg, 1999.
3 Offermann and Nieberg, 1999.
4 Wynen, 1998.
5 See for example Lockie, et al., 2001.
6 Stolze, et al., 2000.
7 Soil Association, 2001; Worthington, 2001.
8 Yussefi and Willer, 2002.
9 SENASA in Montenegro, 2002.
10 Charles Walaga (pers. comm.).
11 Gunnar Rundgren (pers. comm.).
12 Ministry of Agriculture, India (pers. comm.).
13 Tim Marshall (pers. comm.).
14 Laura Montenegro (pers. comm.).
15 USDA data reported in ITC, 2002. SOL reports a total US organic lands of 900 000 ha in 2002. Actual data for organic agriculture (2000-2001) will be released by USDA's Economic Research Service in October 2002.
16 Greene, 2001.
17 Organic Centre Wales, 2002.
18 The Organic Standards, July 2002.
19 Yussefi and Willer, 2002.
20 ITC, 1998.
21 Montenegro, 2002.
22 Charles Walaga (pers. comm.).
23 Gunnar Rundgren (pers. comm.).
24 With the exception of Brazil and India, these figures are derived from Yussefi and Willer, 2002.
25 USDA, 2000.
26 May, 2001.
27 ITC, 2002.
28 Michelsen et al., 1999.
29 Hamm, Gronefeld and Halpin, 2002.
30 US/FAS, 2002.
31 Macey, 2002.
32 Bernward Geier (pers. comm.).
33 Vieira, 2001.
34 Kortbech-Olesen, 2002.
35 Michelsen et al., 1999.
36 Data from the Netherlands should be interpreted with care, as many products are simply re-exported.
37 Michelsen et al., 1999.