Professor and Research Director
Centre for
Fisheries Economics
Institute for Research in Economics and Business
Administration
Breiviken 2
N-5045
Bergen
Norway
Tel: + 47 55 95 94 03
(office)
E-Mail: [email protected]
Acknowledgement
This article is based on “International Management Strategies for a Migratory Fish Stock: A Bio-Economic Simulation Model of the Norwegian Spring-Spawning Herring Fishery” by T. Bjørndal, D. V. Gordon, V. Kaitala and M. Lindroos, Discussion Paper No. 15/02, Centre for Fisheries Economics, Institute for Research in Economics and Business Administration, Bergen, 2002. I also thank Mr. Sigmund Engesæter, Director General, Directorate of Fisheries, for his kind assistance.
I. INTRODUCTION
The Norwegian spring-spawning herring (Clupea harengus) stock is the most abundant fish species in the North Atlantic (Bjørndal et al., 1998). The fishery is important for employment and revenue in many countries particularly Norway, which records the largest annual harvest. Other nations, Iceland, Russia, Faroe Islands and some member countries of the EU, also harvest this important fish stock. The introduction in the early 1960s of new fish harvesting technology as well as new fish finding equipment increased the efficiency and ability of the different national fleets to harvest the herring stock. The technological advancements in harvesting and finding fish combined with open access management for both coastal states and the high seas fishery allowed for substantial increases in catch levels and resulted in a collapse of the stock of spring-spawning herring by the end of the 1960s. A fishing moratorium was imposed in 1970 for the purpose of restoring the spring-spawning stock. However, it took more than 20 years for the stock to reach the Minimum Biological Acceptable Level (MBL) and only in the 1990's has the stock reached a point where Total Allowable Catch (TAC) levels can be increased.
The Norwegian spring-spawning herring fishery represents a serious challenge for international fisheries management if the consequences of open access are to be avoided. The task is made more complicated by the migratory behaviour of the species. If the stock of fish is abundant, an international migratory cycle is maintained that extends from Norwegian coastal waters, to international waters of the North Atlantic and to the Exclusive Economic Zones (EEZs) of the EU, the Faroe Islands and Iceland. While the stock is in an EEZ the authority for fisheries management lies with the individual country. On the high seas, the stock is open for harvesting by many fishing nations. If the stock is in a depleted state, as it was in the late 1960s, migratory pressures are removed and the species remains solely in Norwegian coastal waters and under Norwegian fisheries management jurisdiction. Consequently, Norway has a pivotal role in deciding fisheries management policies for the spring-spawning stock. By keeping the stock in a non-migratory state, it is possible for Norway to maintain sole jurisdiction over the fishery. The benefits, however, in terms of revenue, employment, etc. from such a restrictive policy may be small compared to what could be achieved with an abundant migratory fish stock under co-operative international fisheries management.
The purpose of this paper is to evaluate the consequences of alternative management strategies for the Norwegian spring-spawning herring fishery in light of the straddling nature of the stock. The harvesting strategy for three national fleets that fish the Norwegian spring-spawning herring, Norway, Iceland and the European Union, are considered. The fleets are differentiated by cost and harvest efficiency. For each management alternative evaluated, the consequences for both the biomass and the net profitability of the different fleets are simulated.
Five alternative fisheries management strategies are evaluated. Open access is the base case showing the cycle of stock collapse and eventual recovery. The second case is defined by imposing a simple regulatory scheme of complete fishery closure on the open access case as the stock reaches critically low levels. Third, the stock is restricted to a depleted non-migratory state, remaining only in Norwegian waters and solely under Norwegian fishery jurisdiction. The fourth case investigates the consequences of monopoly control for Norway over an abundant migratory fish stock. In this case, side payments (rather than catch levels) are allocated to other states allowing Norway to maintain monopoly control. The last case (cartel) allows for an abundant migratory fish stock under international fisheries management, where each participating state receives a share of the total catch.
II. THE NORWEGIAN SPRING-SPAWNING HERRING FISHERY
In the 1950´s and the 1960s, Norwegian spring-spawning herring (Clupea harengus) was a major commercial species, harvested by vessels from Norway, Iceland, Faroe Islands, the former Soviet Union and several European nations. During this period, the fishable component of the Norwegian spring-spawning herring stock is believed to have measured about 10 million metric tonnes. However, during this period the stock was subjected to heavy exploitation by several European nations especially Norway, Iceland and the former Soviet Union, employing new and substantially more effective fishing technology. The annual harvest peaked at 2 million metric tonnes in 1966. By this time, however, the stock was in serious decline and a complete stock collapse occurred by the end of the decade. Finally, with catch levels declining to practically nothing, in 1970, a fishing moratorium was declared.
The migratory pattern and number of components to the stock changed between 1950 and 1970. In the 1950´s and early 1960s, adults would spawn off the south-central coast of western Norway (near Møre) from February through March. The adults would migrate west and south-west through international waters toward Iceland (April and May), spending the summer (June through August) in an area north of Iceland. In September the adults would migrate south to a wintering area east of Iceland before returning to western Norway to spawn. Juveniles, including the recently spawned or ''zero cohort'' would migrate north, but remain in Norwegian waters until sexually mature, around age four or five, when they would join the adult migratory pattern.
In the mid-1960´s, a second, more northerly stock component appeared. This component would spawn south of the Lofoten Islands (north of Møre) with the adults migrating north-west into the north Norwegian Sea, then north-east into the Barents Sea, and finally south to wintering grounds west of the Lofoten Islands before moving south to spawn. By 1966 the northern component was the largest of the two major herring stocks. Because of over fishing and poor recruitment, the spawning biomass of both components fell precipitously in 1968 and 1969, leading to near extinction by 1972. In its depleted state, the adult population ceased migration and both adults and juveniles remained in Norwegian waters year round.
Recruitment remained weak throughout the 1970's and it was not until the strong year class of 1983 joined the adult population in 1986 that the stock began to recover. The main component of the stock has re-established itself on the spawning grounds off Møre. Now, after spawning, the adult herring begin a westerly migration passing through the EEZs of the EU, Faroe Islands, Iceland and through international waters called the ''Ocean Loop'' on their way to the summer feeding area near Jan Mayen Island. In the 1990´s, the herring have followed the southern edge of the cold East Iceland stream, north and north-easterly, to winter in the fjords of northern Norway.
The migration pattern of the Norwegian spring-spawning herring takes on importance since, as a straddling stock the herring are exposed to territorial and possibly distant water fleets with strong incentives to harvest the population before it moves elsewhere (Bjørndal et al., 1998). If a co-operative management policy, with an equitable distribution of harvest, cannot be agreed upon, Norway, Iceland, Faroe Islands, countries of the EU, Russia and possibly distant water vessels fishing in the Ocean Loop, may resort to ‘strategic over fishing’ that could jeopardise continued recovery of the stock.
Until recently the situation was quite chaotic. There was no comprehensive regional agreement about the utilisation of the stock. It followed that Norway, Russia, Iceland and Faroe Islands were able to harvest the stock at will within their own jurisdictions. Moreover, in international waters the stock could be harvested legally by any interested fishing nation.
In 1995, the Advisory Committee on Fishery Management (ACFM) recommended a total allowable catch (TAC) for the Norwegian spring spawning herring of 513 000 METRIC TONNES. However, Norway announced an individual TAC of 650 000 metric tonnes of which 100 000 metric tonnes would be allocated to Russian vessels. Iceland and Faroe Islands followed suit and announced their own combined TAC of 250 000 metric tonnes. In total, the collective harvest of Norway, Russia, Iceland, Faroe Island and the EU was approximately 902 000 metric tonnes of herring, almost twice the quantity recommended by ACFM (Bjørndal et al., 1998). Nevertheless, in spite of these high catch levels, the herring spawning stock continued to increase.
There was, however, some progress towards co-operation. In 1996, Norway, Russia, Iceland and Faroe Islands reached an agreement for a combined TAC. The agreement was reached by increasing the quota levels for each country and setting a total maximum limit of 1 267 000 metric tonnes. Nevertheless, the European Union did not take part in a TAC commitment and continued fishing at near capacity. In 1997, the EU became a signatory to an agreement limiting the maximum total catch to 1 498 000 metric tonnes. The significance of this agreement is that the EU in a commitment to international fisheries co-operation agreed to reduce their total catch levels from the previous period, whereas, the four other member countries again increased individual TACs (Bjørndal et al., 1998). Notwithstanding, the stock of spring-spawning herring showed great robustness and continued to increase.
The countries involved agreed to continue co-operation and in 1998 the total TAC was somewhat lower than 1997 at 1,3 million metric tonnes. The new quotas for 1998 are distributed such that each country receives approximately 13 percent less share than for 1997. There are also bilateral arrangements that allow harvesting in the EEZ of other member countries. For example, for fishing spring-spawning herring Russia, the EU, Iceland and Faroe Islands are all granted limited access to Norwegian fishing waters and vice versa. For 1999, the TAC was 1.3 million metric tonnes, for 2000 1.25 million metric tonnes, and for 2001 0.85 million metric tonnes.
In an international context, the intergovernmental UN Conference on Highly Migratory and Straddling Stocks (1993-1995) dealt with the management of fishery resources found both within the EEZs of coastal states and the adjacent high seas. A number of suggestions had been proposed to solve the contradictions between the rights and duties of the coastal states and the distant water fishing nations. A consensus was arrived at that the management of straddling and highly migratory fish stocks is to be carried out through regional fisheries management organisations. The members in a regional fishery organisation are coastal states and distant water fishing nations with a “real” interest in the fishery.
The international waters in the Norwegian Sea (the Ocean Loophole) is an important example of the problems addressed by the UN Conference. A number of suggestions had been proposed to solve the contradictions between the rights and duties of the coastal states and the distant water fishing nations. A consensus was arrived at, namely that the management of this stock should be based on a “two pillar” system. By this is meant that the coastal states, which constitute one pillar, agree on the management of the part of the stock that falls within their EEZs, and the Regional Fisheries Management Organisation, which for the Norwegian spring-spawning herring means the North East Atlantic Fishery Commission (NEAFC), constitutes the other pillar, providing for management of the part of the stock that is in international waters.
The recovery of the Norwegian spring-spawning stock offers the opportunity for substantial annual harvests on a sustainable basis for the benefit of all nations involved. It is clear that if the current co-operative arrangement among the countries fails and there is a return to the open access conditions of the early 1990s, this will result in increased international competition for harvest shares that will be biologically, economically and politically damaging. Eventually, this could threaten a new stock collapse for the fishery and result in substantial economic damage for all nations concerned in terms of lost revenue and employment as catch levels decline.
III. A BIO-ECONOMIC MULTI-AGENT SIMULATION MODEL
We assume that the characteristics of the international spring-spawning herring fishery can be captured in a three-agent model. The agents are defined based loosely on historical coalitions in the fishery. Norway and Russia have shown co-operation in respect to resource management and setting of quotas, and we treat these two countries as one economic agent referring to the coalition as Norway. Similarly, Iceland and Faroe Islands have co-operated in setting catch levels. As well, for these two countries the fishing grounds overlap and the harvest technology employed is similar. We will thus treat Iceland and Faroe Islands as one agent called Iceland. Several European countries, all of whom are members of the European Union (EU), also participate in the fishery using similar technology. Therefore, we will consider the EU as the third agent in the fishery.
In Norway, three different harvest technologies are employed (coastal vessel, trawler and purse seine) in the spring-spawning herring fishery (Bjørndal and Gordon, 1998). Cost of harvesting and quality of catch depends on the technology employed. However, in terms of quantity landed and harvest efficiency, purse seine is the most important vessel type. For this reason, the specification of the cost function for the Norwegian fleet used in simulation is based on the purse seine technology. As well, for consistency, the harvest cost functions for Iceland and the EU are also based on the purse seine technology. Regardless of the similar technology used in the fishery, the cost of harvesting may still vary across the national fleets. This is because even if the underlying technology is the same, certain aspects of the technology such as boat and engine size may still vary, and input prices for factors of production may be different. Moreover, individual boat quotas may vary from country to country. Even more importantly, the distance to the fishing grounds will be systematically different for the three economic agents. Based on this specification, Norway is assumed to be the most efficient harvester, followed by Iceland and then the EU.
IV. MANAGEMENT STRATEGIES FOR THE FISHERY
Five strategies are evaluated for managing the spring-spawning herring fishery. We evaluate a broad range of managerial behaviour from the competitive open access to international co-operative arrangements in managing the fishery. One important and robust result of the simulation work is that the competitive open access fishery provides lower net returns and maintains lower stock levels compared to any of the co-operative solutions investigated. However, given that for this international fishery open access has historically been the prime management tool of choice, we define this as the base case in which to compare more co-operative outcomes.
In the open access case, no restriction is placed on the harvesting strategies of the agents defined in the simulation model. We assume the objective of each fleet is to engage in harvesting for the purpose of maximising rent. In a competitive open access fishery, each fleet will continue to extend its fishing effort as long as total cost is less than total revenue. Fishing effort extended by individual fleets is measured by a fishing mortality index and is a function of harvest efficiency. (A fishing mortality index of 1.0, 0.9 and 0.6 is maintained for Norway, Iceland and the EU, respectively.) In an open access profit maximising environment, the fleets will have incentive to continue harvesting until profit or rent has been dissipated, i.e., the classical tragedy of the commons. The simulations showing harvest levels, fishing mortality, spawning stock biomass and net profitability are carried out over a 70 year period. Figure 1a, shows the harvest level for each of the three fleets and the total or aggregate harvest for the international fishery. Corresponding overtime to harvest levels, Figure 1b, 1c, and 1d graph out fishing mortality, spawning stock biomass and net present value of returns, respectively.
The simulations are based on an initial spawning stock biomass taken from mean data for catch, abundance and maturity for the actual stock of herring for the period 1993-1996. From Figure 1a and 1b, for the first few years harvest levels and fishing mortality increase and all three fleets show similar catch levels and rising profit levels. As harvesting continues the spawning stock biomass declines and this is reflected in decreased catch levels. Declining yields, however, do not diminish fishing effort because revenue continues to exceed total cost and fishing effort increases. Figure 1b shows that for all fleets total fishing effort is achieved after the initial five years of harvesting. It is worth pointing out that each fleet maintains its maximum fishing effort over the next 12 to 15-year period regardless of the declining stock biomass and catch levels. What is more, fishing effort only starts to decline after the stock biomass falls far below the safe biological level (SSB in Figure 1c) and approaches near collapse.
The reason for this excessive fishing effort in the face of serious stock decline is that in a competitive open access environment restraint on fishing effort by one fleet will only mean that another fleet will harvest the catch and, therefore, each fleet has incentive to continue fishing. This is the basic problem of the commons and is a result of the lack of well-defined property rights over the stock of fish.
Based on the economic and biological parameters of the spring-spawning herring fishery, the simulation model predicts that harvesting will continue with ever-declining catch levels until the stock collapses. After the collapse, the population dynamics (Figure 1c) shows that about 20 years are required for the stock to enter a recovery phase. A complete stock recovery even to the average 1993-1996 levels is not possible because in the open access case a positive stock response immediately initiates harvesting and the cycle, albeit at a much lower amplitude, repeats. It is interesting that in the stock recovery phase only Norway and Iceland find it profitable to expend total fishing effort to harvest. The EU shows only moderate fishing effort and fishing mortality. In Figure 1d, net profitability mirrors closely the fortunes of catch levels increasing only during the initial phase of harvesting and, thereafter, declining continuously until the stock is depleted and net profits fall to zero.
For the spring-spawning herring fishery open access competitive harvesting is inadequate to maintain a healthy biological stock and, clearly, the long-term economic benefits are minimal. However, it is interesting that within an open access regime the simple management strategy of complete fishery closure as the stock falls below the safe biological level (SSB) has substantial positive consequences for both stock and profit levels.
In Figures 2a - 2d, we show simulation results for harvest levels, fishing mortality, spawning stock biomass and net profitability, respectively, for open access harvesting with a management strategy of fishery closure. There are a number of interesting changes to the open access outcomes resulting from this simple management practise. The figures show four cycles of the simulation for this management regime. The initial cycle mirrors that of the open access until the stock decline reaches the safe biological level and closure is imposed. At this time catch levels and profits are set to zero. However, because closure is enforced prior to stock collapse and more fish are alive to spawn recovery occurs more rapidly compared to open access. Note that in Figure 2c, stock levels fall somewhat below the safe biological level, which reflects time required by the fleets to reduce fishing effort to zero. With stock recover in the second phase of the cycle harvesting resumes and profit taking occurs. The length of time with zero catch and zero profit levels is substantially reduced compared to the open access position. During the second phase, stock recovery is substantial and we observe increases in biomass two times greater than the average stock levels for the 1993-99 period. This is an important prediction from the simulation model and shows that a simple co-operative outcome of adhering to fishery closure allows for significant increases in stock size and catch levels over the simulation period. In the recovery period, Figure 2d shows an increase in profits earned especially for Norway and Iceland compared to open access. Profits appear lower in the third and forth phase of the cycle compared to the previous cycle due to discounting.
Open access with fishery closure shows great improvement in stock and profit levels over the unfettered open access regime, but it does require international co-operation in following the order for fishery closure. Norway as the pivotal and efficient harvester in the international fishery could exclude all other parties from fishing spring-spawning herring by maintaining the stock at below migratory levels and thus corralling the stock in Norwegian waters. It is estimated that a spawning stock biomass below 500 thousand tonnes will trigger non-migratory conditions. For Norway the important question is whether such a restrictive stock policy would provide sufficient benefits to make the effort worthwhile.
In Figures 3a-3d, the harvest level, fishing mortality, spawning stock biomass and net profit are shown for a 70-year simulation period for a non-migratory fish stock. The simulation period is identical with other management schemes. The economic objective characterising the harvesting process is not the simple open access behaviour of harvest as long as revenue exceeds cost, rather it is a combined objective of maximising profits and maintaining a non-migratory fish stock.
The harvesting strategy is to engage in full fishing effort (i.e., fishing mortality equal to one) increasing harvest yields and most importantly forcing the stock of fish to a non-migratory biological level. (This period of the simulation is identical to open access and, of course other economic agents are harvesting and earning profits.) After this point, the objective is to harvest at a monopoly profit maximising position subject to biological control on the level of the stock. The control allows fishing effort to reach maximum levels (i.e., fishing mortality set to one) as stocks increase and to then rapidly curtail fishing effort (i.e., fishing mortality set to 0.5) as stocks decline. By controlling fishing effort in an on/off manner, harvest and stock levels are maintained in a low amplitude cycle over time.
There are a number of advantages and disadvantages to Norway from a non-migratory management scheme. On the one hand, catch levels never fall to zero and thus there is continuous uninterrupted employment, albeit at a low level, for the Norwegian fishery. At the same time, profit levels although reduced are maintained at above zero levels. On the other hand, as shown in Figure 3d, profit levels are not substantial and net present value declines overtime (because of discounting) monotonously towards zero. Moreover, a policy of maintaining low stock levels adds another dimension of difficulty and uncertainty to the management problem in increasing the risk of complete stock collapse due to random biological occurrences. If a Norwegian objective for the fishery is to maximise the economic benefits to Norwegians, a non-migratory management scheme appears to fall far short of the benefits expected from such a potentially important resource.
One obvious result of the three management schemes evaluated thus far is that international co-operation enhances the stock level and, perhaps more importantly, the economic benefits to all parties to the fishery. We explore further the possibilities for international co-operation by investigating the consequences of using side-payments to maintain a single fleet monopoly position over an abundant migratory fish stock, and of a co-operative cartel agreement to share a total catch quota for the fishery. The two co-operative schemes are similar in that the monopoly case allocates shares of the total rent, whereas, the cartel case allocates shares of the total catch. However, the economic difference in terms of potential profit is substantial.
The monopoly case is of special interest because it allows measurement of the total potential profits that could be generated in the fishery by harvesting the stock at the most efficient level. In simulations, Norway is defined as the low-cost efficient harvester. The harvest level for the monopolist is based on a constant fishing effort/mortality rate consistent with maximising monopoly profits. It is interesting, and in anticipation of the results, that we measure total net profits generated in the monopoly case as sufficient to more than compensate the non-participating fleets at a level greater than their best opportunity in the fishery and thus making such a management scheme economically viable.
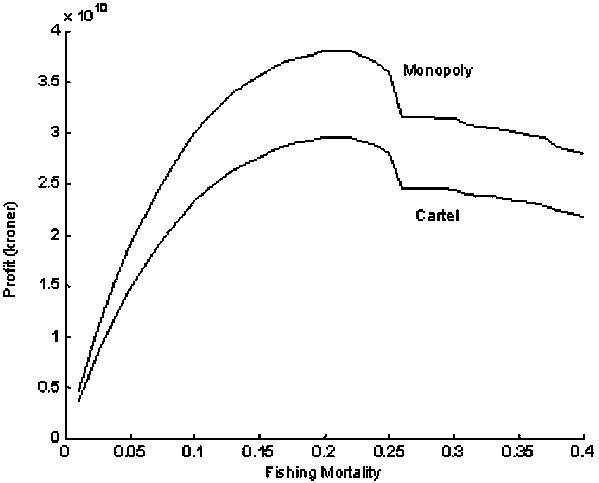
Figures 4a-4d show monopoly harvest, profit vs. fishing mortality, spawning stock biomass, and net profits, respectively. The simulations show that the monopoly output is substantially different relative to the previous management cases examined. In contrast to open access, initially both the harvest level and spawning stock biomass decline rapidly. This is caused by the monopolist setting a fishing effort at a level consist with monopoly profit maximisation. The stock of fish eventually reaches a minimum point and increases due to strong year classes entering maturity stages. The stock is allowed to increase over time because fishing mortality does not respond to the stock of fish but only to profit maximisation. As this occurs, the harvest increases steadily and eventually reaches an equilibrium position. Nominal profits respond to harvest levels, showing an initial decline and then increasing to a stable level. Of course, with discounting, Figures 4d shows nominal profit stability as a general decline in net profitability. Overtime, the spawning stock biomass reaches equilibrium at about 6.5 million tonnes within the monopoly profit maximising environment. This is not large compared to stock levels achieved in, say, open access with fishery closure, rather, it is the stability of the equilibrium overtime that distinguishes the stock effect of the monopolist from other cases investigated.
To capture the profit potential of the monopoly position requires a total commitment to international co-operation in the fishery, in terms of agreeing to share the total rent rather than share the total catch. An alternative strategy is to allocate a share of the monopoly harvest to each of the individual fleets. This allows all fleets to participate in the fishery but because the different fleets are characterised by different levels of harvest/cost efficiency, there will be a general loss in total profits earned in the fishery. The loss in potential profit between monopolist and cartel control of the fishery can be measured from the simulations.
Based on historical harvest levels Norway will receive the largest share (51 percent), then Iceland (29 percent) and the EU (20 percent). Once shares are allocated, each fleet will operate in an efficient profit maximising manner. In other words, each fleet will set a fishing effort/mortality rate to maximise profits over individual shares. This behaviour is analogous to that of the monopolist in terms of total harvest and spawning stock biomass for the fishery. Of course, the harvest and profit levels are shared among the three fleets.
In Figure 5a, the harvest level is reported for Norway, Iceland and the EU, respectively. Whereas, the corresponding profit levels for individual fleets are reported in Figure 5b. With fishing effort/mortality rate set by profit maximisation, harvest levels first decline and then rise to an equilibrium level overtime for the same reason as under monopoly behaviour. Similarly, net profits for the three fleets show that Norway earns a substantial rent based on its cost efficient harvesting levels compared to Iceland and the EU. Finally, in Figure 6, we draft out the total net profit for the monopolist position and correspondingly the cartel position. The monopolist earns the greater return over all periods. The differences in profit level at each point in time reflect the different efficiency levels across the different fleets. The interesting question is whether sufficient additional profit is earned under the monopolist position to compensate the other players to allow the monopoly position to exist?
We address this question in Table 4 where net profit levels across the five alternative management strategies are listed. Keep in mind that nominal profit is discounted at 4 percent annually over a 70-year time horizon. First, comparing open access management to open access with fishery closure, all three agents are made better off in terms of higher net profits by engaging in co-operation and adhering to fishery closures. However, it is also clear that the benefits of co-operation are not equally shared across the different fleets. Norway sees an increase of 149 percent, Iceland an increase of 106 percent but the EU measures only an increase of 43 percent relative to open access. Both Norway and Iceland clearly benefit from co-operation in the fishery, whereas co-operation for the EU is somewhat less advantageous. Nonetheless, there is ample profits earned in the fishery between Norway and Iceland to offer side payments to make it worth while for the EU to adhere to fishery closure. The alternative would be a return to open access where both Norway and Iceland would be worse off.
Second, we measure the overall net profitability of sole Norwegian jurisdiction over a non-migratory fish stock. In this case, Norway maintains complete fisheries control over the herring stock and achieves an increase in profitability of 61 percent over what could be obtained under unrestricted open access. The net benefit in excess of open access is achieved because of Norway’s substantial share of the initial abundant stock prior to stock collapse. In other words, Norway achieves substantial profits prior to stock collapse and non-migratory behaviour. Measuring benefits to Norway only after the stock reaches a non-migratory level shows this management position comparatively worse-off than the unrestricted open access position. A net present value of profit of 4.79 billion NKr. in the non-migratory case compared to 5.49 billion NKr. for open access. Nevertheless, even if the benefits of a non-migratory scheme include the initial abundant stock, Norway suffers a 65 percent decline in profit compared to open access with fishery closure. The consequences of a non-migratory herring fisheries policy can be costly to Norway in terms of lost profits. On the other hand, benefits from international co-operation with an abundant migratory fish stock can be substantial in harvest levels and net profitability.
The last scenario is to compare net profitability of the monopoly position with that of the cartel. In the cartel case, the simulation results are based on allocating harvest shares on historical catch levels for the three fleets. Table 4 shows that Norway would benefit substantially from this historical allocation showing an increase of 41 percent in net profits compared to open access with fishery closure. On the other hand, both Iceland and the EU see their net profits increase by 3 percent and 2 percent, respectively compared to open access with fishery closure. Because total profits under cartel arrangements are 25 percent higher than under open access with fishery closure, a different allocation of catch shares could be negotiated that would allow both Iceland and the EU to receive a larger share of total profit. The important question, however, is whether under monopoly harvesting in the international fishery could Iceland and the EU be sufficiently compensated to support such a position? That is, Iceland and the EU would become non-participants in the fishery but receive a share of the total rent. The simulations show that allowing for efficient cost of harvesting net profits are 28 percent higher under a monopoly compared to cartel. In other words, by international agreement to share the total rent from the fishery rather than total catch all members to the fishery can be made better off.
V. CONCLUSION
The purpose of this paper is to analyse and compare the consequences for stock levels and net profit potential of alternative management strategies for the international spring-spawning herring fishery. Five alternative management schemes are evaluated. Open access is the base case showing the cycle of stock collapse and recovery. The second case is defined by imposing a simple regulatory scheme of complete fishery closure on the open access case as the stock reaches critically low levels. Third, the stock is restricted to a depleted non-migratory state, remaining only in Norwegian waters and solely under Norwegian fishery jurisdiction. The fourth case investigates the consequences of sharing among the three agents the rents obtained from monopoly harvesting over an abundant migratory fish stock. The final case allows sharing the total catch among the three agents for an abundant migratory fish stock under international fisheries management.
Competitive open access shows increased and sustained fishing effort by all fleets while harvest levels decline. Eventually, undiminished harvest results in stock collapse and demise of the fishery. A management restriction of fishery closure on the open access as stock falls below safe biological levels has substantial positive benefits for both the stock level and potential net profits to all participates in the fishery.
Examining the possibilities for Norway to maintain sole fisheries jurisdiction over a small non-migrating stock of herring corralled in Norwegian waters shows minimal benefits in terms of net profits to the Norwegian fishery. Compared to the competitive open access fishery with closure, a non-migratory herring fishery policy leaves Norway much worse off in terms of economic benefits.
Finally, we show that either a monopoly or a cartel position with an abundant migratory fish stock can bring significant benefits to all participates in the industry. Under monopoly the largest potential profits are earned in the fishery but international agreement is required to share the rent among the non-participates that would allow the monopoly to exist. Under cartel potential profits, although smaller than monopoly, are larger than under open access with fishery closure, but requires international agreement to share the monopoly harvest level. Whether international agreement allocates shares of rent or catch levels, management co-operation in the spring-spawning herring fishery can achieve substantial economic benefits for all participates to the fishery under sustainable stock levels.
Table 1. Total Discounted Profits
Net Present Value of Profit, 4% discount rate
|
Management Regime |
Norway |
Iceland |
EU |
Sum |
|
Open Access |
5.49a |
3.89 |
1.31 |
10.65 |
|
Open Access with Fishery Closure |
13.72 |
8.04 |
1.88 |
23.64 |
|
Non-Migration |
8.85 |
- |
- |
8.85 |
|
Cartel |
19.39 |
8.26 |
1.92 |
29.57 |
|
Monopoly |
38.04 |
- |
- |
38.04 |
a all values are 10 to power 9
Figure 1a. Harvest Levels, Open Access
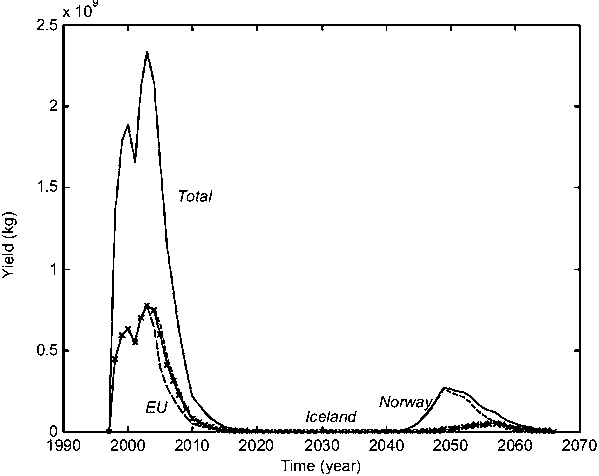
Figure 1b. Fishing Mortality, Open Access
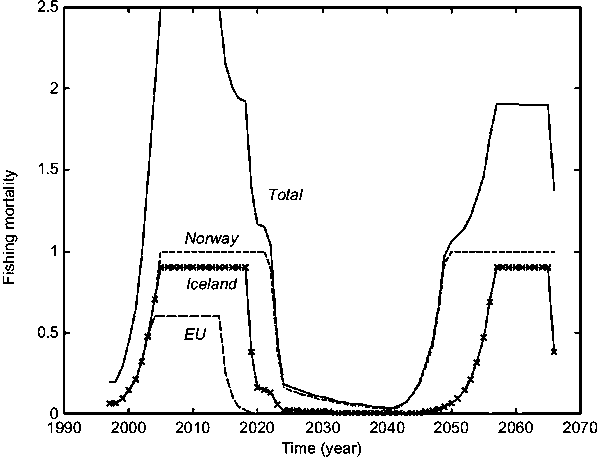
Figure 1c. Spawning Stock Biomass, Open Access
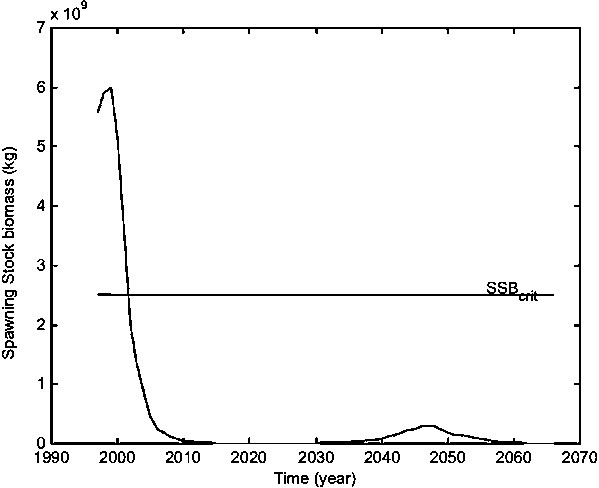
Figure 1d. Profit, net present value, Open Access
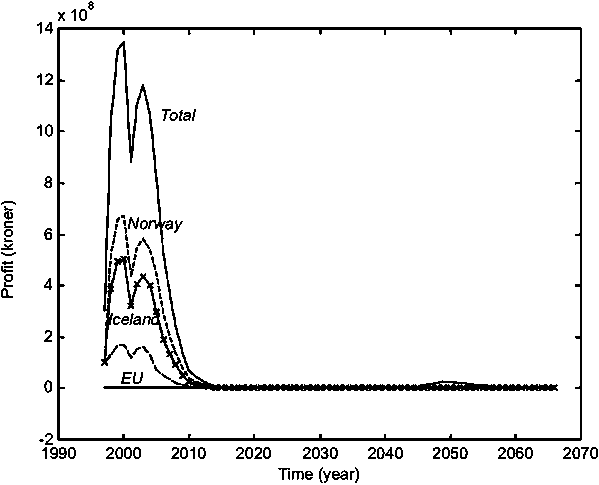
Figure 2a. Harvest Levels, Open Access with Fishery Closure
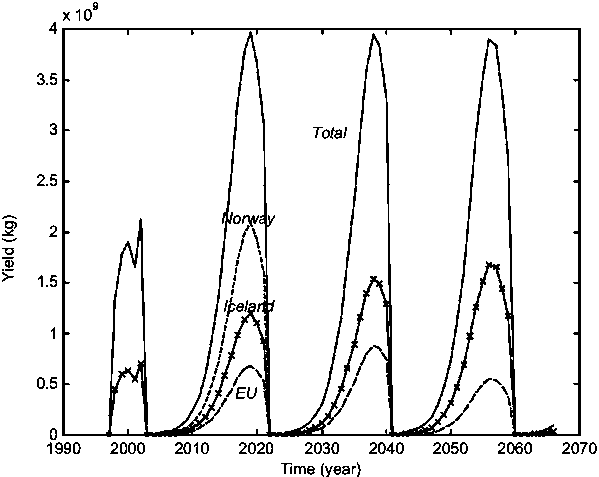
Figure 2b. Fishing Mortality, Open Access with Fishery Closure
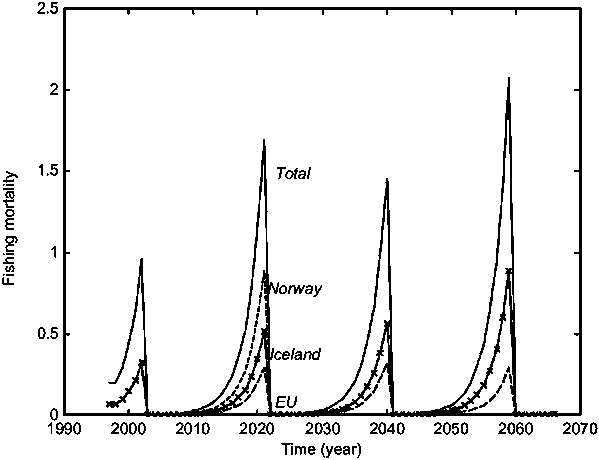
Figure 2c. Spawning Stock Biomass, Open Access with Fishery Closure
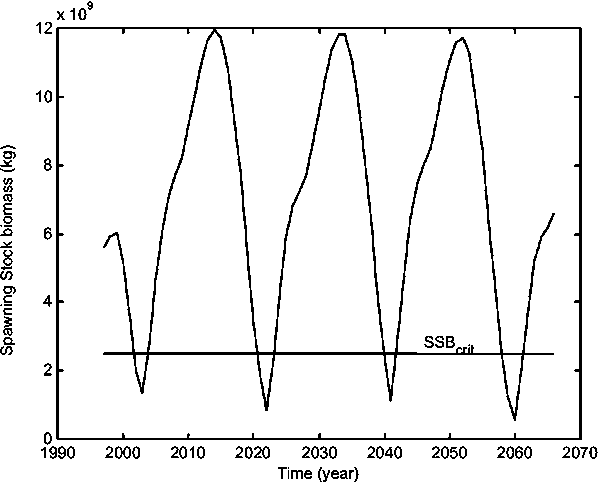
Figure 2d. Profit, net present value, Open Access with Fishery Closure
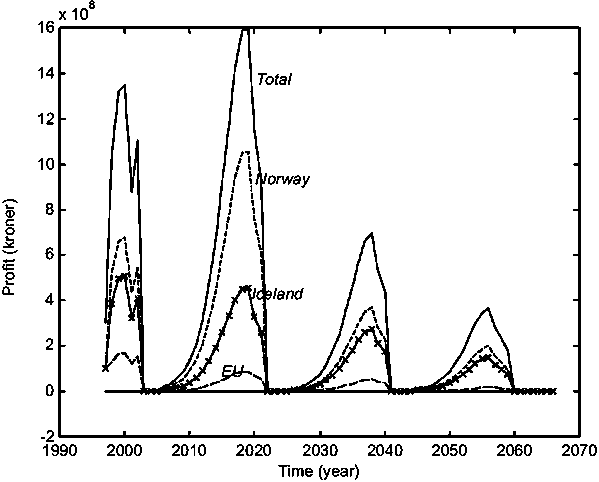
Figure 3a. Harvest Levels, Non - Migration
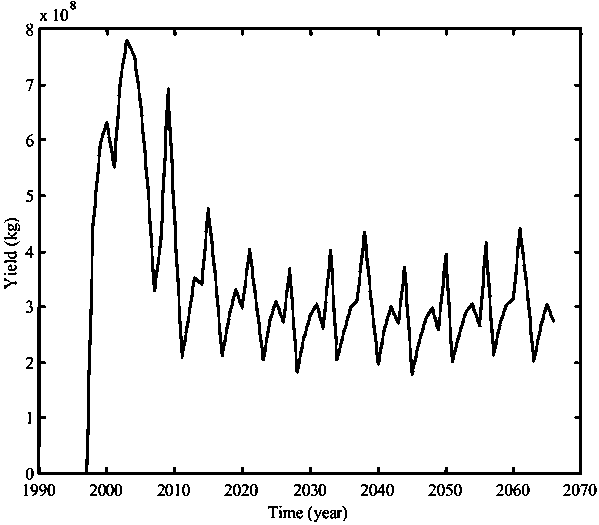
Figure 3b. Fishing Mortality, Non - Migration
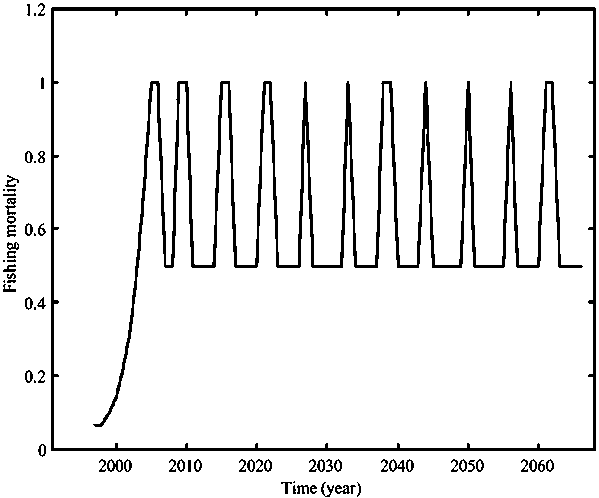
Figure 3c. Spawning Stock Biomass, Non - Migration
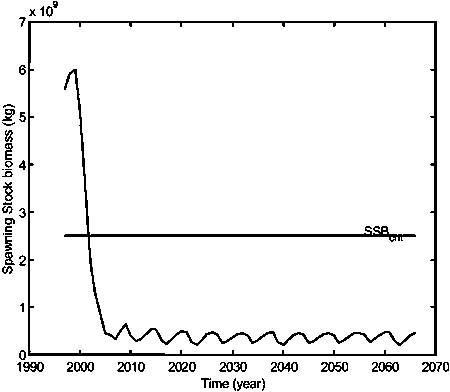
Figure 3d. Profit, net present value, Non - Migration
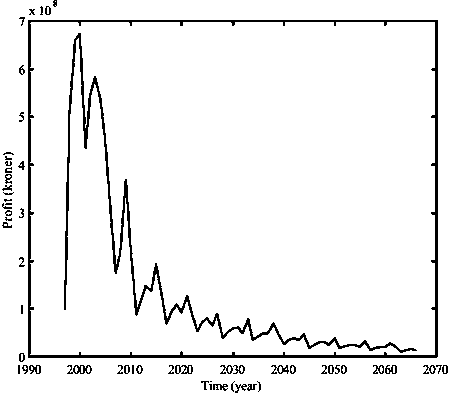
Figure 4a. Monopoly, Harvest
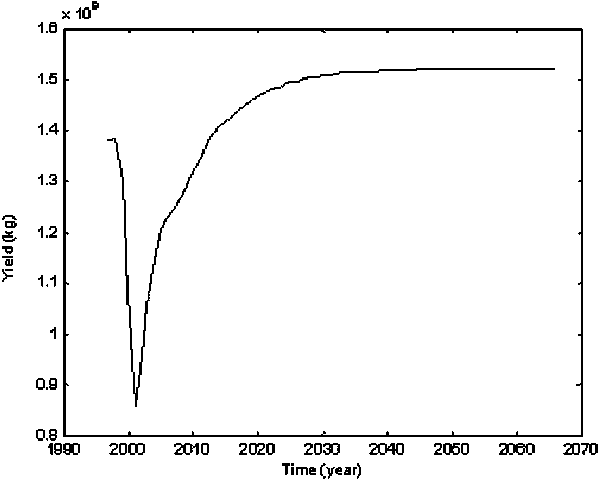
Figure 4b. Monopoly Profit vs Fishing Mortality
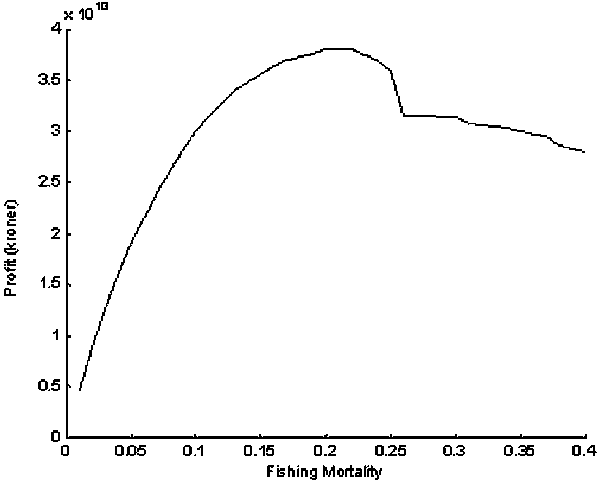
Figure 4c. Monopoly, Spawning Stock Biomass
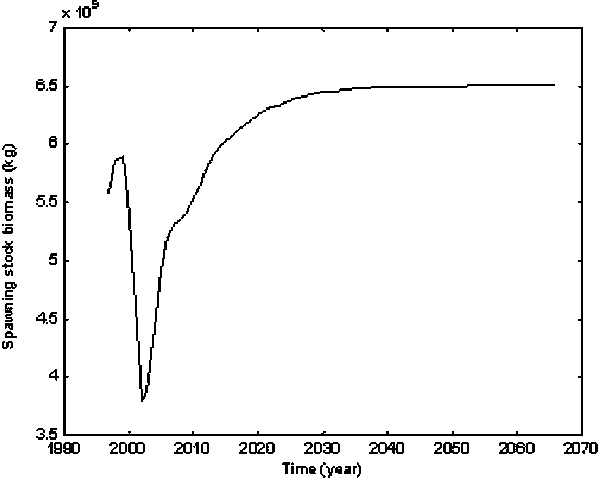
Figure 4d. Monopoly, Profit
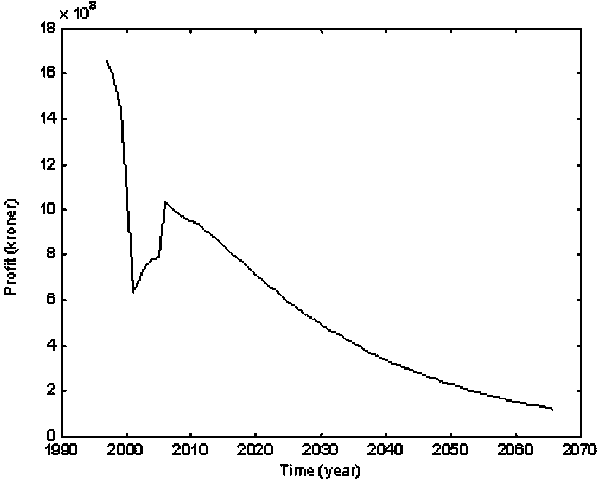
Figure 5a. Cartel Harvest
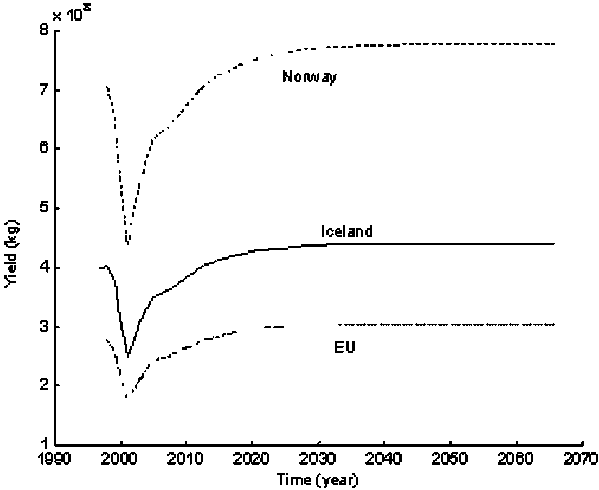
Figure 5b. Cartel Profit
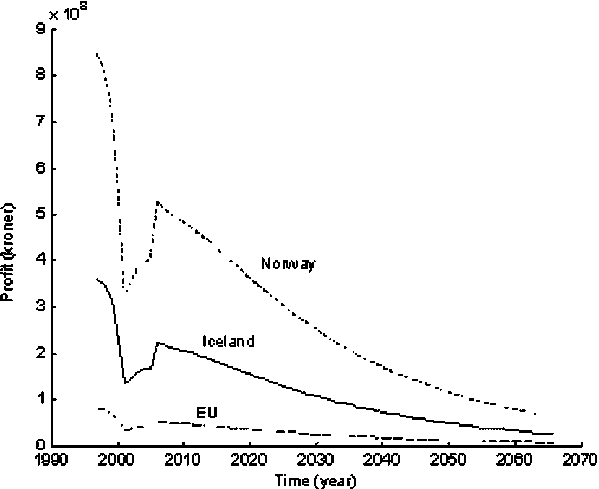
Figure 6. Total Profit, Monopoly vs. Cartel
