![]()
![]()
![]()
32. Facing the growing importance of an integrated global and regional economic system, Africa's sub-regions and countries need to promote their respective comparative advantages jointly. With this requirement in mind, this study is intended to:
identify priority crops, livestock, forestry and fishery products by sub-region and country that not only could meaningfully advance food security and reduce poverty in Africa, but also significantly improve intra-regional and world trade prospects;
identify broad areas of action and types of investment in order to develop the selected commodities.
33. To take advantage of economies of scale and reach a critical mass that would drive productivity and income growth at both country and sub-regional levels, potentially competitive agricultural products were identified for each of the main (five) agro-ecological zones. These zones approximately overlap the territories of the Regional Economic Organizations (REOs) (Box 1).
34. The present study is based on the stock of technical knowledge, experience and databases accumulated by the FAO in Africa. The screening indicators were specified using FAO country time-series data related to land use, animal stocks, production and land and animal type productivity, trade and producer prices. The concepts of comparative advantage and competitiveness served as the basis for the analysis of individual products' income-generation potential.
35. The selection of agricultural products (both food and non-food) should incorporate the objectives regarding food security and poverty reduction. In other words, selected agricultural products should be major sources of cash income, export earnings and/or food that could help countries within a given sub-region address food insecurity on a sustainable basis. With these requirements in mind, agricultural products were retained that exhibit: (a) high production potential in a given country and sub-region; (b) increasing per capita consumption; (c) increasing trade opportunities at global, regional and intra-regional levels; and (d) potential to foster backward and forward linkages within the national economy.
36. Current cropping patterns indicate, to a large extent, the natural suitability of crops or animal types, but fail to capture their trade opportunities. Therefore, the production-cum-trade-opportunities criterion was used to identify potentially competitive crops at sub-regional and country levels. To this end, the crops listed in Concept note on possible methodology for guiding investment decision to be made in order to implement the NEPAD agriculture development programme (Annex 1) were screened based on the average income. In this connection, average income was derived from the commodity output expressed in world trade values (the average FOB unit values) for the period 1996-2000. The relative importance of each agricultural commodity in a sub-region's total output expressed in trade value was estimated. Crops with an output trade value exceeding five percent of the sub-region's total were selected as potentially competitive crops at sub-regional level. The countries where potentially competitive sub-regional crop commodities are to be developed were similarly identified. The crop commodities that account for less than five percent of a sub-region's total production but exceed five percent of a country's total output trade value were selected as potentially competitive country-specific crops. Animal products have been screened using the same criterion.
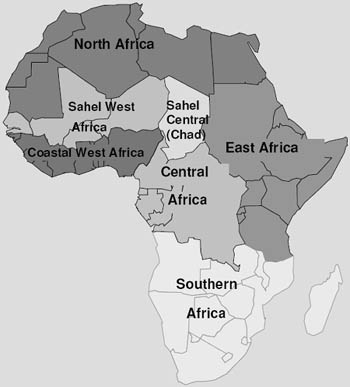
Box 1. The main agro-ecological sub-regions in Africa
|
North Africa is dry (desert) and semi-arid. It covers: Algeria, Egypt, Libya, Mauritania, Morocco and Tunisia. East Africa is subhumid and mountainous and covers: Burundi, Djibouti, Eritrea, Ethiopia, Kenya, Rwanda, Seychelles, Somalia, Sudan, Tanzania and Uganda. IGAD is the main REO and overlaps with COMESA. Southern Africa is predominantly subhumid and semi-arid. It covers: Angola, Botswana, Comoros, Lesotho, Madagascar, Malawi, Mauritius, Mozambique, Namibia, South Africa, Swaziland, Zambia and Zimbabwe. SADC is the main REO for these countries, and many of them are also members of COMESA. Central Africa has ample variations in agro-ecological conditions with two distinct zones. |
|
|
The Central Africa zone (excluding Chad) has humid and subhumid agro-ecological conditions. The countries covered are: Cameroon, Central African Republic, Democratic Republic of Congo, Republic of Congo, Equatorial Guinea, Gabon and Saõ Tomé and Principé. The Sahel Central Africa zone (Chad) exhibits Sudano-Sahelien conditions that are predominantly dry semi-arid and moist semi-arid. The main REOs are CEMAC and CEEAC. West Africa has two distinctive sub-regions. Sahel West Africa (whose main REO is UEMOA) has primarily Sudano-Sahelien agro-ecological conditions. This zone extends over Burkina Faso, Cape Verde, Gambia, Mali, Niger and Senegal. Coastal West Africa has humid and subhumid conditions. This zone includes Benin, Côte d'Ivoire, Ghana, Guinea, Guinea-Bissau, Liberia, Nigeria, Sierra Leone and Togo. ECOWAS, often overlapping with UEMOA, is the dominant REO. |
|
37. The natural-suitability criterion was used to identify potentially competitive sub-regions/countries for forestry development and wildlife conservation, based on the forest and woodland areas' share in Africa's total. Sub-regions whose forests and woodland area exceeded five percent of Africa's total were retained. The same indicator was used to identify countries for forest product development.
38. The area of a sub-region or country that lies within the Exclusive Economic Marine Zone (EEMZ) was used as a proxy indicator of the potential for marine fishery development. Sub-regions were retained for marine fishery development if their share of EEMZ was more than five percent of Africa's EEMZ area. A country was also individually chosen if its EEMZ share exceeded five percent of its sub-region's share.
39. Competitiveness was assessed only for crops and countries when data permitted. (Limited data quality on animal, forestry and fishery products did not allow for this analysis.) The crop competitiveness analysis was approached from two angles, examining the:
productivity differential between African countries and the rest of the world, as well as the major world exporters that dominate a given crop market. To this end the yields were contrasted, and the annual gross incomes per ha expressed in FOB unit values (average 1996-2000) were estimated and compared.
producer-world price differential for both African farmers and world competitors. This analysis was made in order to quantify how much African and competitor producer-prices exceeded or trailed world prices. To estimate the average producer price in US dollars over the period 1991-1995 (more recent time series data were unavailable), annual producer prices were converted into US dollars using International Monetary Fund (IMF) data on nominal exchange rates for national currencies.
![]()
![]()
![]()