Turkey’s tobacco production constitutes 4 percent of global production of 7 million tonnes, placing Turkey fifth after China, India, United States of America and Brazil. The world cigarette market is in general based on blended cigarettes, which include a certain amount of oriental-type tobacco. About 65 percent of oriental tobacco is produced in Turkey, 25 percent in Greece and 10 percent in Bulgaria and the former Yugoslavia. Production of Virginia and Burley tobacco amounts to little more than 3 percent (8 000 tonne) of total tobacco production in Turkey.
Production in 1999 amounted to 260 000 tonnes of tobacco, from 283 000 ha, representing a 73 percent increase from 1970, thanks to a doubling of yield from a 14 percent smaller cultivated area. Production increased between 1970 and 1980, followed by drop in area and production resulting from the application of area quotas, which were relaxed in the following years (Table 6.1; Figure 6.1).
Table 6.1: Tobacco production, area and yield, 1970-1999
|
Year |
Area (ha) |
Production |
Yield |
|
1970 |
328 498 |
149 861 |
487 |
|
1975 |
241 508 |
199 935 |
924 |
|
1980 |
222 997 |
228 349 |
969 |
|
1985 |
176 848 |
170 491 |
946 |
|
1990 |
320 236 |
296 008 |
910 |
|
1995 |
209 919 |
204 440 |
923 |
|
1999 |
283 444 |
259 478 |
923 |
Note: Yields are 2 year averages for 1970 and 1999, and 3 year averages for the rest.
Source: 1970-89 data from SIS; 1990-99 data from TEKEL.
Tobacco yields, which ranged around 500 kg/ha in the early 1970s, increased to over 800 kg/ha in the mid-1970s and subsequently to between 800 and 1 000 kg/ha, averaging over 900 kg/ha (Figure 6.2).
Share in cultivated land
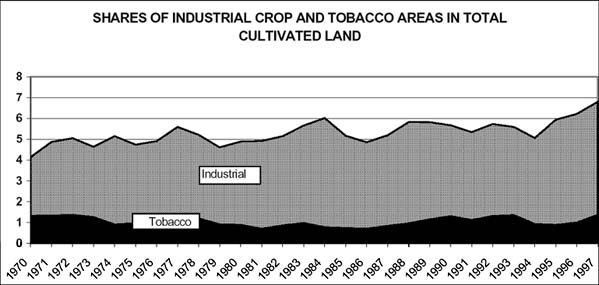
Cereals constitute 59 percent of the total cultivated area in Turkey, followed by fallow (21 percent), pulses (7 percent), industrial crops (7 percent), oilseeds (6 percent) and tuber crops (1 percent). Within industrial crops, cotton has the largest share, with 45 percent, followed by sugar beet (29 percent) and tobacco (20 percent). Thus the tobacco area is about 1.5 percent of the total cultivated area of Turkey, and this proportion has remained fairly constant over a number of years (Figure 6.3).
In Turkey, most of the tobacco produced is of the Oriental type, amounting to 251 038 tonnes in 1999 involving 570 450 producers over an area of 280 143 ha. After harvest, it is traditionally dried in the open air (sun-cured). More recently, there has been increasing use of plastic covered tunnels for drying. Virginia and Burley tobacco, grown under irrigated conditions, are dried in special ovens (flue-cured) and drying hangars (dark air-cured). Non-oriental tobacco involves less than 1 percent of the 575 000 tobacco producers, accounting for little more than 3 percent of total tobacco production and occupying little more than 1 percent of total tobacco area.
Figure 6.1: Tobacco area (‘000 ha) and production (‘000 tonne)
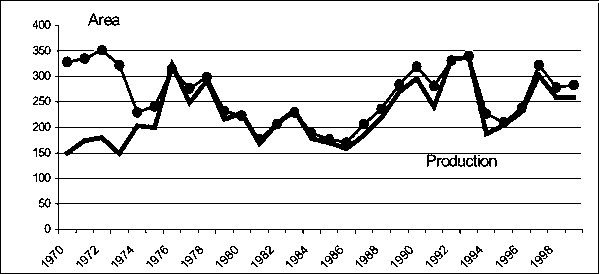
Figure 6.2: Tobacco yields (kg/ha)
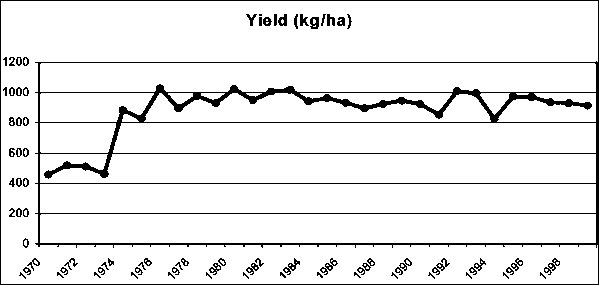
Figure 6.3: Shares of industrial crop and tobacco areas in total cultivated land
Being one of the most labour intensive agricultural production activities, tobacco production is an important source of employment. Most of its labour requirements are met through family labour. With approximately 600 000 tobacco growers in Turkey, and assuming the involvement of 2.5 persons per family, tobacco production employs some 1.5 million persons. More are employed in other tobacco-related activities, like transportation, storage, trade and cigarette manufacturing.
Between 1990 and 1999, both the average farm size and production per farmer fell, the latter also partly as a result of lower yields. The largest reduction in farm size and yields of nearly half were in the east and southeast. The only region registering an increase in farm size and yield was Thrace.
A survey was conducted among 33 tobacco producers in six villages of the Akhisar district of Manisa province, the district and province representing the most important tobacco producing subregion in Turkey. Manisa Province accounts for 23 percent of the nation’s tobacco output and value.
Tobacco provides 67 to 86 percent of average annual household income in the six sample villages.
Some 92 ha of cultivated land was under five crops: tobacco, cotton, wheat, olive and grape. Tobacco accounted for 44 percent of the area, followed by cotton, with 26 percent, olives with 15 percent and wheat with 12 percent. Olives were produced in addition to tobacco by one third of the producers, 24 percent of the farmers produced cotton as well as tobacco, while the same percentage supplemented tobacco with wheat (Table 6.2).
Table 6.2: Production patterns in Akhisar District
| |
Area |
Production |
Farmers |
|||
|
ha |
% |
tonnes |
% |
number |
% |
|
|
Tobacco |
40 |
43.7 |
41 |
20.6 |
33 |
100.0 |
|
Cotton |
24 |
26.1 |
72 |
36.2 |
8 |
24.2 |
|
Wheat |
11 |
11.7 |
51 |
25.6 |
8 |
24.2 |
|
Olives |
14 |
15.3 |
23 |
11.6 |
11 |
33.3 |
|
Grapes |
3 |
3.3 |
12 |
6.0 |
1 |
3.0 |
|
Total |
92 |
100.0 |
199 |
100.0 |
33 |
100.0 |
Source: Original survey data.
Tobacco accounted for 80 percent of the net returns to owned resources, while the remaining four crops, although occupying more than half of the area sown, accounted for only 20 percent of the total net return. Of the annual crops, tobacco yielded the largest return per hectare, comparable only to the perennial grape crop. Employing essentially family labour, the cost of labour was not reflected in the variable costs.
Alternative products to tobacco, as suggested by the farmers, were those already cultivated in conjunction with tobacco: wheat and olive had the lowest production costs in rainfed areas, while cotton, grapes and vegetables were grown in irrigated areas. Olives yielded the highest revenue per hectare, followed by cotton. Provided that credit and technical support is available, it appears the only competitive crop substitutes are currently wheat, cotton or olives.
Introduction
Turkey is a major trader of tobacco on world markets, exporting about 150 000 tonnes (55 percent of its production) and importing about 50 000 tonnes (half the level of consumption) of processed and unprocessed tobacco. It ranks fourth among tobacco exporting countries, with a share of 6 to 8 percent in total world exports, and twelfth among tobacco importing countries, accounting for 2 percent of world imports.
In 1999, total tobacco exports amounted to US$561 million, while imports totalled US$293 million, resulting in a trade surplus of US$268 million. For that year, tobacco accounted for 23 percent of total agricultural export value and 2 percent of the total exports, while imports amounted to 18 and 0.7 percent of agricultural and total imports, respectively.
Trends in tobacco trade
Table 6.3: Tobacco exports and imports
|
Year |
Exports Quantity (‘000 tonnes) |
Imports Quantity (‘000 tonnes) |
||||
|
UP |
P |
Total |
UP |
P |
Total |
|
|
1970 |
|
|
74.0 |
0 |
0 |
0 |
|
1975 |
|
|
65.6 |
0 |
0 |
0 |
|
1980 |
83.7 |
0 |
83.7 |
0 |
0 |
0 |
|
1985 |
102.7 |
0.1 |
102.8 |
0 |
6.0 |
6.0 |
|
1990 |
94.8 |
47.2 |
142.0 |
3.3 |
14.0 |
17.3 |
|
1995 |
82.6 |
59.5 |
142.1 |
21.6 |
4.7 |
26.3 |
|
1998 |
155.3 |
7.5 |
162.8 |
42.2 |
14.9 |
57.1 |
|
1999 |
129.1 |
11.5 |
140.5 |
48.8 |
16.3 |
65.3 |
Key: UP = Unprocessed; P = Processed.
Source: SIS Trade Statistics, various issues.
Table 6.3 presents the trends in tobacco exports and imports over the period 1970 to 1999. Between 1970 and 1999, the quantity exported nearly doubled. Imports of tobacco did not start until 1984, and the quantity imported in 1999 was more than 10 times that of 1985. However, the total quantity exported showed considerable fluctuation during this period, while import quantity increased. The volume exported was lowest in 1978, and peaked in the 1996-98 period. Import volumes have increased in all years except 1989, 1990, 1993 and 1998. The net trade volume declined in 1984, with the appearance of imports, but displayed a consistent pattern thereafter (Figure 6.4).
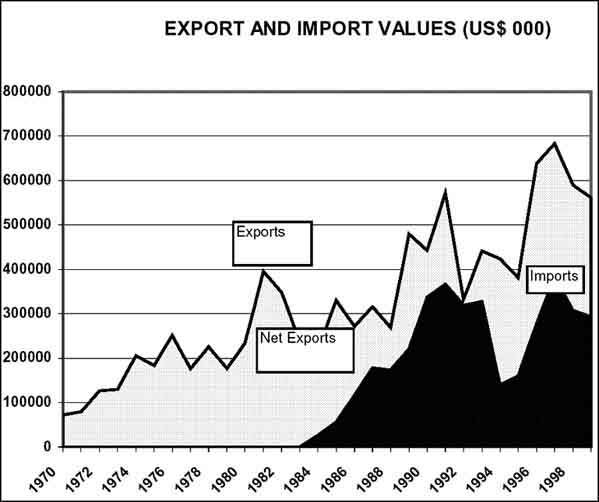
Values of exports and imports have been relatively more stable (Figure 6.5). The value of exports peaked in 1997, declining thereafter, but never falling below the 1970 level. Import value peaked in 1981 and 1997. The net value of trade decreased between 1984 and 1992, to nearly zero. Since then it has recovered to approach the levels of the 1980s.
Figure 6.4: Tobacco export and import quantities (tonne)
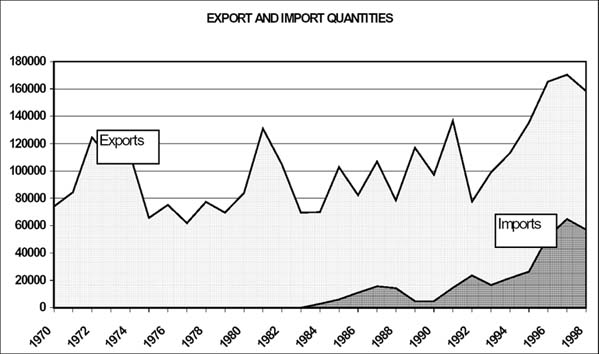
Figure 6.5: Tobacco exports and imports by value (US$‘000s)
Composition of tobacco trade
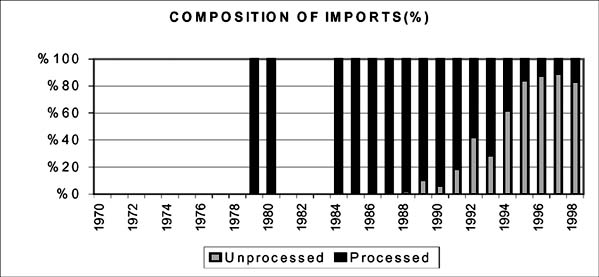
It was not until the first half of the 1980s that Turkey exported small amounts of processed tobacco. Processed tobacco exports remained under 20 percent of the total export value, except in 1995, when it reached its peak share of over 35 percent (Figure 6.6). The import composition is given in Figure 6.7.
Figure 6.6: Composition of export value
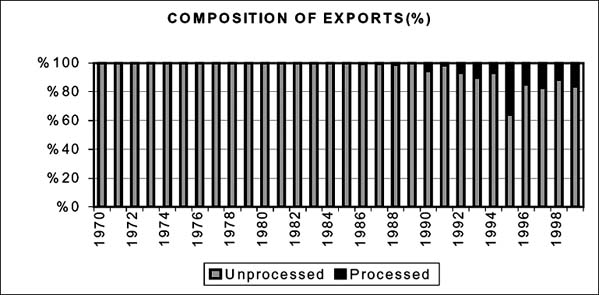
Figure 6.7: Composition of import value
Origin of imports and destination of exports
In the early 1990s, the United States of America took the largest share of Turkish exports (over 55 percent), followed by EU countries (about 25 percent). Over time, the share of the United States has declined to about 30 percent and the share of EU countries increased to nearly 40 percent. The major importers of Turkey’s tobacco are now the United States, Canada, France, Switzerland, Zimbabwe, Malawi, South Africa and Germany. In 1990, Turkey imported almost all its tobacco from the United States (Table 6.4). Turkey is a net importer of tobacco from the United States, Switzerland, France, Canada, Zimbabwe, Malawi and South Africa, and net exporter to the remainder.
Table 6.4: Turkey’s major tobacco trade partners (1997)
|
Country |
Exports (US$million) |
Imports (US$million) |
|
United States of America |
260.4 |
269.2 |
|
Germany |
67.0 |
6.5 |
|
Belgium |
54.6 |
0.1 |
|
Lebanon |
30.6 |
0 |
|
The Netherlands |
24.0 |
0.3 |
|
Russia |
24.0 |
0.3 |
|
Japan |
16.6 |
0 |
|
United Arab Emirates |
13.3 |
0 |
|
Republic of Korea |
11.8 |
0 |
|
Switzerland |
11.6 |
21.2 |
|
France |
10.7 |
16.8 |
|
Canada |
0.8 |
24.9 |
|
Zimbabwe |
0 |
14.6 |
|
Malawi |
0 |
10.3 |
|
South Africa |
0 |
8.3 |
|
Total |
682.7 |
383.0 |
Source: SIS Foreign Trade Statistics, 1997.
Large stocks of tobacco are common in Turkey. Year-end stocks in 1999 were estimated at over 500 000 tonnes, representing a 12 percent increase from the previous year and a 32 percent increase from 1990.
However, their poor quality prevents their use in cigarette production. The government has been attempting to reduce oriental tobacco stocks through production control, stimulating exports by reducing prices, and stock disposal via burning. Nearly 125 000 tonnes of tobacco were destroyed in the last 10 years, nominally worth US$177 million.
According to the supply utilization account for tobacco in unmanufactured dry tobacco equivalents, over the last decade, tobacco consumption in Turkey has decreased by over 20 percent.
Until 1994, a support price scheme similar to that for other crops operated for tobacco. Prices were differentiated according to grade (Grade A, Grade B, and “Kapa”, the lowest grade) and region. Lower support prices were sometimes offered in advance of the harvest, if requested by the farmers. The General Directorate of Tobacco, Tobacco Products, Salt and Alcohol Enterprises (TEKEL) was legally obliged to buy all tobacco not sold to private buyers and to stockpile what it could not sell. This stockpile grew and by November 1993 had reached approximately 500 000 tonnes of mainly low-grade domestic tobacco.
A new support system for tobacco was in place from the 1994 crop year, linking deficiency payments to reductions in the area planted to tobacco. Producers have received “compensation payments” to mitigate their losses. TEKEL’s “support” purchases declined substantially, from 231 000 tonnes in 1993 to 44 000 tonnes in 1995, marking the application of production quotas. With the subsequent removal of the quota, production and “support” purchases started to increase, reaching 137 000 tonnes in 1999.
Since 1983, the area planted to tobacco has been regulated. From crop year 1994, new quantitative measures linked to compensatory payments were introduced to control output, targeting areas where profitable alternatives to tobacco existed. The national production quota is fixed by the Inter-ministerial Tobacco Board.
Some of the inputs, namely fertilizers, pesticides and irrigation water, as well as introduction of new technologies, are subsidized by the state in order to promote their use in pursuit of enhanced yields. Out of an annual requirement of 50 000 tonnes/year, the Ministry of Agriculture and Rural Affairs (MARA) and TEKEL produce and provide 10 000 tonnes, the rest being met by farmers themselves from their own production. There is no subsidy per se on seed and seedlings, and the fertilizer subsidy has been progressively reduced in real terms.
Since 1984, companies engaged in the production of tobacco products have been permitted to import raw tobacco, initially subject to 50 percent customs duty. In September 1989, the duty was reduced to 40 percent, and subsequently eliminated in May 1991. However, a levy of US$2 000/tonne was imposed. In 1993, this was supplemented by customs duty of 25 percent, which was still in place in 2000. There is no import duty on processed tobacco products from the EU and EFTA, but tobacco products from other countries are dutied at between 18.2 percent and 81.9 percent, depending on the product.
TEKEL has a 70 percent share of the domestic Turkish cigarette market, and is the largest tobacco exporter in Turkey. It oversees, among other things, the manufacture, import and sale of tobacco, as well as carrying out research to improve quality, productivity and operational efficiency.
The two most important products produced and sold domestically are filtered cigarettes and Turkish raki (an alcoholic aromatic liquor).
According to Schmitz et al. (1999), tobacco policy has had a positive impact on value addition, has enhanced welfare, and has favoured producers of poorly selling, low quality tobacco grown on hilly terrain, the government making up the difference between the announced and market price through deficiency payments. Consumer prices are lower because of subsidization of TEKEL’s tobacco processing. However, producers in general benefit only negligibly.
Because of TEKEL’s large market share and its ties to government, it acts as a price leader in the industry. Producers, as a last resort, can sell their tobacco to TEKEL.
While private firms have always operated side-by-side with public firms in tobacco processing, cigarette production and sales were in the hands of a state monopoly until 1991, when two private cigarette factories were established as joint ventures with RJ Reynolds and with Phillip Morris. Production began in 1993.
In 1971, 27 percent of manufacturing firms in Turkey were engaged in the food, beverage and tobacco processing sector. Of the total manufacturing firms 11 percent were public sector enterprises, 4.5 percent of them were concerned with tobacco processing and cigarette production. More than half of the tobacco processing firms were private, while all cigarette producing firms were in the public sector.
By 1997, the number of tobacco processing firms had declined, but the share of public-sector firms increased to 62 percent. The total number of cigarette factories remained the same, but the establishment of two private factories reduced the public share to 78 percent (Table 6.5).
Table 6.5: Tobacco and other manufacturing establishments
|
Year |
Manufacturing establishments |
Food, beverage and tobacco manufacture |
Tobacco manufacture |
Cigarette manufacture |
||||
|
Total |
Of which public |
Total |
Of which public |
Total |
Of which public |
Total |
Of which public |
|
|
No. |
% |
No. |
% |
No. |
% |
No. |
% |
|
|
1971 |
4 931 |
6.7 |
1 329 |
11.3 |
60 |
48.3 |
na |
100.0 |
|
1975 |
6 068 |
6.5 |
1 482 |
11.9 |
55 |
52.7 |
na |
100.0 |
|
1980 |
8 710 |
4.7 |
1 851 |
11.9 |
47 |
59.6 |
9 |
100.0 |
|
1985 |
19 647 |
3.7 |
2 277 |
9.0 |
50 |
54.0 |
8 |
100.0 |
|
1990 |
8 871 |
4.6 |
1 894 |
11.4 |
50 |
50.0 |
8 |
100.0 |
|
1995 |
10 230 |
3.5 |
1 792 |
9.9 |
38 |
63.2 |
9 |
77.8 |
|
1997 |
11 373 |
2.8 |
1 863 |
8.8 |
37 |
62.2 |
9 |
77.8 |
|
1999 |
na |
na |
na |
na |
na |
na |
9 |
77.8 |
Notes: (1) na = not available. (2) An establishment is defined as employing 10+ persons, and applies to both and public firms.
Source: SIS and TEKEL records.
In 1997, almost 2 percent of all those employed in manufacturing industries employing 10 or more workers were in tobacco manufacturing.
The number employed in tobacco manufacturing increased between 1971 and 1980, reaching a peak of nearly 53 000 in 1980, then fell to 22 600 in 1997. These fluctuations originated from public sector employment policies. The public sector’s share in employment in tobacco manufacturing increased from 80 percent in 1971 to 95 percent in 1980, and then fell to 71 percent in 1997 (Table 6.6).
Table 6.6: Employment in tobacco manufacturing
|
Year |
Manufacturing establishments |
Food, beverage and tobacco manufacture |
Tobacco manufacture |
Cigarette manufacture |
||||
|
Total employed |
Of which public |
Total employed |
Of which public |
Total employed |
Of which public |
Total employed |
Of which public |
|
|
No. |
% |
No. |
% |
No. |
% |
No. |
% |
|
|
1971 |
519 233 |
38.2 |
125 371 |
55.1 |
32 296 |
80.4 |
na |
100.0 |
|
1975 |
678 580 |
35.3 |
150 263 |
55.6 |
38 480 |
87.3 |
na |
100.0 |
|
1980 |
786 995 |
36.5 |
188 160 |
60.1 |
52 807 |
95.0 |
na |
100.0 |
|
1985 |
928 128 |
29.8 |
193 432 |
49.2 |
43 289 |
89.7 |
na |
100.0 |
|
1990 |
1 023 669 |
24.4 |
188 373 |
42.7 |
32 143 |
84.1 |
10 574 |
100.0 |
|
1995 |
970 718 |
17.5 |
168 827 |
35.6 |
24 131 |
79.0 |
na |
na |
|
1997 |
1 140 648 |
12.9 |
177 380 |
30.7 |
22 605 |
70.9 |
na |
na |
Notes: (1) na = not available. (2) Employment numbers are for private-sector establishments employing 10+ persons, and all employed in public firms.
Source: SIS and TEKEL records.
Wage and salary payments in tobacco manufacturing
In 1997, wages paid in the tobacco processing industry represented 2.5 percent of all wages in manufacturing. Payments by the tobacco industry increased significantly, from US$34 million in the 1970s to US$214 million in 1980, and then fell to US$167 million in 1997.
Per capita tobacco industry payments to employees in 1997 were about 25 percent higher than in other manufacturing industries and were about double (after accounting for taxes) Turkey’s prevailing per capita income of around US$3 000 in 1997.
Table 6.7 shows that the value added in tobacco manufacturing in 1997 was US$555 million, of which 40 percent was generated by TEKEL’s seven cigarette factories. This represented 1.3 percent of the total value added generated in the manufacturing sector, a substantial decline from 14 percent in 1971. Nevertheless, tobacco remains significant within the manufacturing sector.
Table 6.7: Value added in tobacco manufacturing
|
Year |
Manufacturing |
FBT |
Tobacco |
Cigarette |
Exchange rate |
Manufacturing |
FBT |
Tobacco |
Cigarette |
|
LT billion |
$/LT |
US$million |
|||||||
|
1971 |
38 |
12 |
5.41 |
na |
15 |
2 513 |
773 |
361 |
na |
|
1975 |
87 |
24 |
7.1 |
na |
14 |
6 236 |
1 736 |
507 |
na |
|
1980 |
719 |
151 |
35.6 |
na |
76 |
9 462 |
1 988 |
468 |
na |
|
1985 |
5 454 |
1 182 |
458 |
na |
518 |
10 529 |
2 281 |
884 |
na |
|
1990 |
75 301 |
12 412 |
3 048 |
2 261 |
2 608 |
28 873 |
4 759 |
1 169 |
867 |
|
1995 |
1 755 020 |
279 623 |
43 383 |
13 588 |
45 705 |
38 399 |
6 118 |
949 |
297 |
|
1997 |
6 265 368 |
764 836 |
83 937 |
33 413 |
151 239 |
41 427 |
5 057 |
555 |
221 |
|
1998 |
na |
na |
na |
87 482 |
259 860 |
na |
na |
na |
337 |
Note: (1) FBT = Food, beverage and tobacco manufacturing sector. (2) Value added in cigarette production applies only to the public sector. (3) na = not available.
Source: SIS Statistical Yearbooks and SIS Records, various years.
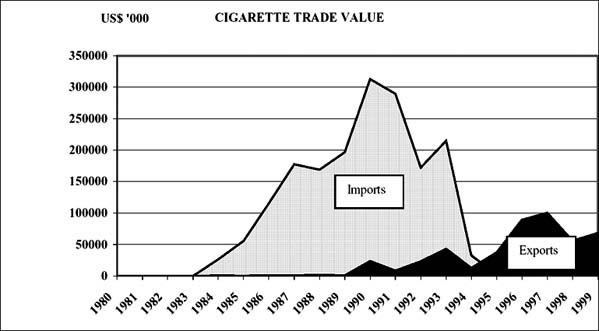
Turkey neither exported nor imported cigarettes until 1981 when the first cigarettes were exported, with the first imports following in 1984. It became a net importer of cigarettes, with a trade deficit of US$56 million in 1985, reaching a peak of US$289 million in 1990. Imports fell from 1991, reaching a negligible level in 1999. Cigarette exports, in contrast, started increasing after 1990, peaking at US$100 million in 1997. Consequently, in 1995, the trade deficit in cigarettes was reversed to a trade surplus, with the country becoming a net cigarette exporter in 1999. The foreign exchange earning from cigarette trade amounted to US$68 million in 1999 (Table 6.8; Figure 6.8).
Table 6.8: Cigarette exports and imports
|
Year |
Imports |
Exports |
Net exports |
||
|
Quantity |
Value |
Quantity |
Value |
Value |
|
|
1980 |
0.0 |
0 |
0.0 |
0 |
0 |
|
1985 |
6.0 |
55 742 |
0.03 |
176 |
-55 566 |
|
1990 |
15.8 |
312 810 |
5.7 |
23 600 |
-289 210 |
|
1995 |
0.13 |
2 414 |
8.5 |
37 474 |
35 060 |
|
1999 |
0.001 |
11 |
9.6 |
68 039 |
68 028 |
Note: The export quantities for 1990 and 1992 have been corrected for possible unit errors in statistics. These are converted to weights assuming 20 g/pack.
Source: SIS Trade Statistics.
Figure 6.8: Turkey’s cigarette trade
Almost all tobacco produced is sold unprocessed either to private traders or to TEKEL. Private sector purchases are generally export oriented, dependent on foreign orders. TEKEL’s purchases are for both domestic cigarette production and for export as leaf tobacco. Hence, the prices received by farmers are a weighted average of the prices paid by TEKEL and the private sector. Over the last decade, TEKEL’s share in the purchase of unprocessed tobacco has fluctuated between 48 percent and 83 percent.
Each year, support prices are announced for tobacco of a certain standard (80 percent yield). However, the actual prices paid to the farmers are below the announced prices, since, on average, the quality is substandard. As the private sector buys better quality tobacco, their average purchasing price is higher than that of TEKEL. Figure 6.9 presents the trends in average support prices for tobacco over the last two decades, together with the trends for wheat and cotton, which are grown in the same regions and are the major possible alternative crops to tobacco. The trends are presented as US$prices of the crops, indexed to 1970 = 100.
Figure 6.9: Tobacco support prices relative to wheat and cotton
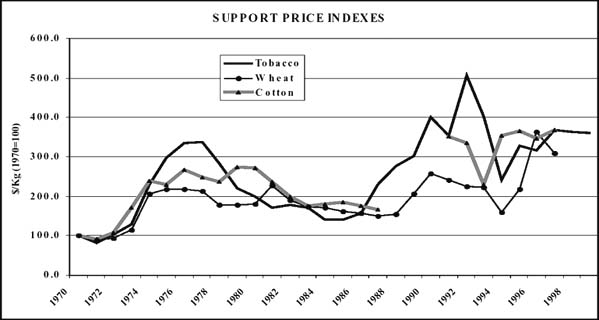
Over the last three decades the average price of unprocessed tobacco has more than tripled, as have the prices for wheat and cotton. Except for a few years, the prices of the three products have tended to move in the same direction. It has mirrored the trend in overall prices received by farmers in the period. Prices all increased in the early 1970s, fell through the late 1970s and early 1980s, and have generally increased since.
The value of unprocessed tobacco production in 1999 (1998 crop) was US$1 100 billion, over 9 times the value for 1970, an increase only partly attributable to increased production (Table 6.9).
Table 6.9: Value of tobacco production
|
Year |
Production |
Value |
|
1970 |
150 |
119 |
|
1975 |
200 |
547 |
|
1980 |
228 |
415 |
|
1985 |
170 |
254 |
|
1990 |
296 |
1 234 |
|
1995 |
204 |
846 |
|
1998 |
259 |
1 104 |
Note: Values are for crop year (i.e. Production (t-1)*Price(t))
Source: SIS Statistical Indicators, various issues.
Comparing domestic prices with international prices, using the so-called Nominal Protection Coefficient (NPC), gives an estimate of the magnitude of market price distortion resulting from agricultural policies. During the 1970s, domestic and international price trends for unprocessed tobacco were very similar, in both direction and magnitude. However, in the first half of the 1980s, domestic prices declined while international prices were increasing slightly, tobacco producers were taxed rather than being supported. In contrast, in the 1990s, domestic prices began increasing faster than international prices indicating that protection to producers was increasing.
In Turkey, three basic types of cigarettes are marketed: Oriental blend, American blend and English blend. TEKEL produces all three types, while the two private companies produce only the American blend.
A national survey undertaken in 1988 reported that the overall prevalence of smoking among adults (age 15+ years) was 43 percent, with prevalence among males being much higher than among females, and the average starting age was falling.
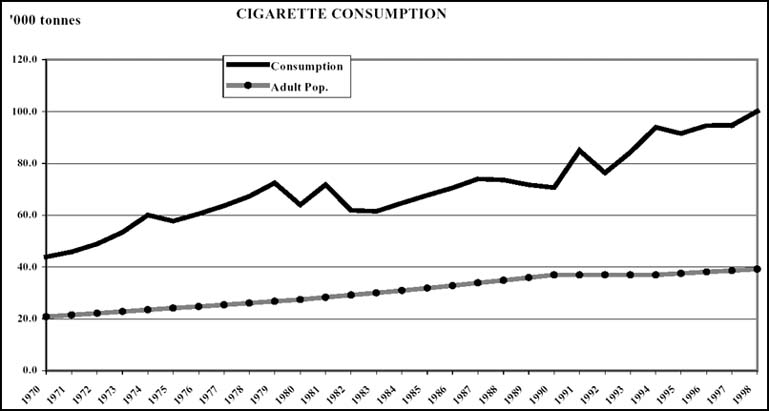
Currently, 5 billion packs (100 000 tonnes equivalent) of cigarettes are consumed in Turkey annually. Over the last 30 years, the adult population has nearly doubled, with consumption increasing by almost 250 percent. The current per capita consumption rate is 2.55 kg/year, or more than one third of a pack per day per person. (Figure 6.10). It is estimated that 70 000 to 100 000 people die from smoking-related health problems each year.
Figure 6.10: Annual cigarette consumption in Turkey
Households spend about one third of their income on food. Expenditure on cigarettes constituted 2.4 percent of total expenditure in 1987 and 1994, this share being higher in rural areas than urban centres due to the lower rural incomes (Table 6.10).
Expenditure on cigarettes is nearly equal to the total expenditure on health and is more than double that of tea and coffee, nearly 7 times the share of fish, and more than half the share of milk and milk products.
The proportion of consumer expenditure which goes to cigarettes is higher for people on higher incomes.
Table 6.10: Household expenditure changes for selected items, 1987 and 1994
| |
All Turkey |
Urban areas |
Rural areas |
|||
|
1987 |
1994 |
1987 |
1994 |
1987 |
1994 |
|
|
Index, 1987 = 100 |
||||||
|
Total expenditure |
100 |
105 |
100 |
107 |
100 |
102 |
|
Food |
100 |
117 |
100 |
121 |
100 |
112 |
|
Bread and cereals |
100 |
129 |
100 |
145 |
100 |
115 |
|
Cigarettes |
100 |
107 |
100 |
119 |
100 |
89 |
|
Health |
100 |
107 |
100 |
119 |
100 |
87 |
|
Share in total (%) |
||||||
|
Food |
32.02 |
35.62 |
27.22 |
30.70 |
40.97 |
45.28 |
|
Bread and cereals |
5.89 |
7.24 |
4.50 |
6.07 |
8.47 |
9.54 |
|
Cigarettes |
2.42 |
2.45 |
2.15 |
2.39 |
2.93 |
2.57 |
|
Health |
2.57 |
2.60 |
2.38 |
2.65 |
2.91 |
2.50 |
Source: SIS, 1987 and 1994 Household Consumption Expenditures Surveys.
Both domestic and imported cigarettes are taxed in Turkey. Domestic tobacco is subject to a tax of more than 200 percent, and tobacco is an important source of indirect tax revenue. The tax from tobacco amounted to US$2 300 million, which was more than one eighth of total indirect tax revenue in 1998.
On 26 November 1996, the Government of Turkey approved Law No. 4207, regulating smoking and the sale and advertising of tobacco products. The law prohibits smoking in institutions providing health, educational or cultural services, in closed sporting areas, and within mass transportation systems. Public businesses with five or more employees must provide special non-smoking areas.
Additionally, the law:
1. prohibits the sale of tobacco products to persons under the age of 18 years;
2. requires the words "Legal Warning: Harmful to Health" to be printed on all packaging of tobacco and tobacco products produced in or imported into Turkey;
3. requires all establishments where smoking is prohibited to place warning signs as well as advertising the consequences of violating the prohibition;
4. requires State and private radio and television stations to air a minimum of 90 minutes of public service messages warning of the harmful effects of tobacco.
Furthermore, the Law prohibits advertising and promotion of tobacco and tobacco products by using any name, trademark, or trade name.
Although the advertising ban applies equally to both the State tobacco enterprise, TEKEL, which controls 70 percent of the market, and to private companies, the private manufacturers consider themselves to be unfairly disadvantaged since, having only recently entered the market, advertising is critical for them.
Protection for non-smokers
Smoking is prohibited in schools and hospitals through ministerial decrees, but enforcement is poor. Since 1988, smoking has been banned on domestic flights. Smoking has been prohibited in around 70 percent of the available capacity in certain trains and long-distance buses.
Health education
The first major campaign to encourage non-smoking was launched in 1988 by the Ministry of Health. The Turkish Medical Association has been prominent in activities related to non-smoking. A series of spot advertisements have been produced and diffused through the various national and private television channels. World No-Tobacco Day is celebrated annually in Turkey, with distribution of materials and involvement of the media.
Turkey’s annual tobacco production constitutes about 4 percent of world production, but accounts for 65 percent of the world’s oriental tobacco production. Tobacco is grown on 1.5 percent of the country’s total cultivated area. Being highly labour-intensive, tobacco production provides employment for some 1.5 million people, in addition to employment in ancillary industries, namely storage, transport and cigarette manufacture.
The value added in tobacco processing constituted 1.3 percent of the total value added in the manufacturing sector, and tobacco is an important source of indirect tax revenue.
Tobacco figures prominently in Turkey’s foreign trade. It exports 150 000 tonnes and imports 50 000 tonnes of processed and unprocessed tobacco. Turkey ranks fourth among tobacco exporting countries, with a share of 6 to 8 percent of total world exports.
In current market conditions, tobacco production in the established growing areas appears to be economical. Alternative crops or other activities are less profitable, especially in the regions yielding lower quality tobacco.
Schmitz, A., Çakmak, Schmitz & Gray. 1999. Policy, State Trading and Cooperatives in Turkish Agriculture. AERI Project Report, No. 1999-1.