![]()
![]()
![]()
Tariff escalation refers to a situation where tariffs rise along processing chains. This practice can afford significant protection to processed products in importing countries, depending on the share of value-added in final output. Thus, tariff escalation effectively limits the scope for processing of agriculture and labour-intensive products in exporting countries. The issue of tariff escalation in agricultural products is gaining more importance given the fact that growth in agricultural trade is shifting more to processed products. Countries with high dependence on commodity exports have a strong interest in this matter as they are trying to escape from the circle of producing and exporting primary products.
The existence of tariff escalation in agricultural markets is regarded as one of the major factors that hinder export growth and diversification and sustainable development in the exporting countries. Two aspects of this effect are seen as critical. First, tariff escalation has the potential of hindering the growth of agricultural processing in the exporting countries. It reduces demand for more processed imports from exporting countries, and hence the expansion of their processing industries, the means of accumulating skills and capital, and export diversification. In addition, the concentration of exports in less processed commodities often results in slower export growth and greater exposure to the risk of commodity price volatility.
Second, tariff escalation is perceived as a source of environmental damage to exporting countries - a tax on sustainability. There are many possible ways in which tariff escalation may hurt the environment. The excessive reliance on primary product exports is likely to cause over-depletion of natural resources and disturb the ecological balance of the country. The increased stress on the production and export of raw materials will lead to "excessive" extraction of natural resources, with the consequent degradation of the resource base.[77] In addition, the slower rate of growth of income as a result of over-exploitation of resources will leave fewer resources available for efficient environmental management in exporting countries.
Reducing tariff escalation figured out as an important issue in the on-going WTO negotiations on agriculture. This article examines tariff escalation in agricultural commodity markets. Section 2 examines the evolution of trade in processed agricultural products during 1981-2000 and highlights major constraints for its expansion in developing countries. Section 3 provides a brief description of the measurement of tariff escalation and section 4 reviews some recent empirical work assessing tariff escalation in the post-Uruguay Round period. Section 5 assesses the magnitude of escalation in both bound and applied tariffs in selected major agricultural commodity chains and Section 4 highlights possible changes in their structure under different methods of tariff reduction, and section 6 concludes and raises some policy issues.
Over the last 20 years, world trade in processed agricultural products grew faster than in primary agricultural products. As a group, exports of processed agricultural products grew at 6 percent annually during the period 1981-2000 (compared to 3.3 percent for primary products), raising their world market shares in total agricultural trade from 60 percent in 1981-1990 to 66 percent in 1991-2000 (Table 1). Growth rates have been exceptionally high (above the average 6 percent) for the processed forms of cereals, fruit, vegetables, pulses, tropical beverages and poultry products (Figure 1).
Table 1. Value of world agricultural exports, all commodities (crops and livestock)
| |
Value of world agricultural exports a (million US$) |
Share in total world agricultural exports (percent) |
||
|
Primary |
Processed |
Primary |
Processed |
|
|
1981 - 1990 |
111 805 |
160 996 |
40 |
60 |
|
1991 - 2000 |
1662 49 |
310 019 |
34 |
66 |
a/ Includes intra-EU trade.
Source: Computed from FAOSTAT (2003)
Low income elasticity of demand for primary commodities and declining intensity of raw materials use in economic activities have been shown to be the major factors that led to the decline in the share of primary commodity trade (World Bank, 1994). Several studies have also shown that changes in the organizational structure of commodity markets may have contributed to the decline in the share of primary commodities in total trade. The high costs associated with processing, packaging, advertising, marketing and distribution mean that the cost of primary commodities as a share of the processed product price is usually small (OECD, 2001).
Although some of the developing countries have increased their share in world exports of processed agricultural products,[78] the developed countries captured the bulk of the rapidly growing trade in this sector. High dependence on exports of primary agricultural products continued to be a prominent feature in many developing countries, particularly the least developed countries (LDCs).[79] The share of developing countries in world exports of processed agricultural products decreased from 27 percent in 1981-1990 to 25 percent in 1991-2000 (Table 2). For LDCs as a group, the share in processed agricultural exports fell sharply from 0.7 percent to 0.3 percent.
Figure 1: Share of individual products in total world agricultural exports, 1981-90, 1991-2000
Table 2. Share in world agricultural exports, all commodities (crops and livestock)
| |
Primary products |
Processed products |
||||
|
Developed |
Developing |
LDCs |
Developed |
Developing |
LDCs |
|
|
1981 - 1990 |
66.2 |
33.8 |
3.1 |
73.0 |
27 |
0.7 |
|
1991 - 2000 |
67.4 |
32.6 |
2.2 |
75.0 |
25 |
0.3 |
Source: Computed from FAOSTAT (2003)
The decline of the share of developing countries in world exports of processed products was more evident in such products as cocoa and coffee. The share of the top ten cocoa-producing developing countries in world exports declined as the stage of processing increased. In 1996-99, the shares of these countries in world exports of cocoa beans, cocoa butter, cocoa powder and chocolate were 83 percent, 30 percent, 18 percent and 1 percent respectively. While the share of chocolate exports in total cocoa trade rose from 20 percent in 1970-75 to 56 percent in 1996-99, the share of these countries in chocolate exports declined from 1.3 percent to only 1 percent during the same period. Similarly, the share of the top 10 coffee-producing developing countries in green coffee remained unchanged at about 67 percent between 1970-75 and 1996-99, but their share in roasted coffee declined from 10 to 2 percent during the same period.
The declining shares of developing countries in world processed agricultural exports have been attributed to several factors. Market access and market entry barriers in importing countries have limited the ability of developing countries to expand exports of their processed products. Tariff escalation, in particular, is often considered to be the major market access barrier for most of the processed agricultural exports of the developing countries.
Several studies have shown that agricultural commodity chains, particularly those of high value crops and processed products, are increasingly dominated by a few multinational enterprises (MNEs) and distribution companies.[80] Growing concentration may affect access to markets and returns to developing countries for their primary products.
Other major challenges facing many developing countries, particularly LDCs, are internal supply constraints that limit the ability of these countries to take advantage of the trading opportunities in processed agricultural products. These include weak technology; insufficient transport, storage and marketing infrastructure; inadequate legal and regulatory arrangements; and policy-induced disadvantages resulting from trade and macroeconomic policies that are biased against agriculture and exports.
Tariff escalation is measured by tariff wedges, the difference in nominal tariffs between the output commodity and the input commodity. Tariff wedge can be expressed as:
TW = T - t (1)
Where,
TW = Nominal tariff wedge
T = Tariff in ad valorem equivalent of the output commodity
t = Tariff in ad valorem equivalent of the input commodity
Thus, tariff escalation occurs when TW > 0, tariff de-escalation takes place when TW < 0 and tariff parity is defined as TW = 0.
While the nominal tariff wedge (TW) is simple and easy to calculate, it has a major limitation in that it does not fully measure the intensity of protection accorded to the final product. First, the nominal tariff wedge measure does not provide information about the impact of the tariff structure on the value added of the final product. Second, it compares nominal tariffs of final output and only one input. As explained by Lindland (1997), TW can hardly be applied to fabrication processes involving multiple inputs and/or multiple outputs.
The intensity of protection for a product can best be measured by the effective rate of protection (ERP),[81] which assesses how tariffs affect the value-added of the processed commodity and takes into account tariffs on multiple inputs. The ERP is defined as the change in value added, made possible by the tariff structure, as a percentage of the free trade value added:
 VAf and VAd > 0 (2)
where,
VAf = value added per unit of final output at free trade prices;
VAd = value added per unit of output in presence of tariffs
With m inputs used the production of final output j, VAf and VAd can be written as:
VAf =
(3)
and
(4)
where,
Pj = nominal price per unit of j at free trade prices;
Pi = nominal price per unit of input i at free trade prices;
aij = share of input i in cost of j at free trade prices;
Tj = nominal tariff in ad valorem equivalent of output j;
ti = nominal tariff in ad valorem equivalent of input i.
With only one input and one output, equation [2] can be simplified as follows:
 where 0
< aij < 1 (5)
where 0
< aij < 1 (5)
Equation (5) shows the relationship between nominal tariff wedge (TW) and ERP:
If:
T > t (tariff escalation) ® ERP > T > t, and ERP increases with the increase in aij
T < t (tariff de-escalation) ® ERP < T < t, and ERP decreases with the increase in aij
T = t (tariff parity) ® ERP = T = t, and ERP is not affected by changes in aij.
Thus the higher the degree of tariff escalation, the greater is the effective rate of protection enjoyed by the final-good industry, i.e. for TW greater than zero (T > t), the ERP will be positive and greater than the nominal tariffs on output. This can be illustrated by examples of green coffee (denoted by A) and roasted coffee (denoted by B). Assuming aij of 0.6, a tariff of 20 percent on product B and 10 percent on A will result in ERP of 30 percent. However, a 20 percent tariff on product B and a zero tariff on A will result in ERP of 50 percent.
Thus, comparing nominal tariffs on inputs and output-product within production chains gives a good indication of the sign of the effective rate of protection, but obviously not the intensity of protection. A major problem with the ERP measure, compared to the nominal tariff wedge measure, however is that it requires accurate data on prices and technical input-output coefficients, which are generally not available. While the ERP is relatively more comprehensive in measuring protection resulting from tariff structure, it has several limitations. Greenaway and Milner (2003) have summarized the theoretical critique of the concept. Despite these limitations ERP remains one of the major indicators to evaluate trade policy.
The reduction in overall tariff rates for agricultural products during the Uruguay Round (UR) is considered a significant move in reducing distortions in world agricultural markets and improving market access conditions for agricultural exporters, including through reducing tariff escalation.
Several studies have been conducted to assess the impact of the Uruguay Round on tariff escalations in agricultural commodity markets. These studies differ widely in terms of country and commodity coverage, type of measures used (nominal wedges or effective rate of protection), level of tariff aggregation used in the analysis and the stages of processing considered (first, intermediate and final stages of processing). The studies reveal many results and observations, but the major finding reached is the persistence of tariff escalation, post-UR, in markets of both developed and developing countries.
Almost all the studies have shown that while MFN tariffs have, on average, been reduced post-UR, problems of high tariffs and tariff escalation are still widespread. Lindland (1997) assessed the changes in tariff escalation resulting from the UR tariff concessions, examining the agricultural import markets of the EU, Japan and the United States. After a detailed comparison of base bound tariffs resulting from commitments under the WTO Agreement on Agriculture (AoA) for an extensive range of commodity pairs, it was concluded that more than 80 percent of the bound tariff wedges between processed and primary products had decreased as a result of the UR, creating thus additional opportunities for developing countries to diversify their exports into higher value-added processed products. However, after full implementation of the UR commitments more than 50 percent of the commodity pairs examined would still have escalating bound tariffs, with an average nominal tariff wedge of 17 percent. The study shows that the highest post-UR bound tariff escalation was present in the dairy, sugar, fruit, tobacco and hides and skins sectors (See Table 3).
Table 3. Selected commodity groups with highest bound tariff escalation (nominal tariff wedges)
| |
Tariff wedgesa |
|
|
Base tariffs |
UR bound tariffs |
|
|
European Union |
|
|
|
Fruit products |
102.5 |
84.8 |
|
Sugar products and sweeteners |
39.8 |
37.2 |
|
Dairy and egg products |
51.6 |
34.4 |
|
Root and tuber products |
31.0 |
19.8 |
|
Tobacco and pyrethrum |
37.3 |
14.1 |
|
Japan |
|
|
|
Sugar products and sweeteners |
96.9 |
82.2 |
|
Root and tuber products |
61.1 |
50.3 |
|
Hides and skins |
60.0 |
30.0 |
|
Dairy and egg products |
36.9 |
29.1 |
|
United States |
|
|
|
Cassava starch |
40.1 |
38.0 |
|
Malt of barley |
38.1 |
36.9 |
|
Dairy and egg products |
39.7 |
33.6 |
|
Sugar products and sweeteners |
36.1 |
31.2 |
a Tariff wedge measures the difference between tariffs in primary and processed stages, calculated as T-t, where t stands for tariff at the primary stage and T for tariff at the processed stage.
Source: Lindland (1997).
Similar results were obtained in a study conducted by the OECD in 1996. The study pointed out that in the OECD countries in general tariffs are not reduced more for processed than for basic agricultural products. A recent UNCTAD study (UNCTAD, 2003) evaluated tariff escalation for 12 agricultural commodity groups by averaging nominal tariffs by major groups and by processing stage in the Quad (Canada, the EU, Japan, and the US) markets. It was noticed that, with a few exceptions, post-UR tariffs escalate not only between raw and semi-finished but also, where appropriate, between semi-finished and finished products. On average, the escalation in Canada and Japan and the EU is higher between raw and finished, while in the United States the highest average escalation is found between semi-finished and finished goods.
Some of the studies have examined tariff escalation in markets of both developing and developed countries. A recent USDA study, calculating simple average of bound MFN tariffs for a number of agricultural commodity groupings by region, has shown that tariff escalation in agricultural markets exists in both developed and developing countries.[82] UNCTAD (2003) reached similar results.
Notwithstanding the progress that has been made in assessing tariff escalation across commodities and countries, much scope for improvement remains. There are several areas where more improvements may be particularly useful.
First, most of the past studies assessing the impact of the Uruguay Round on tariff escalation have used bound tariffs. This has the advantage of providing a measure of tariff escalation WTO members have negotiated. However, actual applied tariffs are often much below the bound rates. In addition, tariff preferences, which operate for various groups of countries, are often ignored. This is mostly because such data have not been available in a form that analysts could readily use. A recent study by Chevassus-Lozza and Gallezot (2003) shows that tariff escalation in the EU is lower when tariff preferences are taken into account. Therefore, analysing escalation in applied tariffs would be necessary, particularly in view of the presence of tariff preferences from which a large number of developing countries benefit.
Second, findings on incidence of tariff escalation differ significantly between studies employing different levels of commodity and country aggregations. Averages of tariffs by major commodity groups and/or by importing region or country groups provide, however, an incomplete picture of level of protection accorded by existing tariff structure. Such averages conceal significant tariff escalation at the product-by-product pairs. A more disaggregated analysis is required to arrive at representative indicators of tariff escalation.
Furthermore, there is a need to assess impact of tariff escalation on trade of processed products. Most of the studies focus on assessing the magnitude and change in tariff escalation and less on what the impact of the escalating tariffs would be on the structure of trade. OECD (1996), UNCTAD (2003) and Rae and Josling (2003) are among the few studies that assess the effect of changes in tariff structures on exports of processed products from developing countries. Simulation results in these studies have shown that developing countries would accrue significant benefits from liberalization of processed products compared with primary products. Overall, what matters is the magnitude of the effect of tariff escalation on production and trade flows: this would require not only assessing the protection it accorded to processing but also the impact it may have on trade structure.
To complement analyses of previous studies, this article examines escalation in bound as well as applied tariffs for selected agricultural commodity chains in the major developed and developing country markets. The previous studies have focused almost exclusively on bound tariffs. A simple approach has been adopted by measuring nominal tariff wedges for selected commodity chains, at a highly disaggregated level and mostly at the first stage of processing. Lack of detailed data precludes the estimation of the effective rate of protection for the selected commodities.
The choice of countries reflects the major importers of agricultural products, i.e. the Quad countries. In addition, the major four or five developing country importers are included when information on relevant product chains is readily available.[83] The selected commodity chains include both basic food products, which are predominantly temperate-zone products, and tropical and horticultural products. Specific tariffs are converted to ad valorem rates using Agricultural Market Access Database (AMAD) data on world unit values and exchange rates.
Annex tables 1 and 2 draw on data from AMAD and WITS database. The tables report simple averages of applied and final bound MFN tariffs countries apply to primary and processed forms of the selected commodities. It should be noted that data on applied tariffs are for the year 1999 or before, while final bound MFN tariffs represent the rates that should be reached by the end of the implementation period of tariff reduction commitment under the Uruguay Round Agreement on Agriculture - 2000 for developed countries and 2004 for developing countries. This may explain the few cases where applied MFN rates were higher than the bound rates as, for example, in the case of raw sugar in Japan.
Three broad observations can be drawn from tariff data in Annex tables 1 and 2.
Tariff escalation prevails in a large number of commodity chains. Comparing tariffs of the selected commodities at the different stages, it is clear that nominal tariff escalation affects many commodities, and this is true for both bound and applied tariffs. Of the 16 commodity chains examined, 12 suffer from tariff escalation, mostly at the first stage of processing, across the selected countries. The majority (nearly 60 percent) of tariff escalation pairs have tariff wedges between 1 and 10 percent, while about 10 percent have tariff wedges exceeding 50 percent.
Tariff escalation is higher in the case of bound than applied tariffs. As expected applied tariffs in almost all countries are, on average, lower than bound tariffs, and in several cases this difference is very large. As a result nominal wedges of applied tariffs for all the examined commodity chains in the Quad group, apart from a few exceptions, are low compared with bound rates (Figure 2).
Tariff escalation exists in both basic food commodities and tropical and horticultural products. Of the nine basic food commodities included in the study, wheat, groundnuts and rice are the only commodities where the existence of escalating tariffs is fairly limited in the Quad countries (Annex Table 1). When escalation exists in these products, it tends to be relatively weak and in most cases, tariff de-escalation, i.e. tariff protection declining with processing, is observed. As for livestock and meat (cattle, sheep and pigs), sugar and soybeans, tariffs vary greatly between countries and tariff escalation is common.
Figure 2: Average tariff wedge in QUAD countries
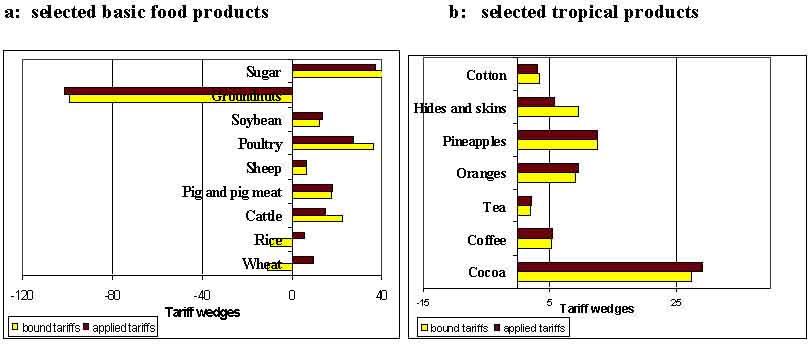
Tariff escalation is more visible in agricultural raw materials and horticultural products (Annex Table 2). It is worth noting that while tropical products generally face lower tariffs compared with basic food commodities, the wedge between tariffs at their primary and processed stages tend to be higher than in basic food commodities. In cocoa, while the average tariffs on cocoa beans is zero in the Quad countries, the bound rates on chocolate are considerably higher, above 20 percent in the EU, Japan and Canada. Coffee, hides and skins and cotton exhibit similar high tariff escalation. In oranges, tariff escalation is more pronounced in the EU, while for the rest of the countries tariffs are generally high but with relatively weak escalation along the processing chain. In the case of tea tariff escalation does not seem to exist in almost all countries apart from Japan.
Applied tariffs show escalation in some developing countries. As Annex tables 1 and 2 show, tariff escalation exists in both developed and developing countries. In developing countries, represented by 4-5 major importers of the particular commodity for which data were available, tariffs vary greatly between countries and applied tariffs are much lower than bound rates. Tariff escalation in these countries is more apparent in applied than bound rates and, on average, occurred in 15 out of the 16 commodity chains examined. These tariffs are often imposed for development or revenue-raising reasons.[84]
Import tariffs decline significantly once account has been taken of the preferences that developing countries receive. Average applied tariffs as presented in Annex tables 1 and 2 are based on applied MFN rates only. Drawing on available data from the World Integrated Trade Solution (WITS) database, average applied tariffs for the EU were estimated taking into account tariff preferences under Generalized System of Preferences (GSP) and African, Caribbean and Pacific Group (ACP) preference regimes (Annex tables 3 and 4).
Annex tables 3 and 4 provide snapshot of the structure of EU agricultural tariffs taking into account the GSP and ACP preference regimes. The results show that in 11 out of the 16 examined product categories, tariff wedges are relatively lower under GSP and ACP regimes. This suggests that, compared with countries whose products face MFN tariffs in the EU market, preference-receiving developing countries are in a better competitive position in view of the relatively lower tariff wedges.
Tariff escalation has been raised as one of the important market access issues in the current WTO negotiations on agriculture. Thirteen out of the 45 country negotiating proposals asked for substantial reduction in tariff escalation, particularly in the developed country markets.[85] In these proposals, tariff escalation is considered a key market access problem faced by commodity exporters, and should thus be eliminated in order to help placing agricultural commodities on the same footing as other products in the international trading system.
The impact of further reduction of agricultural tariffs on tariff escalation will depend a great deal on the method to be used in reducing tariffs. Most of the country proposals addressing tariff escalation are suggesting the adoption of a harmonizing reduction formula that reduces higher tariffs by greater amounts, including tariff peaks, and eliminates tariff escalation.
Two points are critical when assessing the implications of tariff reduction proposals for tariff escalation: i) the change in the level of tariff escalation in importing countries as a result of tariff reduction; and ii) the influence this change may have on the structure of trade.
6.1 Impact on tariff escalation
The Draft of Modalities for the Further Commitments in the context of the ongoing WTO negotiations on agriculture (Harbinson proposal)[86] proposes a three-band reduction formula (four-band for developing countries).[87] This formula requires steeper cuts in higher tariffs, with the condition that where the tariff on a processed product is higher than the tariff for the product in its primary form, the rate of tariff reduction for the processed product shall be equivalent to that for the product in its primary form multiplied, at a minimum, by a factor of 1.3.
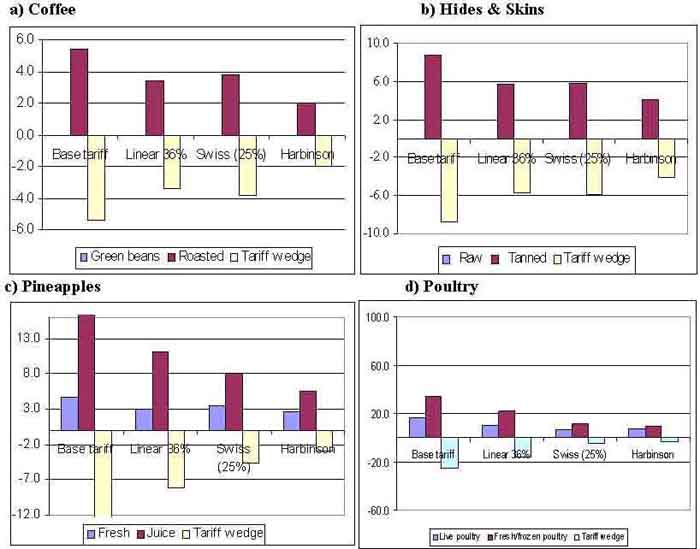
For comparison purposes, three different tariff reduction methods - linear, Swiss formula (25 percent) and Harbinson proposal formula - have been applied to the average bound MFN tariffs of selected products in the Quad countries. As shown in Figure 3 (see Annex), the adoption of Harbinson proposal and the "Swiss formula" appear to produce relatively more harmonized tariff levels than the linear formula, with the Harbinson formula producing the lowest tariff wedges. While the Harbinson proposal produces a significant reduction in tariff escalation, it appears to erode much of the preferential margins for developing countries. For instance, in the case of the EU's ACP regime the average preferential margin for 13 of the selected commodity groups will shrink from 8 percent to only 2.1 percent.
The Swiss formula seems to be more effective in reducing tariff escalation when the level of tariffs is generally high, as in the case of pineapples and poultry, more so than in the case of coffee and hides and skins (tropical products), where tariffs are relatively low but tariff escalation is high. It is very unlikely that the Swiss formula will achieve substantial reduction in tariff escalation in all commodities of export interest to developing countries, particularly tropical products, unless it involves some additional criteria for capping tariff wedges along the processing chain.
6.2 Implications for trade in processed products
The existence of escalating tariffs is neither a necessary nor a sufficient condition to establish a bias against processed goods (Yeats, 1984). The actual economic effects of tariff escalation on trade are affected by import demand elasticities for the goods in question. To account properly for the influence of escalating tariffs on the structure of trade, one must analyse changing conditions of demand at different levels of processing along the commodity chain. Since empirical studies show import demand elasticities normally increase with fabrication, constant tariffs will have relatively larger trade effects on fabricated commodities than on unprocessed commodities. Thus the higher the demand elasticity along the commodity processing chain, the higher would be the effect of escalating tariffs on processed commodity trade.
Using the UNCTAD-FAO Agricultural Trade Policy Simulation Model (ATPSM)[88] a simple exercise has been undertaken to simulate the effects of changes in tariff escalation, under the Harbinson proposal, on selected processed products. The model includes only a few processed products, namely, roasted coffee, cocoa butter, cocoa powder, chocolate and vegetable oils. Apart from oilseeds, existing tariffs on primary and processed forms of these products show a clear pattern of escalation. The model results for these products (Table 4) show a reduction in tariff wedges for coffee and cocoa products with sizeable increases in global exports of their processed forms, with gains in exports being relatively higher for developing countries and LDCs.
Table 4. ATPSM model results: impact of the Harbinson proposal on tariff wedges and export values of selected processed commodity products
| |
Base tariff wedge |
Tariff wedgea under Harbinson proposal |
Percentage change in export value |
|||
| |
World |
Developed countries |
Developing countries |
LDCs |
||
|
Coffee - green |
|
|
1.0 |
0.9 |
1.0 |
1.1 |
|
Coffee - roasted |
2.7 |
1.6 |
0.4 |
0.3 |
0.6 |
0.4 |
|
Cocoa beans |
|
|
0.3 |
0.3 |
0.3 |
0.3 |
|
Cocoa powder |
7.3 |
4.4 |
1.4 |
1.2 |
1.6 |
7.3 |
|
Cocoa butter |
-4.7 |
-5.7 |
1.1 |
0.6 |
1.3 |
n.a. |
|
Chocolate |
24.7 |
11.0 |
6.5 |
6.3 |
6.8 |
6.7 |
|
Oilseeds |
|
|
1.8 |
1.2 |
2.4 |
28.1 |
|
Vegetable oils |
-21.3 |
-8.4 |
4.6 |
2.2 |
5.0 |
6.1 |
a Tariff wedge measures the difference between tariffs in primary and processed stages, calculated as T-t, where t stands for tariff at the primary stage and T for tariff at the processed stage.
Source: ATPSM simulation results.
More elaborate analysis by expanding the number of processed products included in the ATPSM model would certainly help in providing a better perspective on the impact of tariff structure on processed agricultural trade.
Tariff escalation biases protection in both developed and developing countries against agricultural and labour-intensive products. This holds back export-led growth and greater diversification in developing countries and the poverty reduction that is associated with increased demand for unskilled labour.
Available evidence suggests that tariff escalation prevails in a large number of agricultural commodity chains in both developed and developing countries. It is more pronounced in commodity sectors such as meat, sugar, fruit, coffee, cocoa and hides and skins, most of which are of export interest to many of the poor developing countries.
Reducing tariff escalation is considered a critical element of the development dimension of the current round of multilateral trade negotiations, as it is seen to add considerably to the export potential of commodity exporting developing countries. Several issues of escalating tariff structure must be addressed when evaluating tariff reduction in the context of the multilateral reform of agriculture.
First, it should be noted that the economic significance of tariff escalation lies more in accurate assessment of the protection they create along the commodity chains, which depends not only on nominal tariffs imposed but also on the share of inputs in the value of final product. Assessing tariff escalation on the basis of tariff wedges only, particularly at higher levels of commodity aggregation, is not a reliable indicator of tariff escalation, as it may conceal considerable tariff wedge in certain product lines of export interest to many exporters of agricultural products.
Second, a distinction must be drawn between the level of tariff escalation and the bias that tariff escalation poses for processed commodity trade.[89] Though useful, the tariff wedge and ERP indicators, do not provide policy makers and trade negotiators very reliable information on the trade and welfare effects of tariff escalation. The mere comparison of nominal tariffs or effective tariffs at different stages of processing does not convey sufficient information on the relative importance of existing trade barriers. The optimal approach would be to assess the effects of the tariff structure on trade of the particular products. Thus, to account properly for the effect of tariff escalation, one must analyse changing conditions of demand at different levels of processing.
Third, efforts to reduce tariff escalation should take into account the implications for tariff preferences. The analysis of this article suggests that while the adoption of a harmonizing method such as that incorporated in the Harbinson proposal would result in greater reduction in tariff escalation than linear methods, it may lead to considerable erosion of tariff preferences like those under the GSP and ACP preference regimes.
In addition, tariff escalation will have to be evaluated in conjunction with other trade barriers, not captured by the tariff data, like tariff rate quota and special safeguards.
References
AMAD (Agricultural Marketing Access Database). http://www.amad.org
Chevassus-Lozza, E. & Gallezot, J. 2003. Preferential agreements - tariff escalation: what are the consequences of the multilateral negotiations for the access of developing countries to the European Market? Paper presented at the International Conference on Agricultural Policy Reform and the WTO: Where are we heading? Capri, Italy, June 2003.
Corden, W.M. 1966. The Structure of a Tariff System and the Effective Protection Rate, Journal of Political Economy, 74:221-37.
FAO. 2002. FAO papers on selected issues relating to the WTO negotiations on agriculture. Rome.
FAO. 2003. Major policy issues and market factors having implications for the long-term performance of agricultural exports. Document CCP 09/03.
FAO-UNCTAD. 2003. ATPSM (Agricultural Trade Policy Simulation Model).
Greenaway, D. & Milner, C. 2003. Effective protection, policy appraisal and trade policy reform, The World Economy, 26: No. 4, April 2003.
International Customs Tariffs Bureau. 2000. The International Customs Journal, European Union, Number 14, (22nd Edition).
Laird, S. & Yeats, A. 1987. Tariff cutting formulas and complications. In J.M. Finger and A. Olechowski eds. The Uruguay Round: A handbook on the multilateral trade negotiations. World Bank, Washington DC.
Lindland, J. 1997. The impact of the Uruguay Round on tariff escalation in agricultural products. FAO Commodities and Trade Division, ESCP No.3, Rome.
OECD. 1996. Tariff escalation and the environment (OECD/GD(96/171), Paris.
OECD. 1997. The Uruguay Round Agreement on Agriculture and processed agricultural products. Paris.
Poonyth, D. & Sharma, R. 2003. The impact of the WTO negotiating modalities in the areas of domestic support, market access and export competition on developing countries: results from ATPSM. Paper presented at the International Conference on Agricultural Policy Reform and the WTO: Where are we heading? Capri, Italy June 2003.
Rae A. & Josling, T. 2003. Processed food trade and developing countries: protection and trade liberalization. Food policy 28:147-166.
UNCTAD. 2003. Back to basics: market access issues in the Doha Agenda. United Nations, New York and Geneva (UNCTAD/DITC/TAB/Misc.9).
UNCTAD/WTO. 1999. The post-Uruguay Round tariff environment for developing country exports, UNCTAD/WTO Joint Study.
USDA Economic Research Service. 2001. Profiles of tariffs in global agricultural markets, AER-796, USDA, Washington, DC.
World Bank.1994. Global Economic Prospects 1994. World Bank, Washington.
World Bank,. 2003. World Integrated Trade Solution (WITS).
WTO. 1996. Tariff escalation: WTO Committee on Trade and Environment.
WTO. 2003. Negotiations on agriculture: First draft of Modalities for the further commitments: WTO Committee on Agriculture and Negotiations on agriculture: First draft of modalities for the further commitments - revision. Committee on Agriculture Special Session. (N/AG/W/1/Rev.1), 18 March 2003.
Yeats, A. 1984. On the analysis of tariff escalation: is there a methodological bias against the interest of developing countries? Journal of Development Economics, May June August 15(1,2,3):77-88.
Annex
Table 1. Average bound and applied tariffs and nominal tariff wedges (TW) in the major importing developed and developing countries: selected basic food commodities
|
Product a |
Average final bound MFN tariffs b |
Average applied MFN tariffs c |
||||||||
|
US |
EU |
Japan |
Canada |
Major 4 - 5 importing developing countries d |
US 1999 |
EU 2000 |
Japan 1999 |
Canada 1998 |
Major 4 - 5 importing developing countries d |
|
|
Wheat |
|
|
|
|
|
|
|
|
|
|
|
Durum |
4.2 |
69.5 |
321.9 |
31.7 |
48.2 |
4.0 |
69.5 |
32.3 |
33.5 |
2.5 |
|
Meal/flour |
1.5 |
74.6 |
291.3 |
16.5 |
77.8 |
1.8 |
74.6 |
83.2 |
17.6 |
11.5 |
|
- TW |
-2.7 |
5.1 |
-30.6 |
-15.2 |
29.6 |
-2.2 |
5.1 |
50.9 |
-15.9 |
9 |
|
Rice |
|
|
|
|
|
|
|
|
|
|
|
Husk/husked |
5.1 |
61.9 |
1069.2 |
0 |
96.0 |
5.7 |
61.9 |
92.7 |
0 |
10.7 |
|
Glazed/polished |
5.6 |
89.7 |
1003.4 |
0.8 |
96.0 |
6.1 |
89.7 |
87.0 |
0 |
12.8 |
|
- TW |
0.5 |
27.8 |
-65.8 |
0.8 |
0 |
0.4 |
27.8 |
-5.7 |
0 |
2.1 |
|
Cattle |
|
|
|
|
|
|
|
|
|
|
|
Live |
0.5 |
35.9 |
119.0 |
0 |
18.1 |
0.3 |
35.9 |
81.7 |
0 |
4.0 |
|
Fresh/frozen meat |
13.5 |
128.6 |
50.0 |
13.2 |
39.6 |
8.8 |
128.6 |
40.0 |
0 |
15.0 |
|
- TW |
13 |
92.7 |
-69.0 |
13.2 |
21.5 |
8.5 |
92.7 |
-41.7 |
0 |
11 |
|
Pig & Pig meat |
|
|
|
|
|
|
|
|
|
|
|
Live swine |
0 |
20.0 |
40.5 |
0 |
20.0 |
0 |
20.0 |
41.8 |
0 |
12.3 |
|
Fresh/frozen pork |
0.3 |
28.0 |
83.6 |
0 |
30.0 |
0.3 |
28.0 |
86.3 |
0 |
27.5 |
|
- TW |
0.3 |
8.0 |
43.1 |
0 |
10.0 |
0.3 |
8.0 |
45.5 |
0 |
15.2 |
|
Sheep and sheep meat |
|
|
|
|
|
|
|
|
|
|
|
Live sheep |
0 |
42.8 |
0 |
0.2 |
15.0 |
0 |
42.8 |
0 |
0 |
7.6 |
|
Fresh/frozen mutton |
0.9 |
88.7 |
0 |
1.3 |
15.0 |
0.9 |
88.7 |
0 |
1.1 |
9.0 |
|
- TW |
0.9 |
45.9 |
0 |
1.1 |
0 |
0.9 |
45.9 |
0 |
1.1 |
1.4 |
|
Poultry |
|
|
|
|
|
|
|
|
|
|
|
Live poultry |
1.0 |
10.4 |
0 |
96.3 |
22.0 |
1.0 |
10.4 |
0 |
51.2 |
7.2 |
|
Fresh/frozen poultry |
10.0 |
39.5 |
8.2 |
123.0 |
41.8 |
10.2 |
39.5 |
7.9 |
88.2 |
22.5 |
|
- TW |
9 |
29.1 |
8.2 |
26.7 |
19.8 |
9.2 |
29.1 |
7.9 |
37.0 |
15.3 |
|
Soybeans |
|
|
|
|
|
|
|
|
|
|
|
Seeds |
0 |
0 |
0 |
0 |
88.3 |
0 |
0 |
0 |
0 |
18.9 |
|
Crude oil |
19.1 |
4.8 |
20.7 |
4.8 |
81.1 |
19.7 |
4.8 |
22.7 |
5.5 |
29.9 |
|
- TW |
19.1 |
4.8 |
20.7 |
4.8 |
-7.2 |
19.7 |
4.8 |
22.7 |
5.5 |
11 |
|
Groundnuts |
|
|
|
|
|
|
|
|
|
|
|
Seeds |
56.8 |
0 |
366.0 |
0 |
47.5 |
57.8 |
0 |
377.0 |
0 |
25.2 |
|
Crude Oil |
8.8 |
4.8 |
9.8 |
4.8 |
98.0 |
9.0 |
4.8 |
11.4 |
5.5 |
14.3 |
|
- TW |
-48 |
4.8 |
-356.2 |
4.8 |
50.5 |
-48.8 |
4.8 |
-365.6 |
5.5 |
-10.9 |
|
Sugar |
|
|
|
|
|
|
|
|
|
|
|
Raw |
32.8 |
134.7 |
224.9 |
6.5 |
62.1 |
33.8 |
134.7 |
231.5 |
5.9 |
24.7 |
|
Refined |
42.5 |
161.1 |
328.1 |
8.6 |
66.0 |
43.8 |
161.1 |
242.5 |
7.5 |
29.5 |
|
- TW |
9.7 |
26.4 |
103.2 |
2.1 |
3.9 |
10 |
26.4 |
11 |
1.6 |
4.8 |
Source: FAO staff calculations, based on Agricultural Market Access Database (AMAD); WTO country schedules of commitments in goods; the International Customs Journal, EU - 1999-2000, 22nd edition; and World Integrated Trade Solution (WITS), General Database Information, World Bank/UNCTAD
Table 2. Average bound and applied tariffs in the major importing developed and developing countries: selected raw material and horticultural products
|
Product a |
Average final bound MFN tariffs b |
Average applied MFN tariffs c |
||||||||
|
US |
EU |
Japan |
Canada |
Major 4 - 5 importing developing countries d |
US 1999 |
EU 2000 |
Japan 1999 |
Canada 1998 |
Major 4 - 5 importing developing countries d |
|
|
Cocoa |
|
|
|
|
|
|
|
|
|
|
|
Beans |
0 |
0 |
0 |
0 |
32.0 |
0 |
0 |
0 |
0 |
9.5 |
|
Paste |
0.1 |
9.6 |
7.5 |
0 |
33.3 |
0.1 |
10.0 |
9.0 |
0 |
10.6 |
|
- TW e |
0.1 |
9.6 |
7.5 |
0 |
1.3 |
0.1 |
10.0 |
9.0 |
0 |
1.1 |
|
Chocolate |
14.7 |
21.1 |
21.3 |
52.8 |
44.3 |
17.7 |
21.1 |
23.6 |
54.2 |
16.6 |
|
- TW |
14.6 |
11.5 |
13.8 |
52.8 |
11.0 |
17.6 |
11.1 |
14.6 |
54.2 |
6.0 |
|
Coffee |
|
|
|
|
|
|
|
|
|
|
|
Green |
0 |
0 |
0 |
0 |
39.8 |
0 |
0 |
0 |
0 |
24.8 |
|
Roasted |
0 |
9.0 |
12.0 |
0.4 |
32.7 |
0 |
9.0 |
13.0 |
0 |
29.3 |
|
- TW |
0 |
9.0 |
12.0 |
0.4 |
-7.1 |
0 |
9.0 |
13.0 |
0 |
4.5 |
|
Black Tea |
|
|
|
|
|
|
|
|
|
|
|
Bulk |
0 |
0 |
6.7 |
0 |
81.8 |
0 |
0 |
7.0 |
0 |
25.5 |
|
Other |
0 |
0 |
14.5 |
0 |
83.8 |
0 |
0 |
15.5 |
0 |
26.6 |
|
- TW |
0 |
0 |
7.8 |
0 |
2.0 |
0 |
0 |
8.5 |
0 |
1.1 |
|
Oranges |
|
|
|
|
|
|
|
|
|
|
|
Fresh |
3.5 |
16.7 |
24.0 |
0 |
41.0 |
3.7 |
16.7 |
25.0 |
0 |
23.7 |
|
Juice |
6.8 |
44.1 |
28.1 |
1.0 |
41.0 |
6.9 |
44.1 |
31.9 |
1.0 |
25.7 |
|
- TW |
3.3 |
27.4 |
4.1 |
1.0 |
0 |
3.2 |
27.4 |
6.9 |
1.0 |
2.0 |
|
Pineapple |
|
|
|
|
|
|
|
|
|
|
|
Fresh |
1.2 |
5.8 |
12.1 |
0 |
38.2 |
1.3 |
5.8 |
13.0 |
0 |
19.8 |
|
Juice |
4.1 |
33.0 |
32.3 |
0 |
42.2 |
4.4 |
33.0 |
32.3 |
0 |
25.4 |
|
- TW |
2.9 |
27.2 |
20.2 |
0 |
4.0 |
3.1 |
27.2 |
20.2 |
0 |
5.6 |
|
Hides & skins |
|
|
|
|
|
|
|
|
|
|
|
Raw |
0 |
0 |
0 |
0 |
20.9 |
0 |
0 |
0 |
0 |
4.1 |
|
Tanned |
3.0 |
5.4 |
23.5 |
6.3 |
30.3 |
2.9 |
5.4 |
14.9 |
0 |
6.7 |
|
- TW |
3.0 |
5.4 |
23.5 |
6.3 |
9.4 |
2.9 |
5.4 |
14.9 |
0 |
2.6 |
|
Cotton |
|
|
|
|
|
|
|
|
|
|
|
Lint |
11.3 |
0 |
0 |
0 |
41.0 |
8.7 |
0 |
0 |
0 |
4.3 |
|
Yarn |
8.3 |
4.0 |
4.7 |
8.0 |
52.7 |
6.8 |
4.8 |
4.1 |
5.3 |
12.9 |
|
- TW |
-3.0 |
4.0 |
4.7 |
8.0 |
11.7 |
-1.9 |
4.8 |
4.1 |
5.3 |
8.6 |
Notes:
a For the Harmonized System (HS) levels covered, see Box 1.
b The bound and applied rates are simple averages, mostly at the 6-digit of the Harmonized System (HS), after excluding tariff lines that are not corresponding between bound and applied schedules. Specific rates are converted to ad valorem rates using AMAD's data on world unit values and exchange rates. The world import unit values were defined at the 6-digit HS level.
c Applied rates are taken from AMAD - 1999 for Japan and the US; 1998 for Canada; and various years from 1995 to 1999 for the developing countries. For the EU, however, applied rates are for the year 2000 and are estimated from The International Customs Journal, EU - 1999-2000, 22nd edition.
d For developing countries included in the analysis, see Box 2. e Only ad valorem tariffs are considered.
e Tariff wedge measures the difference between tariffs in primary and processed stages, calculated as T-t, where t stands for tariff at the primary stage and T for tariff at the processed stage.
Source: FAO staff calculations, based on Agricultural Market Access Database (AMAD); WTO country schedules of commitments in goods; the International Customs Journal, EU - 1999-2000, 22nd edition; and World Integrated Trade Solution (WITS), General Database Information, World Bank/UNCTAD.
Table 3. EU: average MFN tariffs and average tariffs under GSP and ACP preference regimes, 2000
|
Product |
MFN |
GSP |
ACP (out of quota) |
|
Wheat |
|
|
|
|
Durum |
69.5 |
69.5 |
69.5 |
|
Meal/flour |
74.6 |
74.6 |
60.8 |
|
- TW a |
5.1 |
5.1 |
-8.7 |
|
Rice |
|
|
|
|
Husk/husked |
300.7 |
300.7 |
298.1 |
|
Glazed/polished |
136.0 |
136.0 |
136.0 |
|
- TW |
-164.7 |
-164.7 |
-162.1 |
|
Cattle |
|
|
|
|
Live |
35.9 |
35.9 |
31.7 |
|
Fresh/frozen meat |
128.6 |
128.6 |
97.1 |
|
- TW |
92.7 |
92.7 |
65.4 |
|
Pig & Pig meat |
|
|
|
|
Live swine |
16.0 |
16.0 |
13.6 |
|
Fresh/frozen pork |
32.0 |
32.0 |
32.0 |
|
- TW |
16.0 |
16.0 |
18.4 |
|
Sheep and sheep meat |
|
|
|
|
Live sheep |
63.8 |
63.8 |
0 |
|
Fresh/frozen mutton |
88.7 |
88.7 |
67.9 |
|
- TW |
24.9 |
24.9 |
67.9 |
|
Poultry |
|
|
|
|
Live poultry |
10.4 |
10.4 |
8.8 |
|
Fresh/frozen poultry |
39.5 |
39.5 |
39.5 |
|
- TW |
29.1 |
29.1 |
30.7 |
|
Soybeans |
|
|
|
|
Seeds |
0 |
0 |
0 |
|
Crude oil |
4.8 |
4.1 |
0 |
|
- TW |
4.8 |
4.1 |
0 |
|
Groundnuts |
|
|
|
|
Seeds |
0 |
0 |
0 |
|
Crude oil |
4.8 |
4.4 |
0 |
|
- TW |
4.8 |
4.4 |
0 |
|
Sugar |
|
|
|
|
Raw |
134.7 |
134.7 |
134.7 |
|
Refined |
161.1 |
161.1 |
161.1 |
|
- TW |
26.4 |
26.4 |
26.4 |
a Tariff wedge measures the difference between tariffs in primary and processed stages, calculated as T-t, where t stands for tariff at the primary stage and T for tariff at the processed stage.
Source: WITS, 2003.
Table 4. EU: average MFN tariffs and average tariffs under GSP and ACP preference regimes, 2000
|
Product |
MFN |
GSP |
ACP (out of quota) |
|
Cocoa |
|
|
|
|
Beans |
0 |
0 |
0 |
|
Chocolate |
43.0 |
40.0 |
10.0 |
|
- TW a |
43.0 |
40.0 |
10.0 |
|
Coffee |
|
|
|
|
Green |
0 |
0 |
0 |
|
Roasted |
9.0 |
3.1 |
0 |
|
- TW |
9.0 |
3.1 |
0 |
|
Black Tea |
|
|
|
|
Bulk |
0 |
0 |
0 |
|
Other |
0 |
0 |
0 |
|
- TW |
0 |
0 |
0 |
|
Oranges |
|
|
|
|
Fresh |
16.7 |
16.7 |
3.1 |
|
Juice |
34.9 |
24.7 |
13.6 |
|
- TW |
18.2 |
8 |
10.5 |
|
Pineapple |
|
|
|
|
Fresh |
5.8 |
4.9 |
0 |
|
Juice |
34.9 |
23.2 |
0 |
|
- TW |
29.1 |
18.3 |
0 |
|
Hides & skins |
|
|
|
|
Raw |
0 |
0 |
0 |
|
Tanned |
5.4 |
4.4 |
0 |
|
- TW |
5.4 |
4.4 |
0 |
|
Cotton |
|
|
|
|
Lint |
0 |
0 |
0 |
|
Yarn |
4.0 |
3.9 |
0 |
|
- TW |
4.0 |
3.9 |
0 |
a Tariff wedge measures the difference between tariffs in primary and processed stages, calculated as T-t, where t stands for tariff at the primary stage and T for tariff at the processed stage.
Source: WITS, 2003.
Figure 3. Changes in average tariffs in Quad countries under different tariff reduction methods
Source: FAO staff calculations, based on Agricultural Market Access Database (AMAD), and WTO country schedules of commitments in goods.
Notes:
1. The figures above show impact on average tariff of the selected products in the Quad countries by applying three possible tariff reduction formulae. The formulae are as follows:
|
Formula |
Mathematical Expression |
|
a. Linear cut |
t1 = t0 * (1 - 0.36) |
|
b. Swiss formula, with a coefficient of 25 % |
t1 = (a*t0)/(a + t0); a is a parameter = 0.25 |
|
c. Harbinson formula |
t1 = t0 * (1 - R), where R = 0.6 for t0 > 90; 0.5 for 90 £ t0 ³ 15; and 0.4 for t0 < 15. In the case of a processed product with a higher tariff than for its primary form, R is equal to the tariff on the primary form multiplied by 1.3 where t0 = base tariff and t1 = new tariff. |
2. Tariff wedge, as defined here, measures the difference between tariffs in primary and processed stages, calculated as t - T, where t stands for tariff at the primary stage and T for tariff at the processed stage. Thus, high negative value of the wedge indicates high tariff escalation.
|
Box 1: Product coverage, by HS code |
|
|
Wheat Durum: 100110, 100190 |
Groundnuts |
|
Box 2. Developing country coverage |
|||
|
The major 4-5 importing developing countries of each of the commodity chains considered by the study, and for which data were available, include: |
|||
|
Cattle: |
Mexico, Indonesia, Philippines, Egypt, Brazil |
Sugar: |
Indonesia, India, Philippines, Republic of Korea, Morocco |
|
Pigs: |
Singapore, Mexico, Philippines, Republic of Korea, Thailand |
Pineapples: |
Republic of Korea, Argentina, Philippines, Mexico, Brazil |
|
Sheep: |
Nigeria, Bahrain, Mexico, Côte d'Ivoire |
Oranges: |
Morocco, Egypt, Argentina, Brazil, Uruguay |
|
Poultry: |
Singapore, Brazil, Indonesia, Thailand, Turkey |
Cocoa: |
Mexico, Brazil, Republic of Korea, Philippines, Argentina |
|
Wheat: |
Brazil, Egypt, Indonesia, Republic of Korea, Pakistan, Philippines |
Coffee: |
Republic of Korea, Argentina, Morocco, Mexico |
|
Rice: |
Indonesia, Brazil, Republic of Korea, Jamaica, Peru |
Tea: |
Morocco, India, Indonesia, Argentina, Pakistan |
|
Soybeans: |
Pakistan, India, Brazil, Morocco |
Hides & skins: |
Mexico, Indonesia, Republic of Korea Brazil |
|
Groundnuts: |
Thailand, India, Brazil, Singapore |
Cotton: |
Indonesia, Mexico, India, Thailand, Republic of Korea |
|
Dairy: |
Brazil, Mexico, Singapore, Philippines |
|
|
|
[77] OECD (1996). [78] Malaysia and Chile are examples of developing countries that have succeeded in diversifying their agricultural exports. [79] For a detailed description of dependence on agricultural commodity exports, see FAO (2002). [80] In 1996, for example, four companies accounted for 50 percent of roasted coffee. and the number of cocoa trading houses in London decreased from 30 in 1980 to about ten in 1999. Similarly, the six largest chocolate manufacturers account for half of world chocolate sales. For vegetable oils, following mergers and acquisitions in the 1990s, a small number of MNEs now dominate the production, distribution and trade in oilseeds and oils. For grains, a few big companies have become vertically integrated businesses in trading, storage, processing and milling (see FAO 2003). [81] ERP was first articulated by Corden (1966). [82] USDA (2001). [83] See Box 2 for lists of developing countries selected for each commodity chain. [84] Article XVIII of GATT 1947 recognizes the need of countries in the early stages of development to maintain sufficient flexibility in their tariff structure to be able to grant tariff protection required for the support of their infant industries. [85] See, for example, the negotiating proposals of the African group (G/AG/NG/W/142); ASEAN (G/AG/NG/W/55); Cairns Group (G/AG/NG/W/54 and 93); US (G/AG/NG/W/15); CARICOM (G/AG/NG/W/100); Canada (G/AG/NG/W/12); Developing country grouping (G/AG/NG/W/13). [86] WTO (2003). [87] The Harbinson Draft proposed reducing tariff in equal annual instalments over a period of [five] years, applying the following formula: (i) For all agricultural tariffs greater than [90 percent ad valorem] the simple average reduction rate shall be [60] percent subject to a minimum cut of [45] percent per tariff line. (ii) For all agricultural tariffs lower than or equal to [90 percent ad valorem] and greater than [15 percent ad valorem] the simple average reduction rate shall be [50] percent subject to a minimum cut of [35] percent per tariff line. (iii) For all agricultural tariffs lower than or equal to [15 percent ad valorem] the simple average reduction rate shall be [40] percent subject to a minimum cut of [25] percent per tariff line. (iv) For developing countries, a four-band formula, with less
reduction rates was also suggested (see WTO (2003) TN/AG/W/1/Rev.1), p.
4. |
![]()
![]()
![]()
)