![]()
![]()
![]()
Mike Dillon and Robin Keates
Humber Institute of
Food & Fisheries, Grimsby, United Kingdom of Great Britain and
Northern Ireland
Kate Conway
Youngs Bluecrest, Grimsby,
United Kingdom of Great Britain and Northern Ireland
ABSTRACT
The manufacturing workforce undertakes operations that are increasingly complex. This labour intensive sector is characteristically heavily reliant on the effectiveness of its human resources to underpin productivity. The Humber Food Centre of Vocational Excellence (CoVE) is a responsive partnership that provides frontline management with focused techniques, information and education customised to business needs. The variety of support methods on offer include training in-factory, "digital factory" training facilities, internationally adopted software tools and dedicated workplace delivery. United Nations Industrial Development Organization (UNIDO) software provides a standardised approach to recording projects which can maximize return from capital, plant and machinery, highlighting performance and revealing potential improvement areas. The project-based programmes help key workers and management to understand the implications and benefits of selected change, and encourage full participation and commitment from these personnel. Projects are already showing real economic and quality benefits to the participating businesses. The CoVE has also been successful in driving new product development projects in the Humber region through the provision of training support in new-product development and utilisation of the dedicated new product development centre.
SKILL GAPS IN MODERN FISH MANUFACTURING
In fish manufacturing, the work force undertakes daily operations that have become increasingly complex. Fish manufacturing is a labour intensive sector and is therefore characteristically heavily reliant on the effectiveness of its human resources to underpin business productivity. This weighted reliance on personnel creates a need for higher skilled operatives and technicians.
The competitiveness of the UK Food Manufacturing Industry is currently a major concern. An International Benchmarking Study (FDNTO, 1998) found that the UK food industry is on average nearly 10% lower than the EU, USA and Japan in terms of operational effective efficiency. Key areas for improvement were identified as changeover times, downtime, output rates, wastes & skills shortages. These problems are of particular significance when the importance of food manufacturing to the local economy is considered.
Employment within the "Manufacture of Food Products & Beverages" sector constitutes 16.3% of employment in North East Lincolnshire, 5% in Hull and 5.8% in North Lincolnshire. There is a manufacturing cluster within the Humber region that represents 8.2% of local employment or over 23 000 jobs. The relative size of the labour market also has a bearing, with food commonly identified as a key strategic sector for support through both the Humber Sub-Regional Economic Strategy and the Regional Development Agency's Cluster Strategy.
The relative deficit of Level 3 (pre-degree) skills within the food sector points to the need for training. There is a particular need for higher level craft and technical skills provision in order to underpin overall operational effectiveness and efficiency within the sector. The food sector, in contrast to national projections, has shown growth as the sector consolidates. This growth has contributed to the tightening in the labour market and is now manifesting itself in terms of skill/labour shortages in the higher order jobs, thereby stimulating a demand. Moreover, for every job lost, a new higher order job is created as the sector moves to higher levels of mechanisation. These issues are not unique to the Humber. Nationally, both policy makers and industrial spokespeople are raising concerns over the capacity of the sector and the need for better qualified entrants and more highly skilled operational staff in what is now one of the most competitive sectors in the country.
The main areas of skills support requirements within the food manufacturing sector have been identified in several key reports. These include the national and regional Foresight Programmes (Food Manufacturing), the Food Faraday Initiative, the Yorkshire and Humber Skills Action Plan, the Regional Food Cluster Strategy, and finally local household surveys. The priority skills shortages/training needs which emerge from these reports include:
Production management skills
Project management skills
Business improvement skills
Engineering skills - specifically multi-skilling
Product development skills- including up-skilling chefs
THE CENTRE OF VOCATIONAL EXCELLENCE IN FOOD MANUFACTURING
The UK Government has developed the "Centre of Vocational Excellence" (CoVE) strategy to drive improvement in up-skilling target sectors of the work-force at supervisory level to agreed national standards. CoVEs now exist in many different sectors of industry in the UK and are mostly physically situated in the geographical region where the client industry is based.
The Centre of Vocational Excellence (CoVE) in Food Manufacturing was initiated in November 2002 in Grimsby in the Humber region. The CoVE was a joint initiative of three Humber-based education institutes - Grimsby College, North Lindsey College and Hull College. Staff members were recruited by the beginning of 2003 from these colleges. Each college provides suitably qualified trainers and assessors to provide expertise to the local companies involved in the project.
The main target group for the Humber Food CoVE is the production workforce and junior management/line technicians involved in food processing operations within the Humber region. Many are line operatives in a production process typified by small batch production, subject to line-changeover issues and shift pattern production. Team leaders, mechanics/fitters and technicians are employed in each shift to maintain productivity. These individuals, who are charged with maintaining productivity, constitute the critical target group to up-skill, both in terms of those already employed in these roles and those who wish to move into them. The CoVE targets both male and female learners, those people in employment but unqualified and the unemployed who wish to progress to team leader/technician roles within the industry.
CoVE project set-up
A project-based approach was adopted to ensure that the new skills gained through training were applied and potential impacts on the participating businesses captured. Training standards provided by the National Training Organization were reviewed and selected. Staff members were trained in delivery of the National Vocational Qualification (NVQ) Level 3 modules in Food and Drink Manufacturing, Engineering and Business Improvement. The team was also trained in the use of internationally adopted software tools for monitoring manufacturing improvement. A standard approach was employed for measuring the skill levels and factory efficiency.
CoVE organization
A three level system was employed for the organisational structure with clear roles and responsibilities for all the stakeholders.
Level 1 is the Steering Group, which contains representatives from the users (industry), suppliers (institutes, private sector, sector skills council) and donors (LSC, Regional Development Group). The executive board of the steering group includes the Chairman (from industry) and the Secretary, who is also the Food CoVE Manager. The key responsibilities at this level include monitoring progress, financial review and strategic direction.
Level 2 is the Working Group, which consists of the Food CoVE Manager, a Coordination Unit and the institute partners. The coordination team was provided by the lead college, who are responsible for the coordination of the objective assessment improvement projects within the CoVE project and also for the dissemination of benchmarking activities in operational efficiency. The Food CoVE Manager chairs this group, gives day-to-day technical direction, co-ordinates trials of and training in the IT tools and reports to the Steering Group. The institute partners in the Working Group are individually responsible for delivering their allocated work packages.
Level 3 consists of the external quality assurance checks provided by the National Verification Scheme to ensure that the skills training delivered by the Food CoVE meets the approved standards. This is achieved by inspecting the portfolios of evidence created by the students in the workplace.
CoVE project management and control
The Steering Group exercises control of the project through regular reports on progress in line with the project plan. This is accompanied by continual financial review and scrutiny of new and proposed assets and their use. The Secretary briefs the Steering Group on key issues and the Co-ordination Unit also circulates a report. An exception report is issued when significant variation arises between actual and planned delivery. The Steering Group has been key in ensuring that the approaches used by the CoVE are viable.
Project delivery mechanisms
A variety of delivery methods were adopted:
work-based learning in-factory
training through a new factory unit in Grimsby (created as both a training and trading unit)
a "digital factory" making use of the software-based tools.
The new factory unit includes a state-of-the-art pasteuriser, a mini plate/blast freezer and a mini drying unit. This unit is now available to allow teams to take part in simulated exercises and thus gain insight into the food manufacturing environment.
The "digital factory" is drop-in centre where a range of software tools enable simulated factory production situations to be studied. These tools also support the one hundred factory managers and supervisors from the region who are studying for work-based degree programmes.
There was also an investment in fixed and mobile plant to underpin delivery, which has created the flexibility to take small-scale simulated plant into factories.
These delivery methods are practically biased and suit both small and large plant. The investment in modern traceability systems in the Grimsby demonstration plant and the new product development centre also supported the projects.
Project outputs
The project has developed learning materials in:
1. Food and Drink Manufacturing
2. Engineering Maintenance
3. Business Improvement
4. New product Development.
These learning materials have been contextualised to take account of production improvement strategies using overall effective efficiency (OEE) principles and also the precise needs of the learners and the food sector.
COVE IMPLEMENTATION
A Manufacturing Club was organised and linked to several relevant organisations. This was initially set up at 3 pilot sites within the region to help provide feedback from industry on the project and the training material developed. The headquarters is located at the Humber Institute of Food and Fisheries (part of Grimsby College) and the team there are now supporting 160 factory supervisors working on specific factory projects.
Learning Materials
Learning materials were developed in relation to the need to drive improvement in the overall efficiency and effectiveness (OEE) of participating companies. The learning programme was designed to drive improvement in those factory management target skills which could improve factory performance. The work-force were up-skilled in modern factory management approaches and engineering related topics such as set-up reduction. This was combined with raising awareness of market opportunities through new product development and explaining how to access new markets by meeting agreed standards such as the British Retail Consortium Global Standards.
The qualification units
The qualification units are delivered through work-based learning using projects based upon real issues within the participants workplace. Every two weeks a workshop is delivered to the staff on-site where the educational aspect of the project is supported with training. This involves working through the units and relating them to the individual factory projects. The students are given practical examples and exercises, which can be studied and applied to the same elements within their own organization. For example, the practical issues related to setting up and shutting down the factory are discussed and then related to any problems within this remit in their own organization.
Student project work
Each alternate (non-workshop) week a mentor/assessor visits the workplace to assist participants with their portfolios and projects. During these visits the assessor/mentor will help the students to complete a "Project Improvement Pack" (PIP). The PIP has been developed to enable participants to relate the educational training they receive through CoVE support to a specific improvement project within their workplace. The work-book enables the team or individual to select a given area of the factory operation which is not performing and agree strategies to improve. The individual or team chooses their project (with help from the pack), discusses this with their Line Manager and works on this, with support, throughout their time with CoVE. The pack teaches analysis of cause and effect (assisting in the choice of project), production performance measurement, cost benefit analysis, factory trials, data collection and performance analysis. This is additional and complementary to the qualification training and is used to help support the development of their target skill set.
The PIP is used alongside the software tools and currently includes the following sections:
Company Survey
Key Skills Assessment
Evaluating the Project
Measuring Production Performance
Complete Proposal
Complete Cost Benefit Analysis
Undertake Factory Trials
Project Completion
Skills Impact
Software Tools
Produce Plus is a United Nations Industrial Development Organization (UNIDO) approved software tool which is sold for commercial use and is based upon the idea of continuous improvement. Produce Plus is employed to centrally manage improvement projects and also to objectively measure and quantify the impact of production costs and performance. It is easy to use, yet sophisticated, and is aimed at all levels of management. It monitors and assists analysis of six key performance indicator areas:
Production
Quality
Overall Effective Efficiency
Costs
Labour Performance
Industrial Engineering Measurements for Performance and Efficiency
The tool also makes it possible to compare current results with previously defined targets and allows accurate costing of line manning, total production, individual products and proposed new products. The costing takes into account unavoidable losses, materials, direct and indirect labour and product families' allocated overheads. This function is paramount for monitoring performance on the factory floor as well as assisting a company to realise the true costs of production.
The software thus allows appropriate staff to monitor key production information and to utilise all that information in order to have better control over their activities. It assists in reviewing the current status of the business and provides support in making important operational and strategic decisions. As well as these important business benefits, there is the added gain in the upgrading of employee skills.
CONTINUING COVE DEVELOPMENT AND EXPANSION
The Humber Food CoVE is continuously evolving in an attempt to provide the most beneficial support possible to the local Food Cluster.
In response to industry need a New Product Development Level 3 NVQ has been created which is to be launched in September 2004. There are currently 12 full-time and 4 part-time candidates who have registered for this brand new programme. This is supported by the New Product Development Centre, 'Jus Juse', which opened in October 2003 in Grimsby to enable participating companies to create, test, trial and evaluate new products. As well as state-of-the-art kitchen facilities, specialist digital systems and rapid on-line product analysis, "Jus Juse" offers the opportunity to get real feedback from the paying general public who try the new products in the café area. The New Product Development Centre gives all CoVE participants (whether undertaking the New Product Development NVQ or not) the opportunity to follow the whole development process from concept to launch - or just individual steps if required.
The logical pathway follows these steps:
|
CREATE |
Define Customer Needs |
|
|
Generate Ideas |
|
|
Agree Target Costs |
|
TEST |
Devise specification |
|
|
Objectively test product |
|
|
Modify concept |
|
TRIAL |
Plan the process |
|
|
Run trial product |
|
|
Cost and analyse |
|
EVALUATE |
Sensory/consumer feedback |
|
|
Finished pack tests |
|
|
Final costing |
|
LAUNCH |
|
TABLE 1
Example projects in companies in the Humber
region
|
Company |
No of students |
Project Title |
Brief Description |
Outcome |
|
A |
1 |
Sandwich Waste |
High level of returns from retail outlets, quoting sour or unappealing flavours as the cause. Tests undertaken. |
Completed - outcome to be confirmed |
|
1 |
Process Flow Wrap |
Re-arranging the production set-up to improve product flow and reduce labour costs. |
Completed - saving £20 000 p/a |
|
|
B |
1 |
Fish Curing Capacity Analyses |
Utilizing existing equipment, re-scheduling production cycle. |
On-going |
|
C |
2 |
OEE Grading Line |
Utilizing UNIDO tool to establish performance levels and KPI’s, implementing a costing system. |
On-going. Standards for Plaice have been set up and data monitoring is currently taking place |
|
D |
2 |
OEE Salmon Process Line |
Utilizing UNIDO tool to establish performance levels and KPI’s, implementing a costing system. |
On-going. Updated version of Produce Plus installed, monitoring on-going. |
|
E |
1 |
Optimise Ice Production |
Investigating shortage of capacity in the summer which was creating a need to purchase ice. Most cost-effective solution was to purchase second-hand ice making equipment. |
Completed - saving £3 500 p/a |
|
1 |
Packaging Trials through Cold Chain |
Working with a packaging company to create a cost-efficient, environmentally friendly alternative to polystyrene fish crates, which also perform to the same standards. Major controlled trials performed, product still in development. |
On-going |
|
|
F |
1 |
Oil Recovery |
Excess oil carried over with product. Re-designed discharge chute from fryer. Created to exact specifications and designed to allow excess oil to drip freely and to be recovered. |
Completed - saving £2 600 p/a |
|
1 |
Availability Process Line |
A new product introduced utilizing existing equipment didn’t match required performance (a lot of down-time). Performance of equipment analysed and engineering improvements introduced, including material handling controls. Equipment modified. |
Completed - saving £74 000 p/a |
|
|
1 |
Performance Standard of Process Line |
Wastage on depositor. Investigation revealed cause to be different rates of expansion of components causing leakage of product. New depositor introduced to overcome problem. Problem logged in case of future occurrence on other production lines. |
Completed - saving £2 500 p/a (after costs) |
|
|
1 |
Waste Reduction in Blocks |
Wastage occurring when re-formed fish fillets produced from pure fish fillets, due to breakage of the frozen product in the mould. |
Completed - saving currently being evaluated. Waste reduced from 11% to 2% |
|
|
1 |
Performance Process Line Quality |
Company policy to reduce labour on process line resulted in an increase of rejects. Historical data was analysed & established this as a fact. Additional employee returned to line and frequency of inspections increased, resulting in a reduction in rejects at final packed stage. |
Completed - saving £15 000 p/a |
|
|
G |
8 |
Process Data Collection |
Data collected to illustrate the benefits of moving to a specific commercial paperless software system (Innovation Systems) using hand-held radio scanner |
On-going (Data collected - decision in managers hands) |
|
2 |
Radio Transfer Quality Assurance |
Data collected to illustrate the benefits of moving to a specific commercial paperless software system (Innovation Systems) |
On-going (Data collected - decision in managers hands) |
|
|
14 |
KPI Review and OEE Introduction |
Existing performance indicators indicated that standards were too low. Concept of "quality right first time" was introduced which highlighted the high level of rework occurring. Management attention consequently focussed in this area, which improved performance all round. OEE now forms a major part of the management control on a daily basis |
Completed - 5 % overall gain in efficiency |
|
|
1 |
NPD Costing using UNIDO Tool |
Still developing a new product development costing tool. Questionnaire/check-list needs to be developed. This will be used in conjunction with diagnostic section of Produce Plus as per RCME (Regional Centre for Manufacturing Excellence projects). |
On-going |
|
|
3 |
Factory Space Optimisation |
Spare equipment left in areas near the process line in an uncontrolled manner. Factory layout was investigated and a specific area designated for pieces of spare equipment. This provided a safer, clear working environment for the employees and assisted in planning for changeover. |
Completed - no direct financial saving but a safer more ergonomic environment created. Lost time on changeover reduced. |
OEE - Operational effective efficiency; KPI - Key performance indicator; NPD - New product development
RESULTS AND DISCUSSION
So far, 160 factory supervisors have been or are involved in training programmes being delivered by the CoVE. There are a further 150 individuals who are interested in commencing the programme shortly. Previously only a few factories undertook training at this level as they did not believe it gave any real benefits to their business
All of the participants have completed or are currently undertaking project work. The projects undertaken so far have covered a wide range of problems and most that have been completed have demonstrated commercial gain through improved efficiency. Table 1 gives information on the types of projects, a short description of the work undertaken and an outline of projected or achieved impact.
Although some factories were happy to give commercial estimates of gain, others preferred to quote reduction in scrap values or increases in efficiency. The figures quoted are confirmed by the factory management prior to them being entered into the table. Seven factories have been involved with the projects described involving 40 staff (some in teams) and 17 specific projects.
Another development outside of project work was the implementation of a development strategy to link training to pay rates by our pilot food company. One of the desired results of this strategy was to aid in the recruitment and retention of skilled staff. To achieve this the staffing requirement was split into three operator groups linked to specific pay rates (reducing the number of current pay rates): production operative; skilled production operative; and key operative. The three operator groups are defined in Table 2 along with the training each group is expected to undertake to achieve their maximum pay rate.
This pay structure demonstrates a commitment from the company to provide training and to up-skill employees to become skilled operatives in a reasonably practicable period of time. The structure also allows for pay grade simplification coupled with an increase in interchangeable skills and flexibility across all sites.
It was also recognised that it was impossible to reshape the operatives development structure without first providing junior and senior management with the correct skills to carry out their management positions. A development structure was created to address these issues, again at three levels with staff working towards recognised qualifications depending on their level of seniority, as detailed in Table 3.
CONCLUSIONS
So far a target group of 1 000 staff from the pilot factory have completed Level 1 and 2 training this year. The impact on absenteeism and staff retention has been significant with staff retention increasing by approximately 33% and absenteeism also being significantly reduced.
The factory supervisory projects have been put in place and the target skill sets have been improved, e.g 78-90% achievement on qualifications
The projects have also had an impact on business performance - ranging from what appears to be minor economic impact to £100 000 per annum net gain.
TABLE 2
Operator groups
|
Level |
Skill/Qualification |
|
Production Operative |
Induction |
| |
Basic Skill Training |
| |
Basic Food Hygiene |
| |
GMP |
| |
On the job training |
|
Skilled Production Operative |
Induction |
| |
Basic Skill Training |
| |
Basic Food Hygiene |
| |
GMP |
| |
On the job training |
| |
Specific skilled operative training and/or NVQ II |
|
Key Operative |
Induction |
| |
Basic Skill Training |
| |
Basic Food Hygiene |
| |
GMP |
| |
On the job training |
| |
Specific skilled operative training to include whole line/area understanding |
| |
NVQ II |
TABLE 3
Staff levels
|
Level |
Skills/Qualification |
|
Introductory |
NVQ Level 3 In Food and Drink Operations |
| |
Bespoke IT |
| |
Business & People Management Skills |
|
Intermediate |
Bespoke Programmes in: |
| |
Manufacturing Management |
| |
General Management |
| |
Technical Management |
| |
Project Management |
|
Advanced |
Foundation Degree In Food Manufacturing Operations |
The table below provides an outline of a sample improvement project and the benefits derived from involvement with the CoVE project.
|
Project Description |
Poor efficiencies and high rejects in batter fish fingers |
|
|
Objective |
Increased efficiencies and reduced rejects |
|
|
Measures |
Target Efficiencies |
40% improvement |
| |
Target Rejects |
4% reduction |
| |
Actual Efficiencies |
51% improvement |
| |
Actual Rejects |
4% reduction |
| |
Estimated Business Impact |
£78 000 saving per annum |
The feedback from industry has been favourable and this has increased interest in the Humber Food CoVE project and the associated qualifications and support. Additionally, all team members are positive about the CoVE approach.
ACKNOWLEDGEMENTS
We would like to acknowledge our partner institutes who are working with us on these projects. North Lindsey College are researching and implementing Business improvement skills programmes and Hull College are leading on Engineering Maintenance. Further the Learning and Skills Council have actively supported the project financially and operationally.
|
Mick Lochran |
Assistant Director of Applied Learning, Skills and Technology, North Lindsey College |
|
Brian Smith |
Project Manager, North Lindsey College |
|
Graham Towse |
Director of Learning (programmes), Hull College |
|
Dave Dyble |
Work Based Learning Co-ordinator, Hull College |
|
Ruth Palmer |
Learning and Skills Council, Humber |
BIBLIOGRAPHY
Dillon, M. 2001. Adaptation of a predictive cost model to determine the cost of control in identified critical loss areas within the fish processing chain. Post Harvest Fisheries Programme 1997 to 2001. DFID Project R6959.
Dillon, M. 2001. Enhance competitiveness and sustainability of industrial development in Uganda with particular emphasis on agro-industries and micro and small scale enterprises. Uganda Integrated Programme 2001. UNIDO Project TF/UGA/00/A03/11-51.
Dillon, M., Hannah, S., James, T., Sanchez, J. & Thompson, M. 2000. Building profitable business - software tools for changes. IFT Annual Conference. Dallas, USA. June 2000.
Dillon, M., Hannah, S. & Leeman, C. 2001. Appraisal of UNIDO Data Collection Protocol and Compatibility with ICE-IT Software Tool. Mike Dillon Associates Ltd, UK.
Dillon, M., Hannah, S. & Leeman, C. 2001. Score-IT Benchmarking Protocol and Example Data Collection Forms. Mike Dillon Associates Ltd, UK.
Besley, S. & Sokoloff, P. 2003. Policy Briefing - Foundation Degrees, Meeting the need for higher level skills. London Publications Ltd, UK.
Jörg Oehlenschläger
Federal Research
Centre for Fisheries, Hamburg, Germany
ABSTRACT
The measurement of the electric properties (resistance, conductivity and capacitance) of the fish flesh by transversal measurement through the fish body by the Fischtester VI gives reliable information about the 'days in ice' for fish stored in melting water ice. The advantage of this instrument is that the decrease in the instrument's readings is linear from the day of harvest/catch to the day the fish is spoiled (unfit for human consumption). The instrument was recently tested in a European Research Project (MUSTEC) together with a number of other instrumental methods. The Fischtester readings gave the best correlation with days in ice of all instruments tested. It performed as reliably as the sensory method used for calibration, the Quality Index Method. Days in ice can be predicted by Fischtester measurements for less than 1 day in ice. Examples of Fischtester measurements on different species and the limitation of the application of this instrument will be given in detail. The Fischtester readings can be used as an objective criterion for the state of freshness or spoilage and can be used together with sensory data throughout the fish value chain. It offers also the potential for use in traceability issues.
INTRODUCTION
Which kind of tool does the fish inspector, fish industry, authorities and fishery research need and/or want for fish freshness quality determination?
The ideal tool should be simple to operate, give immediate response, be suitable for field use, provide a linear time function (increasing or decreasing), be able to be used by untrained and non scientifically educated personnel, be robust, non invasive, not destructive, fast and reliable, cheap, small, simple to handle and suitable for all species. Further there should be well documented experience with its use.
Such a method exists through measurement of the electrical properties of fish (Oehlenschläger, 2003; Sörensen, 1992; Storey and Mills, 1976). The basis for electrical measurements on fish, using instruments like the Fischtester, is the fact that the resistance of fresh fish measured immediately after catch is about 2 000 W while spoiled fish has only 50 W of resistance left. The conductivity of fresh fish is approximately 500 mS and that of spoiled fish around 20 000 mS (Oehlenschläger and Nesvadba, 1998; Botta, 1995).
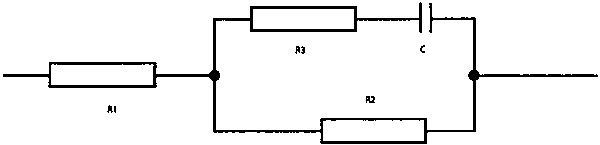
Hennings (1965) divided the complex resistance of the cell tissue into different components - the resistance of the interstitial liquid, the resistance of the cell content, the resistance of the cell wall and the capacity of the cell wall as shown in Figure 1.
|
FIGURE 1
|
In 1963, a practical application based on the dielectric properties of fish was developed (Hennings, 1960, 1961, 1962, 1963, 1964, 1965). The conductance of fish tissue changes more rapidly than the dielectric properties and simple AC measurements of impedance are not satisfactory. The Intellectron Fischtester VI overcame this problem and that of polarisation by measuring purely capacity changes from a simultaneous determination of impedance at two different frequencies (Hennings, 1963; Hennings, 1964). The instrument worked on the basis of a Wheatstone bridge. The Intellectron Fischtester VI measures transversally through the entire fish, the electrodes are applied on the lateral line of the body close to the anal opening. The readings range from 0 to 100 and in a few species, rarely, the readings exceed 100. The Fischtester VI is equipped with an analogue indicator and the latest version, the Via, with a digital one.
RESULTS AND DISCUSSION
Shortly after the introduction of the Fischtester it was tested by many researchers (Anon, 1965; Castell, 1965; Wittvogel und Schlegel, 1965a) and the following citation shows what the scientific community thought about this new device for fish freshness quality measurement:
"The findings demonstrate that the electronic resistance values for these three species, stored from death under fairly standard conditions, being neither badly pressed, bruised, damaged, bleached, contaminated, desiccated, heavily parasitized, temporarily frozen and re-thawed, nor in contact with electrolytic substances or solutions (salt, acids, alkalis) show a good correlation to the organoleptic classification results. The average values of the electronic measurement of a larger number of tested fish of the same species, even disregarding their source of supply and the fishing grounds they come from, are reliable scores for wet fish quality grading. "
The Intellectron Fischtester VI was thoroughly investigated and found to be suitable for fresh fish grading (Münkner, 1965; Wittvogel and Schlegel, 1965b; Gibson and Shewan, 1971). Electronic meters were used for the determination of days in ice and the prediction of days in ice left for lean fish species (Gibson and Shewan, 1971; Nunez et al., 1986; Meyer and Oehlenschläger, 1996; Oehlenschläger, 1992, 1995a, 1995b and 1998; Rehbein et al., 1994; Ferri et al., 1995), for medium fatty and fatty fish species (Damoglou, 1980; Karl, 1992; Nunes et al., 1992; Oehlenschläger and Rehbein, 2001; Rehbein et al., 1994), for slimy and de-slimed eel (Rehbein and Hinz, 1983) and for aquacultured fish species (Guidotti et al., 1996). The instruments have also been used to differentiate between fresh and frozen/thawed fish (Rehbein and Aust, 1980; Duflos et al., 2002) and to examine the influence of catching methods on fish quality (Hattula et al., 1995).
A prerequisite for using instruments like the Fischtester, however, is a sound knowledge of baseline readings for freshly caught fish from different species. Readings from samples of unknown history and origin can only be assessed with this knowledge base. In the years 1981-1985 and in 2002, these basic data have been collected during numerous cruises with German research vessels. Table 1 gives selected information on Fischtester VI readings typical for marine species tested immediately after hauling.
TABLE 1
Basic Fischtester data of different species from
North Atlantic waters, all data measured on freshly caught fish (< 1 hour
post mortem)
|
Species |
Year |
Catching area |
N |
Arithmetic mean |
Median |
Min |
Max |
SD |
|
Ocean perch 1 |
1984 |
WBW |
98 |
67.72 |
67 |
59 |
87 |
5.61 |
|
Ocean perch 1 |
1984 |
WBW a |
99 |
65.68 |
66 |
57 |
74 |
3.56 |
|
Ocean perch 1 |
1984 |
WBW |
100 |
69.96 |
70 |
60 |
80 |
3.58 |
|
Ocean perch 1 |
1984 |
WBW a |
100 |
68.06 |
68 |
57 |
78 |
3.53 |
|
Ocean perch 1 |
1982 |
East Greenland |
108 |
66.92 |
66 |
59 |
79 |
4.31 |
|
Ocean perch 2 |
1984 |
WBW a |
100 |
76.16 |
77 |
56 |
94 |
7.98 |
|
Ocean perch 2 |
1982 |
East Greenland |
101 |
71.50 |
72 |
58 |
80 |
4.92 |
|
Ocean perch 2 |
1981 |
WBW a |
81 |
43.91 |
44 |
32 |
54 |
5.56 |
|
Ocean perch 2 |
1982 |
Barents Sea |
99 |
74.35 |
74 |
66 |
86 |
3.67 |
|
Ocean perch 3 |
2002 |
East Greenland |
155 |
66.27 |
66 |
57 |
78 |
4.10 |
|
Cod 4 |
1984 |
WBW a |
100 |
78.86 |
79 |
70 |
90 |
3.21 |
|
Cod 4 |
1984 |
WBW a |
74 |
74.61 |
75 |
62 |
87 |
5.27 |
|
Cod 4 |
1982 |
Barents Sea |
108 |
76.88 |
77 |
64 |
85 |
3.72 |
|
Haddock 5 |
1984 |
Rockall Bank |
100 |
85.71 |
86 |
68 |
100 |
4.68 |
|
Haddock 5 |
1982 |
Rockall Bank |
100 |
87.54 |
88 |
74 |
98 |
4.77 |
|
Haddock 5 |
1982 |
Rockall Bank |
57 |
80.98 |
82 |
59 |
93 |
7.79 |
|
Saithe 6 |
1984 |
Rockall Bank |
101 |
68.71 |
68 |
44 |
76 |
4.68 |
|
Blue Whiting 7 |
1983 |
WBW a |
99 |
84.90 |
86 |
68 |
99 |
5.32 |
|
Grenadier 8 |
1981 |
WBW a |
100 |
52.42 |
53 |
34 |
63 |
5.39 |
|
Grenadier 8 |
1983 |
WBW a |
100 |
57.84 |
58 |
34 |
72 |
6.83 |
|
Grenadier 9 |
1983 |
WBW a |
99 |
42.48 |
42 |
30 |
64 |
5.54 |
|
Black Scabbardfish 10 |
1981 |
WBW a |
56 |
88.34 |
88 |
74 |
98 |
5.19 |
|
Herring 11 |
1983 |
St. Kilda |
100 |
72.08 |
72 |
54 |
80 |
4.51 |
1 Sebastes marinus, 2 S.
mentella, 3 Sebastes marinus + S. mentella, 4 Gadusmorhua,
5 Melanogrammus aeglefinus, 6 Pollachius pollachius,
7 Micromesistius poutassou, 8 Coryphaenoides rupestris,
9 Macrurus berglax, 10 Aphanopus carbo, 11
Clupea harengus
a West British waters
|
FIGURE 2
|
The average values vary between species but are quite stable within a certain species. For example, cod and haddock always have very high initial readings while other species like grenadier and ocean perch exhibit lower values. The following Fischtester readings are characteristic for the following species: ocean perch ~ 65-70, cod ~ 75, haddock ~ 85, saithe ~ 70 and grenadier ~ 50.
|
FIGURE 3
|
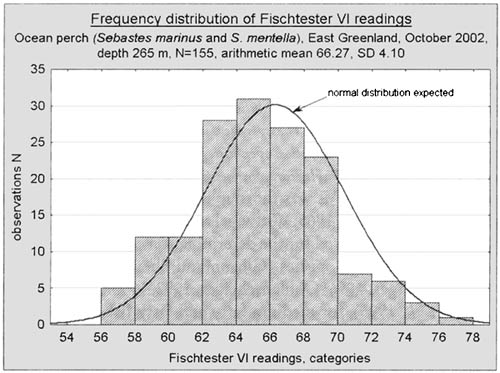
Fischtester readings from a large sample of fish of the same species caught together under similar conditions are usually normally distributed as shown in Figure 2.
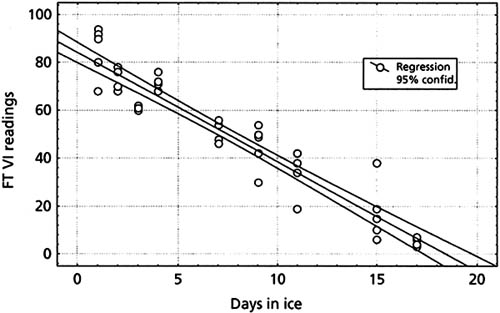
The decrease of Fischtester readings during the storage of wet fish in melting ice is linear throughout the whole storage period as shown in Figure 3.
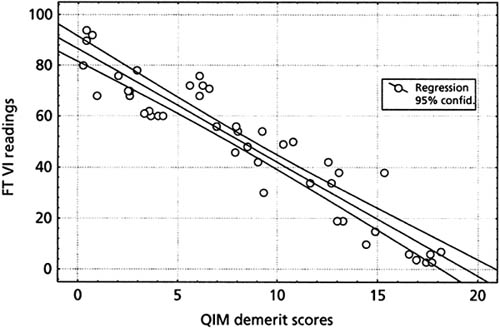
The Quality Index Method (QIM) is the most promising sensory method for predicting days in ice left and/or days in ice passed of iced stored fish (Luten and Martinsdottir, 1998). In a series of experiments, results obtained with Fischtester VI were compared with those obtained with QIM. The correlation coefficients of one experiment between days in ice and QIM scores and Fischtester readings were 0.9873 and 0.9901, respectively. The correlation between Fischtester VI and QIM scores was -0.9654 as shown in Figure 4.
Since Fischtester measurements are based on the existence of intact cell membranes, they fail when the cells are disrupted or broken. In frozen/thawed fish, where no intact cell membranes have survived the freezing/thawing cycle, Fischtester readings are always 0 because of very high conductivity. This phenomenon was used to differentiate fresh fish from frozen/thawed fish which was offered as fresh. Frozen/thawed fish could be rated highly by QIM but a Fischtester measurement of 0 would show, reliably and instantly, that the perfect looking fish had undergone a freezing/thawing cycle.
The skin and the mucus of fish contribute most to the impedance measured. This explains the fact that also in stale fish, where the Fischtester readings should be down to 0, readings above 0 can be found, which are produced by resistance of skin and any remaining slime. Therefore, electrical measurements give poor results in skin-on fillets (one skin lacking), skinless fillets (both skins lacking) and de-slimed fish (e.g. eel). In fillets, these instruments can only be used for a short period of time after catch/harvest (up to 7 days).
CONCLUSIONS
In numerous publications the Fischtester has shown its excellence in measuring fish freshness or degree of spoilage in iced stored wet fish. The advantages and limitations for the Fischtester VI are as follows:
|
FIGURE 4
|
Advantages
The Fischtester has been commercially available for almost 40 years.
The Fischtester has been successfully used for decades in auctions in Italy and Belgium.
The equipment is cheap (< 1 250 Euro).
The usefulness of the electrical testers is very much underestimated.
The electrical instruments are not regularly in use on vessels, in auctions, trade and fish industry where they are ideal tools for freshness grading.
The results obtained are objective and reliable.
Electrical tester readings are the only freshness/spoilage indicators which have an almost linear function with days in ice.
Measures through the fish (one side is not sufficient!).
Better than traditional TVB-N and TMA determination.
The results obtained for the electrical testers are as reliable as QIM,, the most promising sensory method available today for external inspection of fish freshness, and are superior to the EU quality grading scheme (E, A, B), which is too coarse and does not directly correlate with days in ice.
The main advantage of electrical testers is their immediate response and the ease of use in the field and without previous experience and special training.
Rapid method (<5 sec.), non destructive, non invasive.
Subcutaneous damage cannot be detected by sensory assessment.
Differentiates between fresh and frozen/thawed fish.
Limitations
Mechanical defects, bruising, etc., give lower values indicating a shorter shelf life and earlier spoilage
Instruments cannot be used for frozen/thawed fish, unless fresh fish needs to be differentiated from frozen/thawed.
Fish stored in refrigerated or chilled seawater may give misleading results.
The use in fillets is limited to a few days in ice (approx. 7).
High salt content in water-ice may lead to erroneous results.
Mechanically damaged fish may give erroneous results.
This chapter is closed by a remark of Christian Hennings (1965) in his first international publication on the Fischtester:
"It must be remarked that the Fish Tester can never replace the experience of a veterinarian or a fisheries officer, but it can help them to make a most objective judgement about the quality of wet fish".
REFERENCES
Anon. 1965. Testing the Intellectron Fish Tester V. In: R. Kreuzer editor. The technology of fish utilisation. London. Fishing News Books. pp. 165-167.
Botta, J.R. 1995. Evaluation of Seafood Freshness. New York, Weinheim, Cambridge. VCH. pp. 61-62.
Castell, C.H. 1965. Preliminary studies of quality assessment with the Intelectron Fischtester V. In: R. Kreuzer editor. The technology of fish utilisation. London. Fishing News Books. pp. 158-161.
Damoglou, A.P. 1980. A comparison of different methods of freshness assessment of herring. In: Connell J.J. editor. Advances in Fish Science and Technology. Farnham, Surrey, England. Fishing News Books Ltd, pp. 394-399.
Duflos, G., LeFur, B., Mulak, V., Bece, P. & Malle, P. 2002. Comparison of methods of differentiating between fresh and frozen-thawed fish or fillets. J Sci. Food Agric. 82:1341-1345.
Ferri, M., Mattei, P., Civera. T. & Gili, S. 1995. Considerations on the employment of electrical conductivity in freshness assessment of nine Mediterranean fish species. Industrie Alimentari 34: 1277-1282.
Gibson, D.M. & Shewan, J.M. 1971. Some recent results on the use of the Intelectron Fish Tester MK 5. In: Kreuzer R. editor. Fish inspection and quality control. London, England Fishing News Books. pp. 208-210.
Guidotti, P., Geri, G., Mecatti, M., Parisi, G., Lupi, P. & Poli, B.M. 1996. Changes of dielectric properties in rainbow trout (Oncorhynchus mykiss) and sea bass (Dicentrarchus labrax) at different storage temperatures. Refrigeration and Aquaculture. IIR Commission C2, Bordeaux, pp. 387-392
Hattula, T., Luoma, T., Kostiainen, R., Poutanen, J., Kallio, M. & Suuronen, P. 1995. Effects of catching method on different quality parameters of Baltic herring (Clupea harengus L). Fisheries Res. 23: 209-221.
Hennings, C. 1960. Neues Verfahren zur objektiven Schnellbestimmung des Frischegrades von Fisch. Inf. Fischw. 7: 164-165.
Hennings, C. 1961. Neues Verfahren zur objektiven Schnellbestimmung des Frischegrades von Nutzfischen. Inf. Fischw. 8:65-67.
Hennings, C. 1962. Neues elektronisches Verfahren und Gerät zur objektiven Schnellbestimmung des Frischegrades von Nutzfischen. Inf. Fischw. 9: 115-117.
Hennings, C. 1963. Ein elektronisches Schnellverfahren zur Ermittlung der Frische von Seefischen. Z. Lebensmittel-Unters. Forsch. 119: 462-477.
Hennings, C. 1964. Der Fischtester. AFZ Jahresheft der Fischwirtschaft, 1.1.1994.
Hennings, C. 1965. The "Intelectron fish tester V" A new electronic method and device for the rapid measurement of the degree for the freshness of "wet" fish. In R. Kreuzer editor. The technology of fish utilisation. London. Fishing News Books. pp. 154-158.
Karl, H. 1992. Versuche zur Verwendung des FISCHTESTER VI bei der Frischebestimmung von Heringen und Heringsfilets. Arch. Lebensmittelhyg. 43: 93 - 96.
Luten, J.B. & Martinsdottir, E. 1998. QIM: A European tool for fish freshness evaluation in the fishery chain. In Olafsdottir, G., Luten, J., Dalgaard, P., Careche, M., Verrez-Bagnis, V., Martinsdottir, E. & Heia, K. editors. Methods to determine freshness of fish in research and industry. IIR, Paris. pp. 287-296.
Meyer, C. & Oehlenschläger, J. 1996. Sensorische Bewertung, Mikrobiologie und chemische Kenngrößen von eisgelagertem Wittling (Merlangius merlangus). Infn. Fischw. 43: 89-94.
Münkner, W. 1965. Untersuchungen über die Aussagefähigkeit des FISCHTESTER V zur objektiven Qualitätsbestimmung bei Seefisch. Fischerei-Forschung Wiss. Schr-Reihe 3:59-64.
Nunes, M.L., Batista, I. & MoraodeCampos, R. 1992. Physical, chemical and sensory analysis of sardine (Sardina pilchardus) stored in ice. J Sci. Food Agric. 59: 37-43.
Oehlenschläger, J. 1992. Evaluation of some well established and some underrated indices for the determination of freshness and/or spoilage of ice stored wet fish. In Huss, H.H. et al. editors. Quality Assurance in the Fish Industry, Elsevier Science Publishers B.V. pp. 339-350.
Oehlenschläger, J. 1995a. Bewertung von Frische- und Verderbsindikatoren bei der Eislagerung von Schollen (Pleuronectes platessa). Infn. Fischw. 42: 94 - 102.
Oehlenschläger, J. 1995b. Haltbarkeit von Nordsee-Wittling (Merlangius merlangus) bei Lagerung in schmelzendem Eis. Infn. Fischw. 42: 42 - 49.
Oehlenschläger, J. 1998. Detailed experimental iced-storage characteristics of Barents Sea cod (Gadus morhua). Inf Fischwirtsch 45: 35-42.
Oehlenschläger, J. 2003. Measurement of freshness of fish based on electrical properties. In J. B. Luten, J. Oehlenschläger & G. Olafsdottir editors. Quality of fish from catch to consumer: Labelling, monitoring and traceability. Wageningen. Wageningen Academic Publishers. pp. 237-249.
Oehlenschläger, J. & Nesvadba, P. 1998. Methods for freshness measurement based on electrical properties of fish tissue. In Olafsdottir, G., Luten, J., Dalgaard, P., Careche, M., Verrez-Bagnis, V., Martinsdottir, E. & Heia, K. (eds.). Methods to determine freshness of fish in research and industry. IIR, Paris. pp. 363 - 368.
Oehlenschläger, J. & Rehbein, H. 2001. Shelf life of gutted and ungutted ocean perch (Sebastes marinus and S. mentella) during ice-storage. Annales Societatis Faeroensis Suppl. XXVIII: 51-61.
Rehbein, H. and Aust, M. 1980. Einsatzmöglichkeiten des Torrymeters und enzymatischer Analysenverfahren zur Untersuchung eisgelagerter Fische und Filets auf Auftauware. Arch. Fisch. Wiss. 30: 181-188.
Rehbein, H. and Hinz, A. 1983. Vergleich zwischen physikalischen und chemischen Methoden zur Bestimmung des Verderbs unbehandelter oder entschleimter Aale bei Eislagerung. Arch. Lebensmittelhyg. 34: 64 - 67.
Rehbein, H., Martinsdottir, E., Blomsterberg, F., Valdimarsson, G. & Oehlenschläger, J. 1994. Shelf life of iced-stored redfish, Sebastes marinus and S. mentella. Int. J. Food Sci. Technol. 29: 303-313.
Sörensen, N.K. 1992. Physical and instrumental methods for assessing seafood quality. in: Huss H.H. et al. editors. Quality Assurance in the Fish Industry, Elsevier Science Publishers B.V. pp. 321-332.
Storey, R.M. & Mills, A. 1976. Instrumental Techniques applied to the measurement of fish quality. Process Biochem. 11: 25-28.
Wittfogel, H. & Schlegel, H.L. 1965. Brauchbarkeit des Intellectron Fisch-Testers V bei der täglichen Qualitätskontrolle und Klassifizierung von Seefischanlandungen. Z. Lebensmittel-Unters. Forsch. 127: 85-92.
Wittvogel, H. & Schlegel, H.L. 1965. The suitability of the Intelectron fish tester V in the daily quality control and grading of wet fish landings. In: R. Kreuzer editor. The technology of fish utilisation. London. Fishing News Books. pp. 162 - 164.
Reinhard Schubring
Federal Research Centre for
Fisheries, Institute for Fishery Technique and Fish Quality, Hamburg,
Germany
ABSTRACT
Double frozen blocks of fillets, produced by thawing frozen gutted fish and re-freezing it after filleting and skinning, have become, apart from at-sea frozen blocks, more and more common in international trade, double-freezing being a practice used for decades. The reported influence on the quality of resulting end products, compared to those frozen only once, is controversial. Results of own research concentrated on battered fillets indicate that the quality of final products is not affected significantly by the different methods of production. A short review of literature on the influence of double freezing on quality is included.
INTRODUCTION
The German fish processing industry is considered as one of the most important processors for frozen battered and breaded portions of fish fillet world-wide and highly depending on the import of raw material. For instance, approximately 240 000 tonnes of mostly frozen lean fish fillets were imported in 2002 which represents a decrease of approximately 4% compared to 2001. However, the production of frozen battered and breaded products, including fish fingers, increased by 5.2% in 2002 compared to 2001 and amounted to 1 750 000 tonnes. Deep-frozen products had a market share of 32% in 2002 and were therefore the most liked fish products in Germany.
Beside frozen fish blocks produced on board of fish processing trawlers the international trade of double frozen blocks of fish fillet has become more and more common. Double frozen blocks of fish fillet are produced ashore by thawing the frozen round or gutted fish and refreezing them after filleting and skinning. The food regulations currently in place in Germany do not require a labelling of these different processing techniques for manufacturing deep-frozen blocks of fish fillet that are used as raw material for processing fish fingers and other types of battered and breaded fish products. Therefore, no information is available for the consumer whether the final product is produced from sea-frozen fillet or from double frozen fish. This was the motivation for investigating the effect of different processing techniques of the raw material on the quality of frozen final products.
Recently, some papers have been published on this subject using different species as raw material for processing single and double frozen fish blocks (Schubring, 1999a,b,c; 2000; 2001 a,b; 2002a,b) in which the relevant literature has been reviewed extensively. To briefly sum up the outcome it can be stated that research on double freezing was mainly undertaken in two period of time, the late sixties and early seventies as well as from the mid nineties on of last century and furthermore, that results on the influence of double freezing on the quality of fishery products were contradictory and inconsistent.
Fish species used so far in own research include saithe (Pollachius virens), cod (Gadus morhua), both are formaldehyde-producing species, haddock (Melanogramus aeglefinus), a weak formaldehyde-producer and horse mackerel (Trachurus trachurus), a pelagic species which is still under investigation.
Our previously published results on both saithe and cod fillets as well as on commercially processed samples from cod and Alaska pollack revealed differences in the quality attributes (e.g. sensory, texture, colour, water binding, chemical composition, electrophoretic pattern of sarcoplasmic proteins) depending on refreezing and rigor states (Schubring, 1999a,b; 2000a; 2002a,b). The quality attributes influenced differed by species and even within same species (saithe) when sampling was done under almost comparable conditions (catching ground, season, protocol) but in different years (Schubring, 1999a, 2000a; 2001b). For example, for haddock drip loss on cooking was strongly influenced by double freezing, whereas for saithe almost no influence was detectable (Schubring, 2001a). However, all the effects measured did not allow a clear differentiation between single and double frozen products. Even the thermoanalytical behaviour of SF samples was not distinct from DF samples when measured by differential scanning calorimetry (Schubring, 1999c). These results lead to the conclusion that, at least when using above mentioned species as raw material for processing coated portions, the different styles for preparing the fillet blocks will, if at all, not significantly affect the quality of the final products.
The aim of this study was to monitor the effect of double freezing on the quality of battered and breaded portions of ocean perch (Sebastes spp.) fillets which were prepared in pre and post rigor states. Ocean perch can be seen as a non formaldehyde-producing species. Knowing that freeze denaturation causes much stronger alterations in minced fish flesh compared to fillet also portions were prepared from single and double frozen mince blocks processed using skin-on fillet both pre and post rigor. The investigation of fish mince from fillets are also of commercial importance as the Guidelines of the German Food Code allow the implementation of 25% of fish mince prepared from V-cuts when processing fish fingers for the German market. In this study mince prepared from skin-on fillet was used as a model for mince prepared from V-cuts.
Particular attention was paid on quality attributes evaluated by sensory and physical methods, such as texture and colour measurements. In addition, the correlation between sensory parameters was evaluated.
MATERIAL AND METHODS
Sample preparation
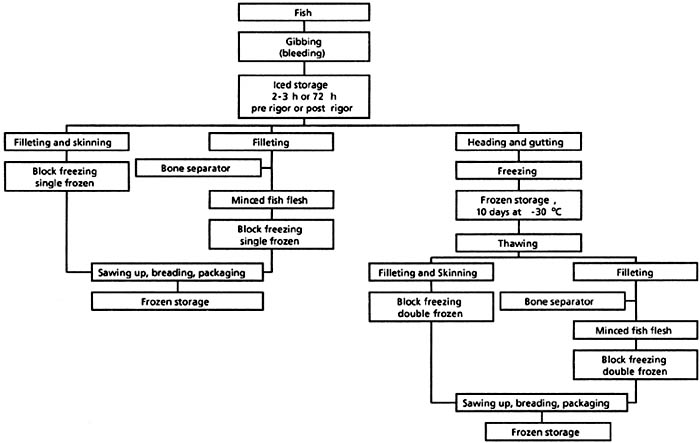
The frozen fish blocks were processed on board the FRV "Walther Herwig III" during the 232nd cruise in fall 2001 using ocean perch (Sebastes spp.) caught west of Shetland Islands. The length of ocean perch used for sampling ranged from 40 to 80 cm. The major part was in the range from 65 to 70 cm.
Measurements were made on single (SF) and double frozen (DF) batches of fish samples in two stages of rigor, i.e. in pre and post rigor. The preparation of the samples is shown in Fig. 1 and explained in detail earlier (Schubring, 1999a, 2001b). Additionally, mince blocks were processed from fillet skin-on, pre and post rigor, using a bone separator Baader 694 and frozen under conditions comparable to fillet. The intermediate products subjected for double freezing were frozen stored for seven days at -30 °C. After 12 weeks of frozen storage battered and breaded portions of both fish fillet and mince were prepared on a production line of a German processor using both single and double frozen blocks. These portions were packaged in cardboard boxes and stored at -24 °C until investigation. The sensory and physical measurements were performed on the coated portions after four months of frozen storage.
|
FIGURE 1
|
Methods
The sensory evaluation of the quality of fried portions prepared under standardised conditions was performed as Quantitative Descriptive Analysis (QDA) by estimating the intensity of the parameters (0-very small or nothing, 100-very strong). The flavour parameters (fresh, stale, fishy, rancid, strange) as well as the texture parameters (firmness, springiness, cohesiveness, gumminess) were evaluated in duplicate by a sensory panel consisting of nine trained assessors using two coated portions for each assessor. These parameters are defined in detail (Schubring, 2000b). Additionally, the sensory quality of the different breaded and battered portions were evaluated by a paired comparison (PC) test of once and twice frozen samples according to the German standard method after different times of frozen storage. The colour was measured on the homogenate prepared from the thawed product after removing batter and breading and mincing using a tristimulus colorimeter Chroma Meter CR 300 (Minolta, Ahrensburg, Germany) according to Schubring (2001a).
The texture was instrumentally evaluated by measuring both tensile and penetration force of battered and breaded portions of fillet and mince using a TA.XT 2/25 Texture Analyser (Stable Micro Systems, Godalming, England) as described by Schubring (2000b; 2001a). Tensile force measurements were repeated 15 times, whereas the penetration force measurements were repeated 10 times. Furthermore, instrumental Texture Profile Analysis (TPA) was performed as described by Schubring (2001a). The water binding ability was measured according to Detienne and Wicker (1999) with slight modifications as described by Schubring and others (2003).
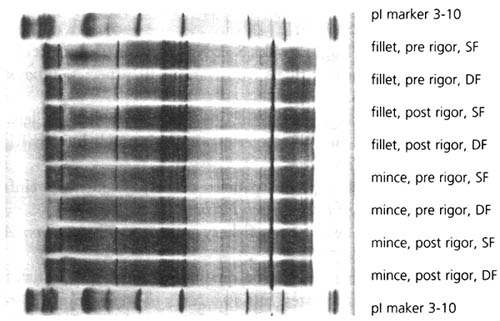
Additionally, isoelectric focusing (IEF) using Servalyte® Precotes® 3-10, dimensions 245 x 125 x 0.3 mm, generally following the instructions given by SERVA, Heidelberg, was performed to characterise the protein pattern as described by Rehbein and others (1995) with some modification (Schubring, 2002a).
|
FIGURE 2
|
TABLE 1
Correlation of flavour attributes (arithmetic
means) assessed on fried battered and breaded SF and DF portions
| |
fresh |
stale |
fishy |
rancid |
|
stale |
-0.919* |
- |
- |
- |
|
fishy |
-0.422 |
0.680 |
- |
- |
|
rancid |
-0.879* |
0.895* |
0.684 |
- |
|
strange |
-0.583 |
0.618 |
0.101 |
0.3516 |
* significant correlation’s (p<0.05)
TABLE 2
Correlation of flavour attributes (arithmetic
means) assessed on fried battered and breaded SF and DF portions
| |
firm |
flaky |
springy |
cohesive |
|
flaky |
0.072 |
- |
- |
- |
|
springy |
0.903* |
0.268 |
- |
- |
|
cohesive |
0.874* |
0.524 |
0.931* |
- |
|
gummy |
0.781* |
-0.050 |
0.815* |
0.719* |
* significant correlations (p<0.05)
The results were statistically evaluated by applying STATISTICA, StatSoft, Inc. (1996), Tulsa, OK, USA..
Results and Discussion
Sensory evaluation
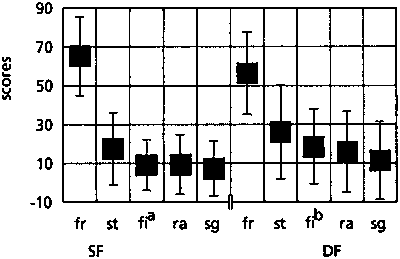
It would blow up the framework of this paper to represent and discuss all relevant results in detail. Therefore, in the figures only the most interesting results are demonstrated. From the flavour attributes assessed by QDA only fishy was significantly (p<0.05) influenced by double freezing the mince processed pre rigor (Fig. 2).
It can be seen that SF-portions were evaluated as more fresh, less stale, strange and rancid however, these differences were not significant (p>0.05). Portions processed from mince, post rigor were in general assessed as less fresh, more fishy and rancid compared to pre rigor portions. However, differences between SF and DF portions were not obvious. Also no significant (p<0.05) differences were found in assessing the flavour attributes on portions prepared form SF and DF fillet processed in both pre rigor and post rigor.
Significant correlation's between the sensory assessed flavour attributes are shown in Table 1. Freshness was negatively correlated only with stale and rancid. Also, rancid showed a high correlation with stale. Unexpectedly, the correlation's between fresh and fishy and strange were not significant (p > 0.05). Also, the attributes fishy, rancid and strange are not significantly correlated which each other. The missing correlation between fresh and fishy is in agreement with earlier results on cod (Schubring 2002a).
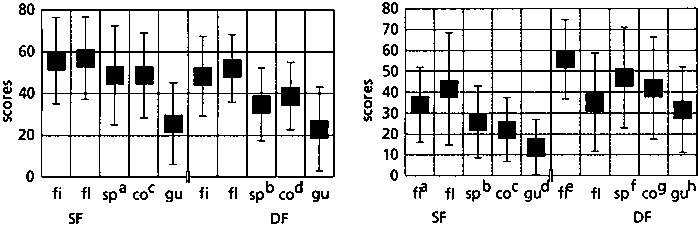
When texture attributes of coated fillet portions were assessed by QDA it became obvious in post rigor samples that SF portions were significantly (p<0.05) more cohesive and springy than DF samples (Fig. 3). Although SF portions were evaluated as firmer and more flaky, these differences were not significant (p>0.05). On the other hand, in pre rigor samples only gumminess was found to be significantly different (p<0.05)
Far more distinct were differences in texture for portions from mince, pre rigor (Fig. 3). Except for flakiness, all differences found between SF and DF samples were significant (p<0.05). However, no differences were found between SF and DF portions from mince, post rigor, while samples from pre and post rigor minces were evaluated to be different in all texture attributes.
As expected, within sensory evaluated texture attributes some correlations (Table 2) were significant (p<0.05). Firmness was directly correlated with springiness, cohesiveness and gumminess. Further significant correlation's were found between gumminess and both springiness and cohesiveness and between springiness and cohesiveness.
|
FIGURE 3
|
Sensory assessment included also a paired comparison (PC) of different SF and DF samples (Table 3). It was evident that only for portions from mince, pre rigor assessors were able to detect highly significant differences, whereas for all other samples differences were not significant (p>0.05). When PC was performed after prolonged frozen storage for 10 and 16 months, results did not differ markedly and indicated therefore no obvious influence of storage time an quality. The deviating behaviour of portions from mince, pre rigor could be expected from the QDA results mentioned above. However, there is no explanation for that up to now. In earlier investigation on haddock and saithe portions, no significant differences between the different samples were found by PC (Schubring, 2001a)
Instrumental measurements
In general, TPA proved to be not suited to display differences in texture between SF and DF samples, except for portions from mince, pre rigor. There were hardness, chewiness and cohesiveness found to be significantly different. This may also explain in part results of PC.
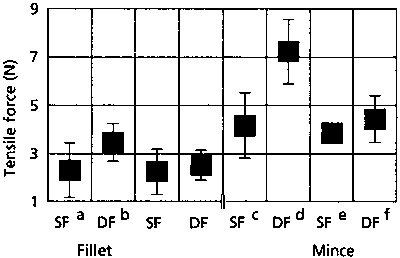
However, tensile force (TF) was higher for DF samples compared to SF samples. Differences were significant except for fillet, post rigor (Fig. 4). This is in agreement with results obtained earlier for saithe, while no influence of refreezing on TF could be detected for haddock (Schubring, 2001a). However, an influence of the different rigor states on TF results for ocean perch were not visible.
When texture was measured on homogenized samples it became evident that double freezing was in general connected with lowering of penetration force (PF) irrespective of measurements were taken from thawed or fried portions. It should be pointed out that PF of fried portions was approximately three times higher than for thawed samples. The decrease of PF observed on thawed DF samples does not agree with earlier results on saithe and cod where an increase of PF caused by double freezing was measured (Schubring, 2001b; 2002a). A possibly explanation for this different behaviour could be the lack of formaldehyde in ocean perch which is well known to support the freeze hardening of fish muscle (Mackie, 1993; Sotelo, Pineiro and Perez-Martin, 1995: Herrera, Pastoriza and Sampedro, 2000).
TABLE 3
Paired comparison (%) of battered and breaded
portions from SF and DF fillet and mince
|
Item |
preference |
stale/fishy |
firm |
|||
| |
SF |
DF |
SF |
DF |
SF |
DF |
|
Fillet, pre rigor |
42.5 |
57.5 |
50.0 |
50.0 |
45.0 |
55.0 |
|
Fillet, post rigor |
57.5 |
42.5 |
43.8 |
56.2 |
60.0 |
40.0 |
|
Mince, pre rigor |
80.0*** |
20.0*** |
20.0*** |
80.0*** |
15.0*** |
15.0*** |
|
Mince, post rigor |
50.0 |
50.0 |
46.3 |
53.7 |
48.8 |
51.2 |
*** p>0.001
|
FIGURE 4
|
|
FIGURE 5
|
TABLE 4
Colour difference DE*ab between homogenized SF and DF
samples
| |
DE*ab thawed |
DE*ab fried |
|
Fillet, pre rigor |
0.5 |
2.5 |
|
Fillet, post rigor |
1.3 |
1.1 |
|
Mince, pre rigor |
8.7 |
2.7 |
|
Mince post rigor |
0.4 |
2.6 |
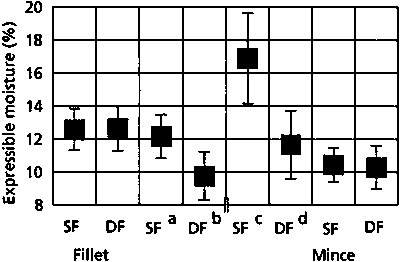
Water binding ability, often used as an indicator of protein denaturation, was evaluated as expressible moisture (Fig. 5). Since expressible moisture did not increase by both refreezing and changes of rigor state it could be stated that water binding ability was not negatively influenced by double freezing irrespective of samples were processed pre rigor or post rigor. However, the significant lower amount of expressible moisture found in both samples fillet, post rigor and mince, pre rigor is difficult to explain.
One of the most influenced instrumentally measured parameters in previous investigations on double freezing with lean fish (cod, saithe and haddock) used as raw material was the colour. Especially lightness increased mostly irrespective of the rigor sate. Surprisingly, this was not the case when ocean perch was used as raw material (Table 4). In almost all samples the colour difference were weak between SF and DF portions. The only exception was once again mince, pre rigor with a strong colour difference. Therefore, also colour seemed to be not an useful indicator to differentiate the different processing styles.
Also the IEF pattern of sarcoplasmic proteins displayed almost no differences between SF and DF samples which could be attributed to refreezing (Fig. 6). This is not surprising due to the fact that the solubility of sarcoplasmic proteins are not remarkable lowered by freeze-thaw cycles and prolonged frozen storage did not cause strong denaturation as in the case of myofibrillar proteins (Mackie, 1993).
To the author's knowledge only two reports (MacCallum et al., 1967; 1969) are available dealing with influence of double freezing on the quality of ocean perch (Sebastes marinus mentella). Preparation of samples included pre rigor freezing at sea, thawing ashore, packing, refreezing and storage at -23 °C. It was found that twice frozen ocean perch were at least equal in frozen storage to once frozen material prepared aboard ship and indicated too that the twice frozen material was equal in quality to that of once frozen fish prepared from iced trawler landings.
Summarizing the own results, this statement made more than 30 years ago could be largely supported and expanded as the results obtained using fillet, post rigor, as raw material were almost comparable. Sensory evaluation as well as instrumental measurements did not reveal significant differences between battered and breaded portions processed form single and double frozen fillet irrespective of rigor states. The only exception was the sample prepared from mince, pre rigor. Here, the DF portions were evaluated by sensory markedly inferior than SF portions. Also marked differences between SF and DF portions were exhibited in both colour and tensile force. However, it was surprisingly that the behaviour of mince, post rigor, was comparable to that of fillet portions and no significant difference was to be found between SF and DF.
|
FIGURE 6
|
CONCLUSIONS
Results obtained so far are leading to the conclusion that a comparison of SF and DF coated portions processed from ocean perch does not show significant differences between both in regard to quality assessed by sensory and instrumental methods. Results are therefore almost comparable to those obtained in earlier studies on gadoid fishes, e.g. cod, saithe and haddock. The influence of processing style and rigor state is mostly small and to be neglected. Therefore, it can be stated at least when using above mentioned species as raw material for processing battered and breaded portions, the different methods of preparing fillet blocks will not significantly affect the quality of the final products.
REFERENCES
Detienne, N.A. & Wicker, L. 1999. Sodium chloride and tripolyphosphate effects on physical and quality characteristics of injected pork loins. J. Food Sci., 64: 1042-7.
Herrera, J.J.R., Pastoriza, L. & Sampedro, G. 2000. Inhibition of formaldehyde production in frozen-stored minced blue whiting (Micromesistiuspoutassou) muscle by cryostabilizers: an approach from the glassy state theory. J. Agric. Food Chem., 48: 5256 - 62.
MacCallum, W.A., Chalker, D.A., Dorothy, A., Dyer, W.J. & Idler, D.R. 1967. Effects of water and dielectric thawing processes on shelf life of double-frozen cod and redfish. J. Fish Res. Bd Can., 24: 127-44.
MacCallum, W.A., Jaffray, J.I., Chalker, D.A. & Idler, D.R. 1969. Condition of Newfoundland offshore fish and its influence on quality after single and double freezing. In Kreuzer R, editor. Freezing and irradiation of fish. London, Fishing News (Books) Ltd. pp. 56-63.
Mackie, I.M. 1993. The effect of freezing on flesh proteins. Food Rev. Int., 9:575-610.
Rehbein, H., Etienne, M., Jerome, M., Hattula, T., Knudsen, L.B., Jessen, F., Luten, J.B., Bouquet, W., Mackie, I.M., Ritchie A.H., Martin R. & Mendes, R. 1995. Influence of variation in methodology on the reliability of the isoelectric-focusing method of fish species identification. Food Chem., 52: 193-7.
Schubring, R., Meyer, C., Schlüter, O., Boguslawski, S. & Knorr, D. 2003. Impact of high pressure assisted thawing on the quality of fillets from various fish species. Innovative Food Sci. Emerging Technol., 4: 257 - 67.
Schubring, R. 1999a. Einfluß des Doppelgefrierens auf Qualitätsmerkmale des Filets von Seelachs (Pollachius virens) während der TK-Lagerung in Abhängigkeit vom Rigor-Stadium. Dtsch Lebensmitt Rdsch., 95: 61 - 71.
Schubring, R. 1999b. Qualitätsvergleich zwischen panierten Filetportionen aus einfach- und doppelgefrorenen TK-Blöcken. Inf Fischwirtsch Fischereiforsch, 46: 52 - 6.
Schubring, R. 1999c. DSC studies on deep frozen fishery products. Thermochim Acta, 337: 89-95.
Schubring, R. 2000a. Influence of double freezing on quality attributes of lean fish fillet during frozen storage as affected by rigor states. In Advances in the refrigeration systems, food technologies and cold chain. Proceed. of the Conf. of Comm. B2 & C2 with D1 & D2/3, Sofia, Bulgaria 1998/6. Paris, IIR/IIF. 504-13.
Schubring, R. 2000b. Instrumentelle und sensorische Bewertung der Textur von Fischstäbchen. Dtsch Lebensmitt Rdsch., 96: 210-21.
Schubring, R. 2001a. Double freezing of fillets and minces prepared from saithe and haddock: influence on selected sensory and physical attributes. In Gudjonsson, A. & Niclasen, O. editors. Proceedings of the 30th WEFTA Plenary Meeting, 19 - 22 June, Torshavn, Faroe Islands. Anales Societatis Scientarum Faeroensis Suppl. XXVIII, 169 - 79.
Schubring, R. 2001b. Double freezing of saithe fillets. Influence on sensory and physical attributes. Nahrung/Food, 45: 280-5.
Schubring, R. 2002a. Double freezing of cod fillets: Influence on sensory, physical and chemical attributes of battered and breaded fillet portions. Nahrung/Food, 46: 227-32.
Schubring, R. 2002b. Gefrorenes Fischfilet. Eine Untersuchung zum zweimaligen Gefrieren von Seelachs und Schellfisch. Lebensmitteltechnik 34: 24-5.
Sotelo, C.G., Pineiro, C. & Perez-Martin, R.I. 1995. Denaturation of fish proteins during frozen storage: role of formaldehyde. Z Lebensm Unters Forsch., 200: 14 - 23.
Vance McEachern and Alfred Bungay
Canadian Food
Inspection Agency, Ottawa, Canada
ABSTRACT
The benefits of exchanging inspection data can be significant and far reaching. For example, the exchange of inspection data between the fish processor and the regulatory authority is a routine component of their inspection interaction that provides the basis for improving the processor's operation and increasing the level of compliance of the processor's products. The exchange of inspection data also plays an important role in the relationship between trading partners where importing countries communicate rejections of shipments to the competent authority of the exporting country. This information is valuable in improving trade and preventing future rejections of shipments. These two examples demonstrate the fundamental benefits of basic exchange of inspection data. This paper explores the wide scope of benefits that can be obtained through the further development of data exchange on a bilateral and multilateral level. It will explore the definition of inspection data and the advantages of systematic data sharing. This paper will also demonstrate how the international communication between regulatory authorities and the sharing of information with industry can facilitate trade by detecting and addressing health and safety issues promptly, promoting due diligence and contributing to the establishment of equivalency between inspection systems.
INTRODUCTION
According to the FAO, close to 50 million tonnes of fish products were traded worldwide in 2001. Canada itself exports approximately 465 000 tonnes of fish products each year to over 105 countries, while importing another 139 000 tonnes of fish products from over 145 countries annually. Fish is the most widely internationally traded food protein. Its importance to the economies of developing nations and as a food source cannot be overstated.
To support this trade of fish and fish products, competent authorities of exporting and importing countries perform thousands of product analyses to ensure that the health and safety of fish products meet international and importing country standards. These efforts generate a valuable pool of data that is mostly left untapped as it is not systematically shared with other parties. The benefits of exchanging inspection data can be significant and far reaching in facilitating the trade of fish and fish products and in identifying trends and emerging issues that may be potential threats to trade. There are many examples of how basic exchange of primary inspection results has been instrumental in improving trade between countries.
This paper explores the wide scope of benefits that may be obtained through the further development of data exchange on a bilateral and multilateral level. It will discuss the advantages of systematic data sharing and how communication between international regulatory authorities and the sharing of information with industry can facilitate trade by detecting and addressing health and safety issues promptly. This approach will promote due diligence and contribute to the establishment of equivalency between inspection systems.
WHAT IS INSPECTION DATA?
There are several different levels of inspection data that exist depending on what you are trying to measure and what you intend to use it for. For example:
results of an inspection of a specific lot including one or a combination of chemical, biological and regulatory analysis;
results of an inspection of the construction and operational elements of a processing establishment;
product surveillance data collected to determine trends and potential hazards;
industry operating compliance data;
assessments of industry's documented HACCP system;
regulatory verification of the effective implementation of industry of their HACCP systems.
However the concept of inspection data can be expanded to more than these examples. Competent authorities can begin to view inspection data to include all data captured and to consider how to use this information together to measure the effective delivery of inspection systems.
CURRENT ENVIRONMENT
Currently, inspection data are generated by exporting countries for the purposes of regulatory verification or for the provision of certificates to attest to importing country requirements. Importing countries will conduct either a product analysis or assess the accompanying documentation to determine if inspection is required. In many cases this data is made available to interested parties by posting it on the internet or by other reporting mechanisms.
However these data are provided in different formats and are inconsistent in presentation. These data are usually presented as "lot specific" and not linked to other data that may be available. Data that are exchanged, for example, with export certification are very limited in scope, usually referencing final product analysis. In addition, much of the data are not used as surveillance tools to identify potential problems, rather only for the specific purpose for which it was collected.
STEPS TO IMPROVE INSPECTION DATA EXCHANGE
To help address these issues related to effective inspection data exchange, the following suggestions are provided for consideration:
1. develop formal data sharing agreements between trading partners that inform countries of all rejections;
2. develop a consistent format to report data;
3. expand the type of data exchanged to include other sets of data valuable to trading partners;
4. exporting countries could provide regular updates on industry compliance and product surveillance results relative to traded products;
5. importing countries could provide regular updates to the exporting country on all product inspection results of imported product;
6. encourage transparency and open disclosure to demonstrate corrective action and due diligence;
7. explore the use of performance measurement indicators to enhance the effectiveness of Mutual Recognition Agreement maintenance;
8. develop a tool to assist and facilitate the collection and analysis of data to disseminate the resulting knowledge to competent authorities and industry.
BILATERAL EXCHANGE OF INSPECTION DATA
Current
The bilateral exchange of inspection data refers to the exchange of data between two trading partners. Usually this takes place as part of bilateral agreements where the two competent authorities will exchange inspection data to demonstrate that their products and systems meet the requirements specified in the bilateral arrangement. It can also occur when one of the partners wishes to identify an incident where the requirements were not respected. This data is usually in the form of product inspection results but could include data gathered through surveillance or an audit. A third category of data can be gathered to demonstrate that corrective actions were implemented by a country in response to identified problems. Canada's mutual recognition agreements with the competent authorities of foreign countries include specifications where each party must provide, on an annual basis, reports on the operation and verification of the inspection system.
Proposed Step
In the development of mutual recognition agreements, an additional category of data could be exchanged relating to the performance of each partners inspection system. Indicators of system performance can be agreed upon which provides a measurement of the achievement of food safety or regulatory compliance. As the two systems are not identical, but rather determined to be equivalent and therefore may use alternative means to achieve equivalent results, it is not necessary that they share the same performance measurement indicators. Examples of potential performance indicators are industry compliance data and program delivery to specified standards by the competent authority. The actual measurement of the indicators could be performed by the competent authority delivering the inspection system or the partner in the bilateral arrangement. In certain circumstances both parties may be able to co-operatively measure the indicators.
Benefits
The development of these performance measurement indicators will facilitate the understanding of equivalence and mutually accepted indicators could be the final element of an open and transparent equivalency agreement. This would include identifying practical performance measurement indicators for each of the partners' systems. A series of these indicators would provide another tool to demonstrate that the two systems deemed to be equivalent are performing within their respective parameters and are equivalent at an operational level.
MULTILATERAL EXCHANGE OF INSPECTION DATA
Current
Multilateral exchange of inspection data refers to a broader, more open sharing process among the international trading community. As noted in the previous section, competent authorities of countries are continually generating data to aid in their own decision processes. The sharing of this data is normally limited to an exchange between competent authorities and is often used in a reactionary fashion. This leads to isolated islands of data that are very useful for specific purposes because if they were linked they could potentially be very valuable to international markets. Current examples of data sources are the EU Rapid Alert, Canada's Import Alert List and the US FDA Import Alert.
Proposed Steps
The pooling, processing and disseminating of the different sources of data would be a valuable tool in identifying trends and emerging health and safety issues on a global level. If this data were used together then positive and preventive strategies could be triggered before issues impact on the market place and could avoid being impacted by reactions in the market place. This would involve developing a systematic approach to capture data from different sources and dissemination of the data.
Benefits
The benefits of such a collaborative approach are obvious. There would be an enhanced sharing of inspection data between all players and this approach would guide the use of resources where the risk is highest. Sharing and analyzing data at an international level could be used to develop an early warning surveillance tool system to identify trends and emerging health and safety issues before they manifest into major crises. An internet based system would provide the necessary infrastructure to make this approach possible. The FAO recently announced the internationally sponsored Aquatic Food Product Program, which is based on the design of an internet portal, would be an excellent starting point to begin exploring this option.
FUTURE CHALLENGES
Any proposal involving the international participation of hundreds of countries and the exchange of data on inspection results on thousands of product types will result in major challenges. Consideration would have to be given to ensure the quality of data exchanged and the development of technical standards for the collection, storage, manipulation and dissemination of data. There would also be a need to balance the protection of the confidentiality of industry with the need to identify health and safety events that can impact negatively on international markets. It cannot be perceived as a "finger pointing exercise" but rather an effort to work together to maintain the worldwide confidence in the safety and quality of fish and fish products, thus benefiting all countries producing fish for international trade.
![]()
![]()
![]()