AQUASTAT - FAO's Global Information System on Water and Agriculture
Mexico
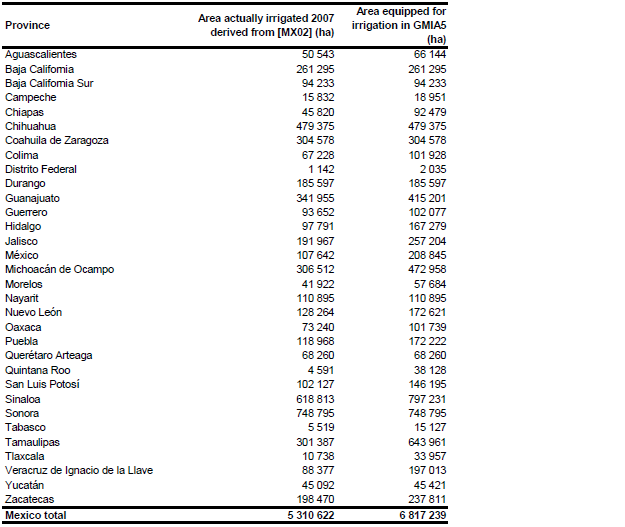
Area equipped for irrigation was reported at 6 452 934 ha for the year 2008, of which 3 496 902 ha for was located in 88 large-scale irrigation districts and 2 956 032 ha in 39 492 irrigation units [MX01]. According to the agricultural census 2007, irrigated area was 5 310 622 ha [MX02]. Likely, these statistics refer to the area that was actually used for irrigation in this year. However, area actually irrigated reported by the census [MX02] was larger than the AEI reported in [MX01] for the provinces of Baja California, Baja California Sur, Chihuahua, Coahuila de Zaragoza, Durango, Nayarit, Querétaro Arteaga, and Sonora. It should also be mentioned that statistics derived from remote sensing products reported a much larger extent of irrigated agriculture. Digital land use and vegetation maps developed by INEGI detected about 6 992 027 ha irrigated land in the reference period 1979-1991 [MX03], 8 507 266 ha irrigated land in the reference period 1993-1999 [MX04] and 9 245 612 ha in the reference period 2002-2005 [MX05]. In most of the northern provinces irrigated area as detected in the remote sensing surveys would be larger than the irrigation potential reported by province [MX06]. It maybe that at least the last two remote sensing based land use maps ([MX04], [MX05]) overestimated the extent of irrigated agriculture. On the other hand census based statistics mainly account for the registered part of irrigated land located in irrigation districts and irrigation units and may therefore miss unregistered informal irrigation. Thus it can be assumed that the physically existing total amount of irrigated land is somewhere between the census-based and remote sensing based estimates. Therefore, the data from the three sources were combined to compile this version of the global irrigation map. First, AEI per province was estimated as the maximum of AEI reported by CNA [MX01] and AAI reported by the agricultural census data base [MX02]. Then AEI per municipality AEImun (ha) was computed as:
AEImun = AAI_CENSmun + fp(IRR_LULCmun - AAI_CENSmun)
where AAI_CENSmun was the AAI reported for the municipality by the agricultural census [MX02], IRR_LULCmun the sum of irrigated area derived from the INEGI land cover classification [MX05] and fp a scaling coefficient that was constant for municipalities belonging to the same province. The coefficient fp was selected so that the sum of the AEI of the municipalities equals the AEI computed before at the province level. This procedure resulted in a total AEI of 6 817 239 ha while AAI was set to the statistics extracted from the agricultural census 2007 [MX02]. The irrigated areas by province are shown in the Table below. The irrigated areas both by province and by district can be downloaded as a Mexico irrigation areas in PDF or Mexico irrigation areas in Excel (two sheets).
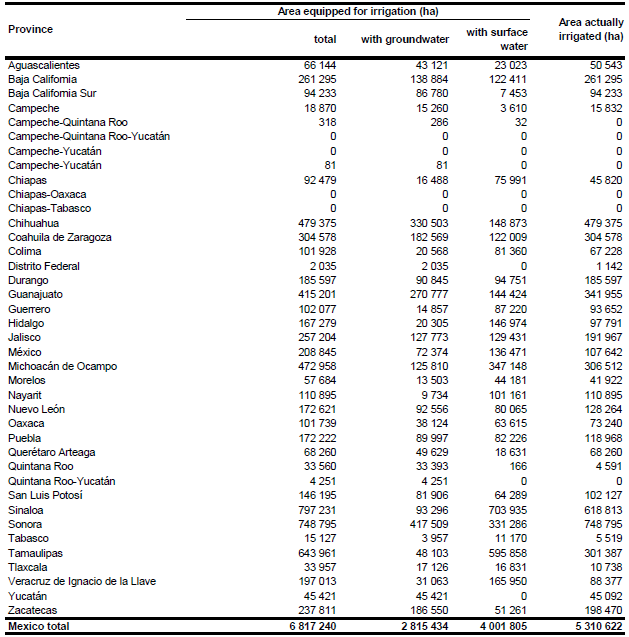
The digital land use map for the reference period 2002-2005 [MX05] was used to distribute area equipped for irrigation within the municipalities. First the area equipped for irrigation reported for the single irrigation districts was assigned to areas classified on the land use map as "Agricultura de Riego". If AEI per municipality was larger than the area classified in the land cover map as "Agricultura de Riego", the remaining difference was assigned to areas classified as "Agricultura de Temporal".
Ground- and surface water use for irrigation by county was extracted from a database provided by CONAGUA [MX07]. The data are consistent to statistics published per province in the annual water report [MX01]. It was assumed that the percentage of AEI irrigated with groundwater was similar to the percentage of water use for irrigation that was from groundwater. In 1102 municipalities with an AEI of 222 649 ha (3 percent of total AEI) agricultural water use was 0 while AEI was larger than 0. In this case the fraction of AEI irrigated with groundwater was set to the average computed at the province level. Total AEI irrigated with groundwater computed that way was 2 815 434 ha (41 percent) while total AEI irrigated with surface water was 4 001 805 ha (59 percent).
References
[MX01]:Comisión Nacional del Agua, 2008a. Estadísticas del Agua en México 2008. Comisión Nacional del Agua (CONAGUA), Coyoacán, DF, México, http://www.conagua.gob.mx/ Default.aspx, 24/08/2009.
[MX02]: INEGI. 2010. Censo Agrícola, Ganadero y Forestal 2007. Instituto Nacional de Estadística y Geografía (INEGI), Aguascalientes, Mexico, http://www.inegi.org.mx/est/contenidos/proyectos/ Agro/ca2007/Resultados_Agricola/default.aspx, 29/07/2010.
[MX03]: INEGI. 1991. Conjunto de Datos Vectoriales de la Carta de Uso del Suelo y Vegetación, Serie I. Instituto Nacional de Estadística y Geografía (INEGI), Aguascalientes, Mexico.
[MX04]: INEGI. 1999. Conjunto de Datos Vectoriales de la Carta de Uso del Suelo y Vegetación, Escala 1:250,000, Serie II. Instituto Nacional de Estadística y Geografía (INEGI), Aguascalientes, Mexico.
[MX05]: INEGI. 2005. Conjunto de Datos Vectoriales de la Carta de Uso del Suelo y Vegetación, Escala 1:250,000, Serie III. Instituto Nacional de Estadística y Geografía (INEGI), Aguascalientes, Mexico.
[MX06]: FAO. 2000. AQUASTAT country profile of Mexico, version 2000. FAO, Rome, Italy.
[MX07]: Comisión Nacional del Agua. 2008b. Cubo de Usos del Agua. Comisión Nacional del Agua (CONAGUA), Coyoacán, DF, México.


