AQUASTAT - FAO's Global Information System on Water and Agriculture
Saudi Arabia
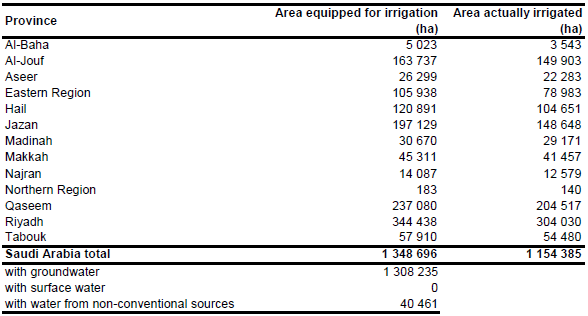
In 2005, the cultivated area was 1 213 586 ha, of which 1 011 923 ha consisted of annual crops and 201 663 ha of permanent crops. The cultivated area in 2005 was 23 percent less than it was in 1992. All agriculture is irrigated, and the extent of cultivation depends mainly on the availability of irrigation water as a limiting factor [SA01]. The area equipped for irrigation per province was estimated by using the maximum value of the cultivated areas reported for each province within the period 2001-2007 [SA02]. Total area equipped for irrigation estimated that way was 1 348 696 ha as shown in the table below, also downloadable as Saudi Arabia irrigation areas in PDF or Saudi Arabia irrigation areas in Excel.
The irrigated areas were digitized using Landsat satellite imagery [SA03], MODIS Vegetation Indices [SA04] and several large-scale irrigation maps ([SA05]; [SA06]; [SA07]). The approximate position and extent of the major irrigation schemes was detected based on the course-scale maps, and their more precise extent was derived by digitizing vegetated areas from the satellite imagery. The polygons digitized that way were then combined with cropland extracted from the Globcover regional landcover classification for North Africa [SA08] and irrigated area was first assigned to pixels that were covered by both data layers (digitized polygons AND cropland in Globcover) and after, if required, to pixels covered by just one of the two layers (digitized polygons OR cropland in Globcover).
97 percent of the area equipped for irrigation is irrigated with groundwater while the remaining area is irrigated with non-conventional water sources [SA01]. Area actually irrigated per province was estimated by computing the mean of cultivated land reported for period 2001-2007 [SA02].
References
[SA01]: FAO. 2013. AQUASTAT country profile of Saudi Arabia, version 2008. FAO, Rome, Italy.
[SA02]: Central Department of Statistics and Information. 2002-2008. Statistical yearbook. Editions 38-44. Central Department of Statistics and Information, Ministry of Economy and Planning, Kingdom of Saudi Arabia, http://www.cdsi.gov.sa/english/index.php?option=com\_content &view=article&id=84&Itemid=172, 20/01/2013.
[SA03]: Earth Satellite Corporation. 2004. Landsat GeoCover (2000/ETM+) Edition Mosaics,tiles 071-271, 071-284, 071-285, 071-286, 071-287, 071-288, 071-296, 071-297, 071-298, 071-299, 071-308, 071-309, 071-310, 071-318 and 071-319. Sioux Falls, USA, USGS, http://glcfapp.umiacs.umd.edu:8080.
[SA04]: NASA, Land Processes Distributed Active Archive Center. 2004. MOD13Q1: MODIS/Terra Vegetation Indices 16-Day L3 Global 250m SIN Grid V004. Enhanced Vegetation Indices (EVI) from 9 June 2000 and 17 January 2001, http://edcimswww.cr.usgs.gov.
[SA05]: Universität Tübingen. 1993. Tübinger Atlas des Vorderen Orients (TAVO), Plate AX1.Reichert, Germany, Wiesbaden.
[SA06]: United States Agency for International Development. 1993. Water Resources Action Plan for the Near East, Figure 3. Washington, DC.
[SA07]: Achtnich, W. 1980. Bewässerungslandbau, p. 39. Stuttgart, Germany, Ulmer.
[SA08]: POSTEL. 2008. GLOBCOVER landcover classification, Version 2.2, North Africa. Globcover database. http://toyo.mediasfrance.org/?GLOBCOVER, 24/03/2009.


