![]()
![]()
![]()
by
Peter B.O. Ochumba
Kenya Marine and Fisheries Research Institute
Kisumu, Kenya
INTRODUCTION
During the past several months, much concern has developed over the continued deterioration of Lake Victoria often characterized by nuisance dying or dead fishes and algal blooms. Fish kills are fairly common within tropical lakes (Fish, 1956; Coe, 1966; Tait, 1967; Denny, 1972; Gwahaba, 1973; Beadle, 1981; Lowe-McConnell, 1975; Alabaster, 1981). Occasional massive fish kills occur at infrequent intervals in Lake Victoria under climatic conditions which may lead to the deoxygenation of the water column (Fish, 1956; Talling, 1966; Ochumba, 1985). Large mortalities of fish have been reported from Lake Victoria, but details are rarely available (Graham, 1929). According to the defunct East African Freshwater Fisheries Research Organization (EAFFRO) reports, “fish kills” are not a new happening in Lake Victoria. The first large-scale report of fish kills in the lake was in April 1927, when an area of 24 km in extent off Sango Bay was covered with dead fish, mainly Labeo and Bagrus species. The second report of local mortality of fish was by Fish (1956) from Entebbe on 31 July 1953. The fish affected were mainly Tilapia and Haplochromis species. Examination produced no evidence of disease, and local fishermen collected large numbers of dead and dying Tilapia for subsequent sale. A day or so prior to the first reports of this mortality there was an exceptionally strong offshore wind at Entebbe.
Huge numbers of fishes, mainly Nile perch, Lates niloticus, tilapia, Oreochromis niloticus, Haplochromis species and cyprinid, Engraulicypris (Rastrineobola) argenteus were found dead or dying in Lake Victoria between November 1983 and up to recently. Dead Bagrus docmac, Barbus altianalis and Clarias mossambicus were also found washed ashore from the open waters of Lake Victoria. These deaths were attributed to: (a) stormy weather which had turned the water from bluish grey to black (Bwathondi, Chale and Katunzi, 1984); (b) algal blooms (Bugenyi, 1986), and (c) acidic and deoxygenated swamp waters flushed into the lake after the 1984 drought (Ochumba, 1985). In late 1984, the Kenya Marine and Fisheries Research Institute set up a study to determine the distribution of the dead fishes and to estimate their abundance and the possible causes within the Nyanza (Kavirondo) Gulf. On 25 September and on 4–6 October 1984, 584 dead fishes (413 Lates niloticus and 171 Oreochromis niloticus) were counted. No attempt was made to keep account of the rate of the mortality. The highest density of dead fishes observed on 25 September, was 53 (23 L. niloticus and 29 O. niloticus) per 200 m of shoreline at Kendu Bay, each weighing more than 4 kg. As approximately 100 km of shoreline was littered with fish, the total number of dead fish was etimated to be over 400 000. this amounted to about 2 400 t loss in fish production with the Gulf. Figure 1 shows location of the dead fishes and the drainage area.
Possible Causes of Fish Deaths
The possible causes of the periodic fish deaths in Lake Victoria are yet to be scientifically identified, though several hypotheses have been put forward, namely:
mortalities are attributed to sudden reductions in temperature cooling the surface waters which, coupled with strong winds, causes a rapid breakdown in stratification, abrupt deoxygenation and contamination with hydrogen sulphide to lethal levels;
the presence of algal blooms, mainly Microcystis and Anabaena sp. Warm weather, stratified water column and special nutrient sources are probably responsible for the blooms;
the 1983/84 drought lowered lake levels and the scattered rains could have flushed oxygen deficient and acidic swamp waters into the lake;
toxic effluents carried into the lake by rivers from factories: pesticides, fertilizers and heavy metals;
construction of Mbita causeway, the losing of Mbita pass which previously could have facilitated movement of water from the open lake into the Nyanza Gulf, and
incidental deaths by trawlers or gillnetters who throw away dead fish from overnight gillnets.
CENSUS OF DEAD FISHES
From January 1985 up-to-date records of dead fishes floating in the Kenyan portion of the lake have been made from fishermen's reports and counts from various ship crew (Table 1). The length frequency distribution of the dead Lates niloticus and Oreochromis niloticus within the Nyanza Gulf are shown in Figure 2. Figure 3 shows the length distribution in the open lake. The wet weight distribution is shown in Figure 4. The difference in the size of fish in the Nyanza Gulf and the open lake presumably reflects that larger sizes predominate in shallow areas. The breeding sizes of L. niloticus is 25–27 cm for males and 27–29 cm for females (Hunter, 1970; Okedi, 1971), while that for O. niloticus is over 20 cm (Lowe-McConnell, 1958). As most of the dead fishes had reached breeding size, frequent fish kills may reduce the size of the breeding stock and the present recruitment levels.
BASELINE STUDIES
The objective of the baseline studies was to establish a baseline water quality data for Lake Victoria and to establish the factors responsible for the periodic massive fish kills in Lake Victoria (Kenyan waters). The information was needed for site specific evaluation, the preparation of an environmental assessment of the lake condition and to ascertain the effects of new development projects on Lake Victoria. Under the US Agency for International Development (AID), Environmental Training and Management in Africa (ETMA) project and the Norwegian Agency for Development (NORAD), it was possible to collect the baseline data.
Physico-chemical Data
Figure 5 shows the temperature and oxygen distributions when dead fishes were observed in the lake. The temperature range was from a minimum of 22.9°C near the bottom to a maximum of 27.9°C at the surface. Temperature tolerance studies on tropical fish (Cridland, 1962; Allanson and Noble, 1964; Welcomme, 1964) and the seasonal temperature changes within Lake Victoria (Fish, 1957; Talling, 1966; Akiyama, Kajumulo and Olsen, 1977; Melack, 1979) indicate that the measured temperatures could not have caused the fish kills. The data presented shows the persistence of deep deoxygenated water during the period of study. The appearance of this water at the surface during any windy period could lead to fish mortality. Low oxygen concentration below 5 mg/l within 5 m of the water column was common in October and November. The greatest depletion of dissolved oxygen occurred in the Rusinga Channel area between 25 and 26 October 1984, when only 4.7 mg/l was observed at the surface and 17 mg/l at 20 m.
The variation in the mean conductivity, turbidity, alkalinity, pH and secchi depth are shown in Table 2. These are in agreement with past studies (Talling and Talling, 1965; Visser, 1974). Conductivity values were high at station 34 and low in the open lake station 32 and 103. This may indicate that the Nyanza Gulf is not well flushed and therefore potentially harmful materials which may be carried in the inflowing streams accumulate in the Gulf. Secchi depth was low for stations 53 and 105 near the rivers. There was a decrease in conductivity, alkalinity and secchi depth during an algal bloom. The concentrations of nitrate -N and phosphate -P are shown in Figure 6 for the open lake only. From a management point of view, estimates of the per caput nitrate -N and phosphate -P contribution from the drainage by rivers and urban centres into Lake Victoria is unknown and need to be computed. Phosphorous has often been implicated as the element whose excessive supply in lakes promote algal blooms. In many cases the excessive supply can be attributed to point sources (Figure 1), thus offering potential for control.
ALGAL BLOOMS
Algal blooms have been observed in Lake Victoria in shallow bays (Fish, 1957; Talling, 1966), but recently cyanobacterial blooms covering tens of kilometres in the open lake are not unusual (Ochumba and Kibaara, in preparation). The principal bloom organisms have been Anabaena sp., Microcystis sp., Lyngbya sp., and Merismopedia sp., with individual cell counts in excess of 1 000/ml. Figure 7 shows chlorophyll a content measured during the bloom period. The blooms started to develop when the water temperature was about 26° to 28°C. The blooms always occurred at the surface.
Field cases of algae nitoxication in farm animals were reported off stations 34, 105, 53 and 51, as a result of drinking water containing blooms. Death occurred within a few hours of ingestion of a lethal bolus and signs described by the local people was characteristic of respiratory failure. An algal bloom may have indirectly produced a fish kill by reducing the oxygen content of the water. Coe (1966) suggested that the deoxygenation of the water following an algal bloom was the most likely cause of a mass mortality of Tilapia grahami in Lake Magadi (Kenya) in 1960. Brown and Urban (1969) suggested that a kill of T. grahami in Lake Natron (Tanzania) in 1962 was probably due to anoxiz or gill clogging by an algal bloom. Dead fishes are indicative of pollution within the lake. Algal blooms give a clear indication of the severity of pollution by organic matter and chemical nutrients from the drainage area.
HEAVY METALS AND PESTICIDES
The levels of heavy metals (mercury, lead, copper, chromium and cadmium) in water and fish tissues in Lake Victoria have been studied by Onyari (1985) and were found to be within the tolerable levels set by the World Health Organization and therefore probably not responsible for he observed deaths. It must be admitted that the large-scale use of pesticides for better farm returns in the drainage area has not been followed by an adequate study of their environmental effects, and little is known of the infleunce which such practices have had on our fisheries. Pesticides and their breakdown products have been found in water and aquatic organisms, including fish (Kallqvist and Meadows, 1977; Foxall, 1981). The Tropical Pesticides Research Institute (Tanzania) found endosulfan in fish tissues in the southern portion of the open lake, while the Winam Gulf Baseline Studies found low levels (3.0 to 1.9 ug kg-1 on a wet weight basis) of DDE (the major metabolite of DDT in fish tissues).
MBITA CAUSEWAY
Experienced accounts from the local fishermen indicate that a strong current used to flow through the blocked Mbita Pass. It could bring large qualities of fish from the main lake. The currents would transport water masses low in dissolved substances and a return flow was high in dissolved substances discharged from the Nyanza Gulf. This process perhaps had the positive effect of flushing the Gulf. It is possible that the discontinued interplay between the waters of the Gulf and the mainlake may have a direct bearing to the increasing incidence of algal blooms and dead fishes. A study covering a much greater area of Lake Victoria may present a better picture of the part played by water movements. From such data collected: (a) the flushing of nearshore waters with cleaner offshore waters can be estimated, and (b) the movement of deep bottom deoxygenated water to the surface that could lead to fish mortality can be predicted.
CONCLUSION
The recurrent fish kills of the species Lates niloticus, Oreochromis niloticus and Rastrineobola argenteus can be attributed to dissolved oxygen depletion due to water movements and the die-offs of the algal blooms. The occurrence of dead fishes with physiological adaptations to survive low levels of dissolved oxygen such as Clarias mossambicus suggests that some contaminant in very low concentrations may also be responsible for the recurrent kills. Studies of Lake Victoria reveal many uncertainties. We know it is a sink, and that many contaminants, particularly conservative and refractory chemicals, tend to accumulate in the water, sediments, and the biota including fish. To assess the significance of such accumulations careful planning of the studies are required which, to be definitive, must integrate water, knowledge concerning water circulation and residence time, rates of sediment accumulation at various points in the lake, and fish species and age.
The diminishing status of Lake Victoria's tilapias, Haplochromis, Protopterus, Bagrus, etc., has been observed since the Nile perch invasion (Barel et al., 1985). Overfishing has also been a major environmental threat in Lake Victoria (Marten, 1979). Today more than 7.4 million people reside on the Kenyan portion of the Lake Victoria drainage area. As fish form a substantial proportion of the animal protein in the diet, a failure in the fisheries due to fish kills would be a national disaster. The loss of the larger size classes will mean that fishermen on Lake Victoria will have more difficulty finding larger fish. However, the rapid growth of the many smaller individuals still present will mean that this may only be a temporary phenomenon.
REFERENCES
Akiyama, T., A.A. Kajumulo and S. Olsen, 1977. Seasonal variation of plankton and physico-chemical condition in Mwanza Gulf, Lake Victoria. Bull.Freshwat.Fish.Res.Lab., Tokyo, 27:49–61
Alabaster, J.S., 1981. Review of the state of aquatic pollution of East African inland waters. CIFA Occas.Pap., (9):36 p. Issued also in French
Allanson, B.R. and R.G. Noble, 1964. The tolerance of Tilapia mossambicus (Peters) to high temperatures. Trans.Am.Fish.Soc., 93:323–32
Barel, C.D.N., et al., 1985. Destruction of fisheries in Africa's lakes. Nature, Lond., 315:19–20
Beadle, L.C., 1981. The inland waters of tropical Africa. Second edition. London, Longman, 475 p. 2nd ed.
Brown, L.H. and E.K. Urban, 1969. The breeding biology of the great white pelican Pelecanus onocratus roseus at Lake Shala Ethiopia. Ibis, 111:199–237
Bugenyi, F.W.B., 1986. Mystery in Victoria water explained. Weekly Topic, 3:1–2
Bwathondi, P.O.J., F.M.M. Chale and E.B. Katunzi, 1984. Mass mortality of fishes in Kagera side of Lake Victoria, 29 April–1 May 1984. Report, Mwanza, TAFIRI (mimeo)
Coe, M.J., 1966. The biology of Tilapia grahami Boulenger in Lake Magadi, Kenya. Acta Trop., 23:146–77
Cridland, C.C., 1962. Laboratory experiments on the growth of Tilapia spp. The effect of light and temperature on the growth of T. zillii in aquaria. Hydrobiologia, 20:155–67
Denny, P., 1972. Lakes of southwestern Uganda Physical and chemical studies on Lake Bunyoni. Freshwat.Biol., 2:143–58
Fish, G.R., 1956. Some aspects of the respiration of six species of fish from Uganda. J.Exp.Biol., 33:186–95
Fish, G.R., 1956a. Chemical factors limiting phytoplankton growth in Lake Victoria. E.Afr.Agric.For.J., 21:152–8
Fish, G.R., 1957. A seiche movement and its effect on the hydrology of Lake Victoria. Fish.Publ.Colon.Off., Lond., (10):68 p.
Foxall, C.D., 1981. Levels of organochlorine biocide residues in fish from Lake Victoria. Some preliminary findings. In Proceedings of the Workshop of the Kenya Marine and Fisheries Research Institute on aquatic resources of Kenya. 13–19 July 1981, Mombasa, Kenya. Nairobi, Kenya National Academy for the Advancement of Arts and Sciences, pp. 256–63
Graham, M., 1929. The Victoria Nyanza and its fisheries. A report on the fishing survey of Lake Victoria 1927–28, and Appendixes. London, Crown Agents for the Colonies, 255 p.
Gwahaba, J.J., 1973. Effects of fishing on the Tilapia niloticus (Linne 1757) population in Lake George, Uganda, over the past 20 years. E.Afr.Wildl.J., 11:317–28
Hunter, J.B., 1970. Observations on the taxanomy and biology of Lates niloticus (Cuvier 1828) in Lake Albert. Occas.Pap.Uganda Fish.Dep., (3):1–7
Kallqvist, T. and B.S. Meadows, 1977. Pesticide levels in the Kenya rural environment. Afr.Environ., 1:163–70
Lowe-McConnell, R.H., 1958. Observations on the biology of Tilapia niloticus Linne (Pisces, Cichlidae) in East African waters. Rev.Zool.Bot.Afr., 55:353–73
Lowe-McConnell, R.H., 1975. Fish communities in tropical freshwaters. London, Longman, 337 p.
Marten, G.G., 1979. Predator removal: Effect on fisheries yields in Lake Victoria (East Africa). Science Wash., 203:646–8
Melack, J.M., 1979. Photosynthetic rates in four tropical African fresh waters. Freshwat.Biol., 9:555–71
Ochumba, P.B.O., 1985. Fish deaths in Lake Victoria. Swara E.Afr.Wildl. Soc., (8) March/April issue:17
Ochumba, P.B.O. and D.I. Kibaara, Observations on cyanobacterial blooms in the open waters of Lake Victoria, Kenya (in preparation)
Okedi, J., 1971. Further observations on the ecology of the Nile perch, Lates niloticus in Lake Victoria and Lake Kyoga. Annu.Rep.E. Afr.Freshwat.Fish.Res.Org., (1970):42–54
Onyari, J.M., 1986. The determination of mercury, lead, cadmium, copper and zinc in fish, selected shrimp and sediments of Kenya's freshwater and marine environments. M.Sc. Thesis. University of Nairobi, Kenya, 279 p.
Tait, C.C., 1967. Mass fish mortalities. Fish.Res.Bull.Zambia, (3):28–30
Talling, J.F., 1966. The annual cycle of statification and phytoplankton growth in Lake Victoria (East Africa). Int.Rev.Gesamt. Hydrobiol., 51:545–621
Talling, J.F. and I.B. Talling, 1965. The chemical composition of African lake waters. Int.Rev.Gesamt.Hydrobiol., 50:421–63
Visser, S.A., 1974. Composition of water of lakes and rivers in East and West Africa. Afr.J.Trop.Hydrobiol.Fish., 3:43–60
Welcomme, R.L., 1964. The habitat and habitat preferences of the young of the Lake Victoria Tilapia spp. (Pisces:Cichlidae). Rev.Zool.Bot.Afr., 70:1–28
Table 1
Counts of dead fishes found floating in the Kenyan portion of Lake Victoria
| Date | Counting days | No. dead fishes counted | Area covered by dead fish (km) | Location | Comment | ||||||
| (a) | (b) | (c)* | (d) | (e) | (f) | Total | |||||
| June '84 | 2 | 12 | 19 | 106 | - | - | - | 31 | 2.0 | NG | Algalbloom |
| Sept. '84 | 1 | 27 | 28 | - | - | - | - | 35 | 0.2 | NG | |
| Jan. '85 | 7 | 89 | 19 | - | - | - | - | 108 | 18.0 | NG, OL | |
| Feb. '85 | 10 | 82 | 18 | 106 | - | - | 4 | 104 | 20.0 | NG, OL | |
| March '85 | 8 | 110 | 55 | 10 | - | - | 2 | 167 | 15.0 | NG, OL | Algalbloom |
| April '85 | 17 | 78 | 27 | - | - | - | - | 105 | 30.0 | OL | |
| May '85 | 7 | 44 | 19 | - | - | - | - | 63 | 25.0 | NG, OL | |
| June '85 | 10 | 65 | 433 | 106 | 29 | 22 | 17 | 566 | 12.0 | OL | |
| July '85 | 10 | 37 | 4 | - | - | - | - | 41 | 4.0 | OL | |
| Oct. '85 | 7 | 8 | 33 | 10 | - | - | 3 | 44 | 5.0 | OL | |
| Nov. '85 | 8 | 58 | 11 | - | - | 2 | - | 71 | 11.0 | OL | |
| Jan. '86 | 2 | 9 | 2 | - | - | - | - | 11 | 3.0 | OL | |
| Feb. '86 | 7 | 79 | 12 | 106 | - | - | - | 91 | 16.0 | OL | Algalbloom |
| May '86 | 9 | 146 | 31 | 106 | - | 3 | 4 | 184 | 12.0 | OL | Algalbloom |
| June '86 | 5 | 22 | - | - | - | - | - | 22 | 6.0 | OL | |
| July '86 | 5 | 28 | 9 | - | - | - | - | 37 | 8.0 | NG, OL | |
| Aug. '86 | 8 | 83 | 6 | 105 | - | 3 | - | 93 | 13.0 | NG, OL | |
(a) Lates niloticus
(b) Oreochromis niloticus
(c) Rastrineobola agenteus
(d) Bagrus docmac
(e) Clarias mossambicus
(f) Barbus altianalis
* Estimated count is not included in the total count
NG = Nyanza (Kavirondo) Gulf
OL = Open water of Lake Victoria
Table 2
Variation in the mean conductivity, turbidity, alkalinity, pH and Secchi depth during the period of study
| Station | 34 | 32 | 103 | 105 | 53 | 51 | |
| Conductivity (us cm-1) | Aug. '84 | 103.8 | 95.5 | - | - | - | - |
| Sept. '85 | 117.2 | 99.8 | 99.1 | - | 99.3 | 98.4 | |
| Oct. '85 | 103.3 | 102.0 | 100.2 | - | 123.0 | 104.6 | |
| Feb. '86 | 95.0 | 88.1 | 87.0 | - | 91.0 | 85.6 | |
| May '86 | 99.0 | - | 89.6 | - | 100.0 | 105.0 | |
Turbidity (NTU) | Sept. '85 | 3.6 | 2.6 | 1.5 | 8.8 | 10.4 | 14.7 |
| Oct. '85 | 4.1 | 3.2 | 1.7 | - | 33.7 | - | |
| Feb. '86 | 21.7 | 6.5 | 3.2 | - | 12.3 | - | |
| May '86 | 4.1 | - | 2.5 | 9.7 | 4.7 | 19.0 | |
| Alkalinity (mg(HCO3+CO3) | Sept. '85 | 52.0 | 4.5 | 4.6 | 4.3 | 4.5 | - |
| Oct. '85 | 52.5 | 5.2 | 5.1 | - | 5.8 | 5.3 | |
| Feb. '86 | 49.0 | 4.2 | 4.6 | - | 5.0 | 5.1 | |
| May '86 | 47.1 | - | 4.9 | 6.0 | 3.7 | 6.3 | |
| pH | Sept. '85 | 8.14 | 8.85 | 8.15 | 8.15 | 8.8 | - |
| Oct. '85 | 7.96 | 8.82 | 7.94 | - | 7.75 | 7.6 | |
| Feb. '86 | 7.51 | 7.76 | 7.86 | - | 9.40 | 7.65 | |
| May '86 | 7.42 | - | - | 7.5 | 7.80 | 8.0 | |
Secchi depth (m) | Sept. '85 | 1.50 | 1.90 | 2.50 | 1.20 | 0.85 | 1.10 |
| Oct. '85 | 1.35 | 1.35 | 1.65 | 0.90 | 0.50 | 0.80 | |
| Feb. '86 | 0.20 | 0.60 | 1.10 | 0.60 | 0.35 | 0.40 | |
| May '86 | 1.40 | - | 1.70 | - | 0.50 | 0.80 | |
NTU = Nephelometric turbidity units
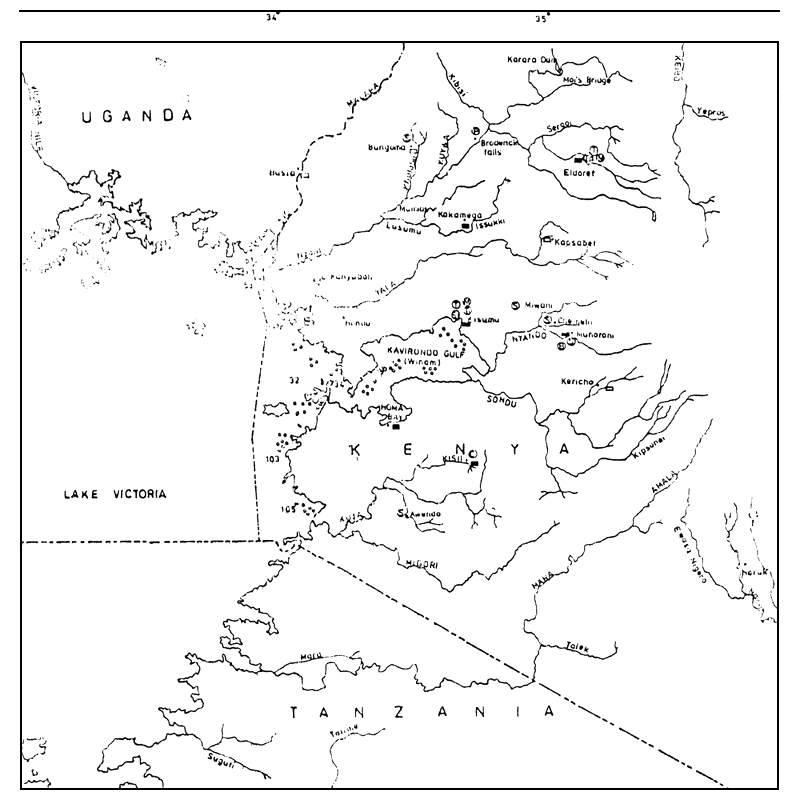
Figure 1 The Kenyan portion of Lake Victoria showing drainage, location of dead fish and potential sources of pollution
| KEY: | x | Mbita Causeway | Water Borne Sewage Systems | Population | |
| o | Dead Fishes | Town | |||
| MAJOR INDUSTRIES: | |||||
| Bungoma | 13 800 | ||||
| P | Paper Mills | Busia | 3 700 | ||
| T | Textiles | Eldoret | 73 100 | ||
| B | Breweries Distilleries | Homa Bay | 11 000 | ||
| Tn | Tanneries | Kakamega | 32 000 | ||
| C | Coffee Processing | Kapsabet | 6 000 | ||
| S | Sugar Refineries | Kericho | 26 000 | ||
| Si | Sisal Factories | Kisii | 17 900 | ||
| M | Miscellaneous Industries | Kisumu | 168 000 | ||
| Kitale | 34 300 | ||||
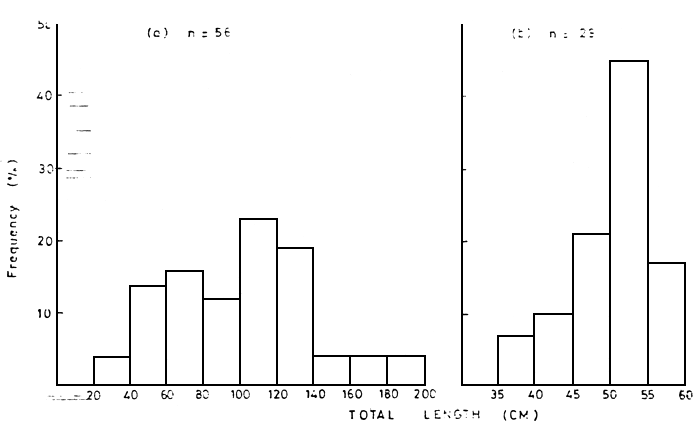
Figure 2 Total length frequency distributions of dead fishes (a) Lates niloticus and (b) Oreochromis niloticus in the Nyanza Gulf of Lake Victoria during August, September and October 1984
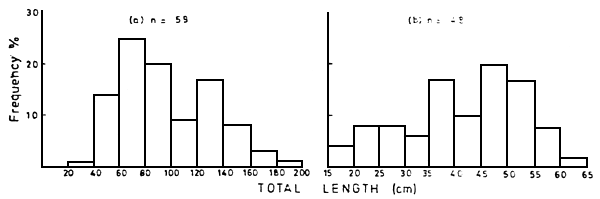
Figure 3 Total length frequency distributions of dead fishes (a) Lates niloticus and (b) Oreochromis niloticus in the open waters of the Kenyan portion of Lake Victoria during 1985
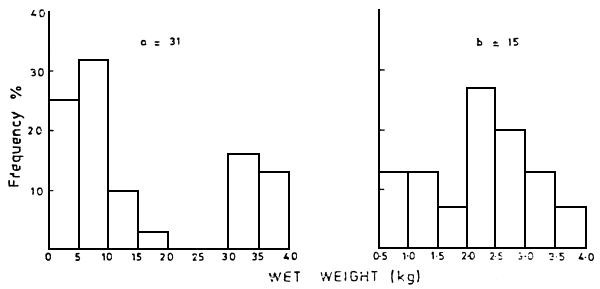
Figure 4 Wet weight distributions of dead fishes (a) Lates niloticus and (b) Oreochromis niloticus in the open waters of the Kenyan portion of Lake Victoria during 1985
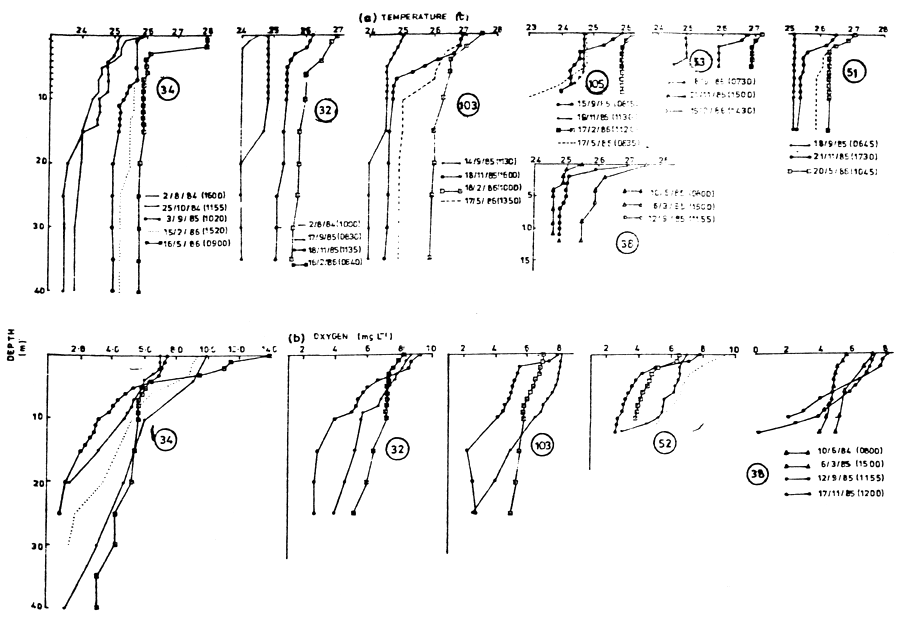
Figure 5 Temperature (a) and oxygen (b) depth profiles from several sampling stations in Lake Victoria when dead fishes were observed (34 - Rusinga Channel; 32 - Bridge Island; 51 - Sumba Channel; 53 - Off Nzoia River; 103 - Ukongo Point, and 105 - Off Kuja River)
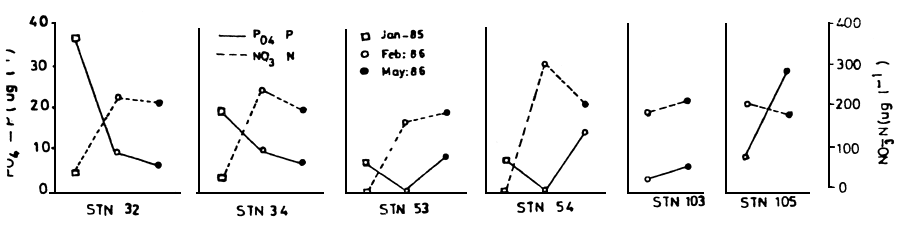
Figure 6 PO4 - P (—) and NO3 (---) for various sampling stations in January 1985 (□), Febuary 1986 (o) and May 1986 (•)
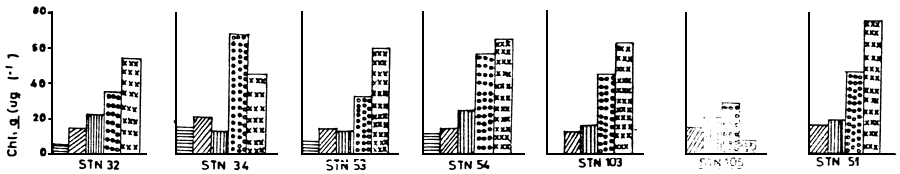
Figure 7 Chlorophyll a concentration for various sampling stations in January 1985  , September 1985
  ,
November 1985
,
November 1985  , February 1986
  and May 1986
![]()
![]()
![]()