
|
PROCEEDINGS OF THE CRUSTACEAN MANAGEMENT WORKSHOP |
March 1987
RAF/79/065/WP/34/87
organized by the
Regional Project for the Development and Management of Fisheries in the Southwest Indian Ocean (SWIOP)
The designations employed and the presentation of material in this publication do not imply the expression of any opinion whatsoever by the Food and Agriculture Organization of the United Nations concerning the legal status of any country, territory, city or area or of its authorities or concerning the delimitation of its frontiers or boundaries. The views expressed are those of the authors.
These are the proceedings of the workshop on crustacean management for countries of the Southwest Indian Ocean region, which took place in Mauritius at the Albion Fisheries Research Centre from 1 - 11 October 1985. The workshop was organised by the FAO/UNDP Regional Project for the Development and Management of Fisheries in the Southwest Indian Ocean (SWIOP), to provide a forum to review the status of resources and fisheries, demonstrate biological and economic analytical methods and levels, and for promoting discussions on the management measures appropriate for the region.
These proceedings consist of the papers presented on the biological and bio-economic aspects of crustacean fisheries including aquaculture, and country statements which were presented by the participants at the workshop. Papers already published elsewhere were not included. Abstracts of all presentations can be found in the Report of the Workshop (RAF/79/065/WP/23/86), which also contains an account of the workshop discussions.
In preparing these proceedings textual amendments of the papers has been minimal. Revision has been restricted to the correction of typographical errors and the like.
by
M.J. Sanders
(FAO ROME)
This short paper has been prepared as a background document to the Crustacean Management Workshop. It relates particularly to the crustacea resources of the countries serviced by the Southwest Indian Ocean Project, but also includes reference to the lobster stocks of the St. Paul and New Amsterdam Islands which are exploited from Reunion.
The principal contents are the biomass and potential yield estimates (when available), and some indications of the present state of exploitation. Shrimp, lobster and crabs are treated separately. There is a further distinction between shallow-water crustacea (occuring principally in waters less than 100 m) and deep-water crustacea.
Each country is treated separately except for the Seychelles, Mauritius, Comoros and Reunion, which are considered together within the category 'Islands and Banks'. They all fall within the FAO statistics area code 51 (Figure 1).
The shallow-water shrimps occur along almost all the coast of Mozambique. The artisanal fishery operates close to shore in less than 5 m depth and is not well understood. The species Acetes erythraeus is believed to form an important part of the total landings, along with juvenile Penaeid shrimps.
Landings of 4000 tons (believed to be an underestimate) for traps, beach seines and cast nets were determined for 1980 in respect to the most productive grounds adjacent to the Sofala Bank (Brinca and Palha de Sousa, 1984). An additional 400 tons is believed to be landed by the artisanal fishermen using beach seines in Maputo Bay (M.I. Sousa, personal communication).
The main fishery involving industrial and semi-industrial trawlers is operated out to about 25 m depth on the Sofala Bank; between Angoche and the delta of the Zambezi River and between Beira and Chiloane (Figure 2). The landings have been about 8000 tons (whole weight) in recent years compared to 10000 to 12000 tons in 1974 (Brinca and Palha de Sousa, 1984).
The second most productive grounds are in Maputo Bay where a fleet of small-scale trawlers has landed about 300 to 400 tons in recent years (M.I. Sousa personal communication).
Penaeus indicus and Metapenaeus monoceros are by far the most abundant species, each contributing some 45 percent to the landings for the Sofala Bank. Of the others, P. monodon, P. semisulcatus and P. japonicus are the more important.
The first substantial assessment of biomass and potential yield is given in Ulltang, Brinca and Silva (1980) for the Sofala Bank fishery. Using catch per unit effort data for part of the industrial fleet, and an estimate of the area of fishing grounds (17000 km2), the mean biomass was estimated as 5000 tons in 1974-75 and 8000 tons in 1976. The conclusions from yield per recruit analyses were that the effort could be increased by a third (from the 1974-75 level), giving a possible 16 percent increase in yield to 14000 tons.
The most recent and somewhat similar assessment, also for the Sofala Bank fishery, is based on survey and commercial vessel data for the years 1980 up to and including 1983 (Ulltang, Brinca and Sousa; 1985). It was concluded that the 1982 level of fishing effort was about optimal, and that increases beyond this level should be avoided. Also included is a proposal that the effort be controlled indirectly through the administration of an annual fishery quota.
The beginning of the year catches per unit effort were shown to reflect annual recruitment, and also to be useful in forecasting the mean catch per unit effort for the year. It was suggested that this could be used to determine the quota, calculated as the product of the latter and the desired annual fishing effort.
In his review of the resources of Mozambique, Saetre (1984) gives a biomass range of 10000 to 14000 tons; and a potential yield range from 8000 to 13000 tons. These values relate to the stocks exploited by the industrial trawlers on the Sofala Bank.
The species of principal commercial important are Haliporoides triarthrus and Aristeomorpha foliacea. They are exploited in water depths from 400 to 700 m. During each of 1983 and 1984 the commercial landings were 1572 tons and 1461 tons (whole weight) respectively (C. Silva, personal communication). This involved the use of four trawlers from the German Dem. Rep. and the part-time use of 18 Spanish and three Soviet trawlers.
The most comprehensive assessment for the shrimps is based on surveys from the F/V ERNST HAECKEL. They were conducted during each of August-September 1980, November-December 1980, January-February 1981 and January-February 1982 (Brinca et al., 1983). Another less comprehensive assessment from the results of surveys undertaken during 1976 and 1977 is given in Saetre and De Paula e Silva (1979).
The determination of biomass from the F.V ERNST HAECKEL survey data involved raising the mean catches per hour by the 'area surveyed/area covered per trawl hour'. The efficiency of the trawl net was assumed to be 100 percent. The values obtained from the data for each survey were generally close to 3000 tons and relate to a total area of about 19755 km2 (Table 1 and Figure 3).
Some 60 percent of this biomass was determined to occur in the survey regions 1, and 20 percent in each of region as 2.1 and 2.2. Separate biomass estimates of about 1000 tons were determined for about 5560 km2 of grounds having depths of 450 to 550 m and between 25° 40' S and 26° 20' S (Table 2). The commercial exploitation of the shrimps occurs principally on these grounds.
The shrimp species most prevalent in the catches during the surveys were H. triarthrus (50 to 60%), A. foliacea (mostly 10 to 20 percent) and Aristeus spp. (about 5%); see Table 3.
The potential annual yield of deep-water shrimps is given as 2000 tons in Saetre (1984) along with the recommendation that there should not be any significant increase in the fishing effort.
The distribution of Palinurus delagoæ is principally in water depths from 200 to 400 m and is scarce North of 21° S (Figure 4). In recent years, exploitation has principally involved a single Japanese vessel equipped with traps attached to long lines. The landings in each of 1983 and 1984 were 203 tons and 141 tons (whole weight) respectively (C. Silva personal communication). The involvement of this vessel ceased during 1985. An unknown quantity was previously taken from South African trawlers which recommenced operations from the end of 1984.
The surveys judged most useful for an assessment of the lobster stocks were conducted during June-August 1976, October-February 1977 and April-June 1977 from the Soviet trawler F/V AELITA (Budnichenko et al., 1977). The vessel was equipped with a special lobster trawl having a 55 m horizontal opening.
Similar although less comprehensive coverages involved the trawler F/V KATTEGAT from the German Dem. Rep. during October-December 1977, and the Norwegian research vessel R.V. Dr FRIDTJOF NANSEN in August-June 1978, (Anonymous, 1978 and Saetre and Paula e Silva, 1979).
Biomass estimates totalling 709 tons (during summer) and 222 tons (during winter) were determined by the latter authors, principally on the results of the F/V AELITA surveys (Table 4). The efficiency of the trawl nets were assumed to be 100% and the catches per hour raised by the 'area surveyed/area covered per trawl hour' to get the biomass.
Budnichenko et al, (1977) assumed the trawl efficiency to be 33.3% and using the F/V AELITA data alone obtained an estimate for the summer biomass of 1850 tons.
The potential annual yield is suggested as 300 tons by Saetre and de Paula e Silva (1979), based on an extrapolation from nearby Natal where it has been claimed that the potential yield is some 25 percent of the biomass. Another estimate of 400 tons for the potential yield is given in Saetre (1984). These values are not much different from the 335 tons caught in traps during 1981, as reported in Brinca and Palha de Sousa (1983).
The species Metanephrops andamanicus has also been determined as occuring at depths between 300 to 500 m and are most abundant between 350 and 450 m (Saetre and de Paula e Silva, 1979). Within these depths the distribution seems patchy and is apparently localised to the Bazaruto area and the Western slope of the Boa Paz Bank.
In recent years small incidental catches of less than 10 tons have been landed from the Japanese vessel engaged in trap fishing for the deep-water lobster (P. delagoæ). They are apparently not readily caught by trawling, due to the habit of burrowing into the bottom substrate. The quantity landed by trawlers is unknown, but presumed to be small.
There have been no attempts to estimate the population biomass. A 'guesstimate' of a few hundred tons for the potential yield is given in Saetre (1984).
The presence of the deep-water crab (Geryon quinquedens) was established by exploratory pot fishing. Up to 72 individals or 30 kg per pot were obtained in Delagoa Bay in depths of about 350 m (Saetre and de Paula e Silva, 1979). Subsequent commercial fishing has established its presence in depths beyond 1000 m.
Until recently the exploitation of crabs has been as a by-catch from the Japanese vessel engaged in trap fishing for the deep-water lobster (Palinurus delagoæ). The catch during 1984 totalled 1095 tons (whole weight), compared to less than 50 tons in the immediately preceeding years (C. Silva personal communication).
As yet there have been no attempts at estimating the population biomass or potential yield.
The crustacea resources of Mozambique are reasonably well known as a consequence of exploratory surveys and investigations of the existing commercial fisheries. As indicated in the following tabular summary, the present landings are generally at or near the estimates of potential yield. Management priority is now being directed towards stabilising the landings at about their present levels.
The industrial exploitation of shallow-water shrimp commenced in 1967, with the principal species in the catches being Penaeus indicus (about 80 to 90% of shrimp catch), Metapenaeus monoceros. Penaeus semisulcatus. Penaeus japonicus and Penaeus monodon. The depth distribution is generally up to 45 m, with much of the fishing being between 4 to 15 m.
Since 1971 the annual landings have been mainly between 4000 to 6000 tons (Table 5). The trawling grounds are divided into seven areas (Figure 5) and in respect to each of these an allowable catch has been evaluated in Ralison (1978).
According to Rey (1982) these are administered as follows:
| - | Zone 1: | covers the Nosy-Be area, Ambaro and Tsimipaika Bay. |
| The permissible catch is 1560 tons/year; | ||
| - | Zone 2: | Natendry Bay. |
| The permissible catch is 760 tons/year. Only eight | ||
| trawlers are allowed; | ||
| - | Zone 3: | Mahajamba Bay. |
| The permissible catch is 320 tons/year. Only three | ||
| trawlers are allowed; | ||
| - | Zone 4: | Mahajanga. |
| The permissible catch is 310 tons/year. Only three | ||
| trawlers are allowed. | ||
| - | Zone 5: | Cap Tanjona. |
| The permissible catch is 930 tons/year. Only ten | ||
| trawlers are allowed; | ||
| - | Zone 6: | Cap San Andre. |
| The permissible catch is 1270 tons/year. | ||
| - | Zone 7 | Area between Nosy Voalavo and South of Morondave. |
| and 8: | The permissible catch is 1000 tons/year. More than ten | |
| trawlers are allowed. |
The regulations also provide for a minimum mesh size in the cod-ends, a maximum total headline length for the twin trawls used by each vessel of 77 m, and a prohibition on trawling within two n. miles of the coast. There is also a closed season applying to the industrial fishery from December 15 to February 15.
There have been a number of comprehensive assessments of the shrimp stocks. Ralison (1978) and Marcille (1978) determined maximum sustainable yields of about 6 000 tons (whole weight) from applying production model analyses to the catch and effort data for 1967 through 1977.
Marcille (1978) also applied analytical (Beverton and Holt) type models to show how the mean size (and hence value) of the shrimps in the catches decreased with increasing fishing effort.
Both considered economic factors to be important. Ralison (1978) determined that the maximisation of fishery profits would occur at roughly half the catch which maximises yields. He also estimated that the fishery profits would be generally negative when the yields were maximised.
In respect to the relationship between the artisanal and industrial fisheries, Marcille (1978) concluded that suppression of the fixed trap fishery in Ambaro Bay could lead to an increase in the trawl catch by 8 to 30 percent (depending on the value of the natural mortality coefficients used in the calculations).
Lobster are caught by traditional methods principally in the Tolagnaro region. The species comprising the catches are Panulirus versicolor, ornatus, longipes and penicillatus. Since 1979 a system of collecting lobster for export has operated in this region. The landings in recent years are reported as between 60 and 90 tons (whole weight) (FAO Yearbook of Fishery Statistics). There have been no assessments of potential yields. Management includes a closed season from January 1 to April 30.
Rey (1982) reports that crabs (Scylla serrata) are purchased from the small-scale fishermen for subsequent export. They are presumably also landed from the shrimp trawlers. The landings during 1983 are reported as 477 tons (whole weight) (FAO Yearbook of Fishery Statistics). This is less than in earlier years (nearly 700 tons in each of 1978 and 1979). There has been no assessment of the potential yields of these crabs.
The shallow-water shrimps have been comprehensively studied. Sufficient capacity exists within the fleet to fully realise the potential yield. Management of the industrial trawlers includes licence limitation, supplemented by annual quotas for each coastal region. Consideration is also being given to encouraging a reduction in the fishing effort towards reducing the quantities landed so as to improve profitability. The other crustacea resources contribute little to the total landings.
ITEM |
LANDINGS |
POTENTIAL YIELD |
|---|---|---|
(tons) |
(tons) |
|
| Shallow-water shrimps : | ||
| - industrial | 5 800 |
6 000 |
(1984) |
||
| - artisanal | unknown |
included in above? |
| Deep-water shrimps : | ||
| - industrial | none |
unknown |
| Shallow-water lobster : | ||
| - artisanal | 60-90 |
unknown |
(1981/82/83) |
||
| Deep-water lobster : | ||
| - industrial | none |
unknown |
| Shallow-water crabs : | ||
| - artisanal | 477 |
unknown |
(1983) |
||
| Deep-water crabs : | ||
| - industrial | none |
unknown |
Exploratory trawling for shallow-water shrimps has been carried out by the East Africa Marine Fisheries Research Organization (EAMFRO) in 1959 using the R/V MANIHINE and R/V CHERMIN; summarised in Venema (1984). During the period June through December 1968 the R/V SAGAMA MARU of the Kanagawa Prefectural Government of Japan also was used for surveys along the Tanzanian coastline (Kanagawa Prefectural Government, 1969). The Bagamoyo and Rufiji regions were identified as having shrimp fishery potential, and commercial trawling commenced from 1969.
The catch and effort data from the commercial vessels from 1969 through 1971 were used to assess the biomass and potential yield for these grounds. This involved estimating mean annual catches per trawling hour and raising these by 'the area occupied by the stock/area covered per hours trawling' (FAO/IOP, 1979, Appendix 7).
The mean catch rates of a TAIKO MARU trawler using twin-rigged 19 m nets and trawling at a speed of 2 knots varied from 22.3 to 26.4 kg/hr (whole weight) on the Bagamoyo grounds and from 25.4 to 31.8 kg/hr on the Rufiji grounds. The area swept by the trawl during an hour was determined as 0.0851 km2. It was assumed that the trawl nets were 100% efficient. The areas of the two fishing grounds were taken as about 950 km2 and 2880 km2 respectively.
On the basis of these data the biomass were determined as 280 tons for Bagamoyo and 940 tons for Rufiji. Assuming that the natural mortality coefficient was M=3.0 (annual), the potential yield for the grounds combined was determined as 1830 tons (whole weight) from the product of half the biomass and the natural mortality coefficient.
The landings from the commercial trawlers reached about 500 tons (whole weight) in 1970, then declined to abut 200 tons when the joint venture company (New Mwananchi Ocean Products) was disbanded (Table 6; and Bwathondi and Mwaya, 1984). A new company (Tanzanian Fisheries Corporation) was subsequently established but as a consequence of operational difficulties the annual landings from trawling has remained at substantially below 200 tons (tail weight); according to Brownell (1982).
Penaeus indicus, Metapenaeus monoceros, P. monodon, P. semisulcatus and P. latisulcatus are identified as the principal species in the landings, particularly the first two in the trawl landings and the third in the landings by the artisanal fishermen.
The annual landings from the artisanal fishery are reported at between about 250 and 500 tons during the years 1965 through 1972 (FAO/IOP, 1979; Appendix 7). Bwathondi and Mwaya (1984) refer to them being at least equal to the landings from the trawlers. The principal methods include stationary traps, cast nets and seines.
Bwathondi (1973) has identified Panulirus ornatus, P. longipes, P. versicolor, P. homarus and P. penicillatus as occuring in Tanzanian waters. The first two are the most abundant, contributing more than 80 percent to the landings (Bwathondi, 1980). The most common fishing method involves the use of a hand-held net and an octopus; the latter is used to flush the lobster so they can be scooped up by the net. They are also caught by traps and gillnets set for catching fish and by divers using spearguns.
The reported landings in the years 1966 through 1975 ranged up to 80 tons (whole weight) (Table 6). Hall (1960) reports 13.56 lb (6.15 kg)/man/day as the mean catch rate by divers for six lightly exploited areas around Zanzibar and 9.98 lb (4.53)/man/day for two more heavily exploited areas.
No assessments of the lobster biomass or potential yields have been undertaken.
Lobsters identified as Linuparus somniosus and Metanephrops andamanicus were regularly caught in depths of 250 to 320 m at the southern end of the Zanzibar Channel during exploratory surveys with the R/V 'Professor Mesyatsev' (Birkett, 1978; VNIRO, 1978 and Burczynski, 1976). The catch rates ranged up to 50 kg/hr (whole weight). These lobsters have not been subject to commercial exploitation.
The crustacea resources are moderately well known; more for the shallow-water shrimps than for the other categories. It seems from the underlying summary table that the shallow-water shrimp are being under-utilized. This is despite attempts over more than 15 years to increase production through he use of industrial and semi-industrial trawlers. The potential to increase the shallow-water lobster landings is unknown. The economic viability for exploiting the deep-water lobster is doubtful.
| ITEM | LANDINGS |
POTENTIAL YIELD |
|---|---|---|
(tons) |
(tons) |
|
| Shallow-water shrimps : | ||
| - industrial and semi-industrial | <200 |
1 830 |
(1980s) |
||
| - artisanal | 250-500 |
unknown |
| Deep-water shrimps : | ||
| - industrial | none |
unknown |
| Shallow-water lobster : | ||
| - artisanal | <80 |
unknown |
(1966-1975) |
||
| Deep-water lobster : | ||
| - industrial | none |
unknown |
| probably small | ||
| Shallow-water crab : | ||
| - artisanal | unknown |
unknown |
| Deep-water crab : | ||
| - industrial | unknown |
unknown |
Shallow-water shrimps exist principally in depths out to 25 fathom (46 m) in Ungama Bay and off nearby Sabaki and Mambrui. They are also abundant within the estuaries, the largest being at Mombasa and Kilifi. Commercial trawling occurs mainly in Ungama Bay.
During 1984 seven vessels (including one for transporting catches to Mombasa) landed 294 tons (whole weight) of shrimps and 445 tons of fish (information from Fisheries Department in Mombasa). Commercial operators consider these stocks at or close to full exploitation.
Monthly survey cruises in Ungama Bay with the R/V SHAKWE (during Devember 1969 through February 1971) and cruises with the small F/V FAIRTRY (7.6 m) off nearby Sabaki and Mambrui (during June through November 1970 and in January/February 1971) provided shrimp biomass estimates of between 112 to 353 tons (whole weight) (Brusher, 1974; and Table 7).
The most abundant species in the catches were Penaeus indicus (75 to 90%), Metapenaeus monoceros, P. semisulcatus, P. monodon and P. japonicus.
Surveys were also undertaken in the Mombasa and Kilifi estuaries from April through August 1970 from a small outboard-driven boat (5.3 m) equipped with a 3.2 m trawl. Generally the catch rates were less than 2 kg/hour. This was followed by more intensive surveying in the Kilifi estuary during August-September 1970, when 69 hauls with an 8.2 m trawl provided mean catch rates of 3.6 kg/hour (FAO, 1971).
Penaeus semisulcatus was the principal species in the catches from the Mombasa estuary and P. indicus in respect to the Kilifi estuary. The catches consisted mainly of juveniles.
The exploitation of shrimps (and fish) within the estuaries mainly involves the use of stationary traps. A few fishermen also use trawls from small powered and unpowered boats, and beach seines. Apart from the five species previously mentioned, quantities of Acetes erythraeus are caught seasonally, particularly inthe shallow waters of Malindi Bay.
The landings of shrimps by the artisanal and small-scale fishermen from the estuaries and near-shore during 1984 is reported as 111 tons (information from Fisheries Department in Mombasa).
Deep water shrimp identified as mainly Heterocarpus woodmasoni were caught during trawl surveys with the F/V UJUZI from 1979 through 1981 (FAO/UNDP, 1982). They were found most abundant at depths of around 200 fathom (366 m) and offshore from Ungama Bay (Figure 6). The total biomass was determined as 1006 tons (whole weight) and occuring on grounds having a trawlable area of 2952 nm2 (10125 km2).
Highest densities were located offshore from Malindi, where a biomass of 144 tons was determined for an area of 45 nm2 (154 km2). The potential yield from this ground was determined as 108 tons.
An attempt at commercial trawling was undertaken from the Kenya owned F/V KUSI (40 m and 1400 HP) during a 14 month period from January 1978. Priority was directed towards landing shrimp and the catch rates obtained ranged from 0.1 kg/hr to 200 kg/hr (Mutagyera, 1984).
There have been no subsequent attempts at the commercial exploitation of the deep-water shrimp. The desk study reported in FAO/UNDP (1982) concluded that offshore trawling (for fish and/or crustacea) would generally not be profitable.
The commercial exploitation of lobsters (mainly Panulirus ornatus) occurs along the entire Kenyan coastline (Figure 7). The main fishing grounds are in the North, around the islands of Lamu, Manda, Pate and Kiwayu (Mutagyera, 1978). Much of the landings come from snorkel divers operating to depth of about 4 fathom (7 m) around coral reefs, and to a lesser extent from the use of trammel nets. During 1984 the landings were reported as totalling 127 tons with about 90 percent from around Lamu (from FAO instituted statistics scheme, Coppola personal communication).
The other much less abundant species include P. homarus and P. dasypus (perhaps the same species and mainly found on the North coast around Lamu) and P. versicolar, P. longipes and P. penicillatus which occur principally along the South coast.
A potential yield estimate of 271 tons (whole weight) was determined from the results of experimental fishing with trammel nets conducted by Japanese fishing experts during 1967-68 (Table 8; and FAO 1971). The estimation procedures are not well described, but it appears that the monthly mean catches per 100 m of net were raised by the length of lobster producing coastline. As such the estimates should be used with great caution.
The lobster Puerulus angulatus along with small quantities of Metanephrops andamanicus were found in water depths beyond 100 fathom (183 m) mainly offshore from Ungama Bay to Malindi during the trawl surveys with the F/V UJUZI (Figure 8). An overall biomass of 1177 tons (whole weight) was determined as occuring on a trawlable area of 2133 nm2 (7316 km2), from raising the mean catches per haul by the 'area surveyed/area covered per trawl haul' (FAO/UNDP 1982). The efficiency of the trawls was assumed to be 100 percent.
The ground considered likely to have commercial potential was located directly offshore from Ungama Bay; where a mean biomass of 330 tons was determined for an area of 66 nm2 (226 km2). The potential yield for this ground, from the product of half the biomass and an assumed natural mortality coefficient, was determined as 140 ton (FAO/UNDP, 1982).
An unsuccessfull attempt at establishing a commercial fishery involved the F/V AEGINA (60 m length and 1,600 HP). Operations ceased after five weeks during 1981. There have been no subsequent attempts at the commercial exploitation of deep-water lobster.
The shallow-water shrimps are claimed to be at or near fully exploited; however this requires substantation through a comprehensive investigation of the commercial fishery. Both the deep-water shrimp and lobster resources are known. Attempts at commercial exploitation of these stocks have so far been unsuccessful.
| ITEM | LANDINGS |
POTENTIAL YIELD |
|---|---|---|
(tons) |
(tons) |
|
| Shallow-water shrimps : | ||
| - industrial and semi-industrial | 294 |
168-530 * |
(1984) |
||
| - artisanal | 111 |
unknown |
(1984) |
||
| Deep-water shrimps : | ||
| - industrial | none |
108 |
| Shallow-water lobster : | ||
| - artisanal | 127 |
271 |
(1984) |
||
| Deep-water lobster : | ||
| - industrial | none |
330 |
| Shallow-water crab : | ||
| - artisanal | 56** |
unknown |
(1983) |
||
| Deep-water crab : | ||
| - industrial | none |
unknown |
Panaeid shrimp are found near the mangrove area south of the River Juba to the Kenya borders. Suitable depth and substrate are claimed to exist over an area of 200 km2 off the mangroves. Based on yields from Kenya, a potential yield estimate for shrimp in Somalia of about 400 tons (whole weight) per year was determined by the White Fish Authority (1979)
Shrimp trawling trials in the Juba estuary by Japanese have been interpreted as indicating potential annual catch rates per vessel of 20 tons (whole weight) of shrimp and 250 tons of fish (comment by S. Larsson in FAO internal report).
An estimate of the 1981 landing of shallow-water shrimp is given as 100 tons (whole weight) in Pecker (1982). This relates to the use of an ex-trawler as a base from which shrimp were purchased from local artisanal fishermen. The total landings from all sources is probably greater.
The deep-water shrimp (Heterocarpus spp.) are reported as an important component of the by-catch of the industrial trawlers operating in 200 to 400m depth off the northeast coast of Somalia (Johnsen, 1984). No assessments have been undertaken for these species nor have they been separately identified in the landings statistics.
Shallow-water lobster occur along the east and north coasts. A report by the White Fish Authority (1979) refers to the potential yield being not greater than 500 tons (whole weight) annually for the whole coastline. Little information is available concerning the present landings which are taken usually by divers (using octopus bait) and sometimes by cast nets. Pecker (1982) refers to the 1981 catch as 80 tons mainly from the southern coast around Kisimaayu. A similar quantity was reported as being landed from the Southern coast during 1983 by Elmer (1985).
Management includes a prohibition on landing berried females, a minimum weight of 460 grammes, and a minimum total length (eye to end of tail) of 23 cm.
An assessment of the dep-water lobster (Puerulus carinatus and Puerulus sewelli) resulting from a 30 day cruise on the F/V CUSMAAN GEEDI RAAGE concluded the overall biomass for these species as 639 tons and 1,094 tons respectively (Johnsen, 1984). During the cruise the catches ranged from about 100 to 400 kgs (whole weight) per haul of lobster. Another species Metanephrops andamanicus was also present in small amounts.
Separate biomass estimates were determined for each of the fishing grounds (Figure 9 and Table 9). This involved raising the mean catches per haul by the 'area of the ground/area covered per haul'. The efficiency of the trawl nets was assumed to be 100 percent.
The lobster were caught mainly in the depth range of 250 to 400 m. P. carinatus was generally caught South of 10°N and P. sewelli to the North of 8°N.
Commercial exploitation has been underway since 1973, involving both joint-venture arrangements (Somali-Soviet) and the licensing of foreign trawlers. The joint venture (Somalfish) ended in 1977 at which state some 1,150 tons (whole weight) of lobster (and 3,400 tons of fish) were being landed annually (Table 10). Subsequently, Somalia has acquired a small fleet of trawlers. The annual landings from these and licensed Italian vessels is claimed to have been about 10,000 tons of fish and 1,500 tons (whole weight) of lobster in 1981 (Pecker, 1982).
The principal fishery is that involving industrial trawlers catching deep-water lobster (and fish). The small amount of assessment work done so far suggests that the stock of lobster is near or at full exploitation. Confirmation through a more comprehensive investigation is urgently required. The other crustacea are little known and lightly fished.
| ITEM | LANDINGS |
POTENTIAL YIELD |
|---|---|---|
| (tons) | (tons) |
|
| Shallow-water shrimp : | ||
| - industrial and semi-industrial | none |
400 |
| - artisanal | 100 + |
unknown |
(1981) |
||
| Deep-water shrimp : | ||
| - Industrial | unknown |
unknown |
| Shallow-water lobster : | ||
| - artisanal | 80 |
unknown |
(1981) |
||
| Deep-water lobster : | ||
| - industrial | 1 500 |
biomass |
(1981) |
1 733 | |
| Shallow-water crab : | ||
| - artisanal | Unknown |
unknown |
| Deep-water crab : | ||
| - industrial | unknown |
unknown |
Recent unpublished investigations in Mauritius have established the presence of Penaeus latisulcatus, P. canaliculatus, P. semisulcatus and P. monodon. Priority is now being given to developing hatchery rearing techniques as a precurser to encouraging the establishment of a commercial culture industry, particularly based on P. monodon. The landings of shallow-water shrimp from the wild stocks is negligible.
A resource of deep-water shrimp is known to exist around each of the Seychelles, Mauritius and Reunion. Encouraging results have been obtained with experimental pot fishing off the Seychelles and a similar investigation is to commence shortly off Mauritius. Low level intermittent exploitation has taken place in recent years at Reunion. Potential yields are unknown, and so far the landings have been negligible (a few tonnes) (FAO Yearbook of Fisheries Statistics). The fishing method is with pots.
Almost the entire landings of crustacea at Reunion are the lobster (Jasus paulensis) caught in waters up to 50 m depth adjacent to the St. Paul and New Amsterdam Islands. Landings which were about 900 tons (whole weight) in the early 1950s declined to about 500 tons in 1962, then rose to over 1000 tons in 1972 and 1973. Subsequently the landings have been around 500 to 600 tons (Figure 10).
Recent exploitation has involved the use of a single mothership supported by dories undertaking usually one trip per year of about two months duration. The fishing method involves the use of pots.
The most comprehensive assessment of the stocks is that of Duhamel (1980) based mainly on the catch and effort data available from 1950 to 1978. Applying a Schaefer model gave an estimate for the maximum sustainable yield of 600 tons for the inshore component. Insufficient data was available to allow a similar assessment for the smaller offshore part of the stock.
The fishery is presently managed from Reunion and includes limiting exploitation to the single vessel previously mentioned, and applying an annual catch quota which is presently 600 tons (Anonymous, 1980 and Bertrand, 1985). This regime has been operating since 1975.
In Mauritius the species Panulirus longipes and P. pennicillatus are reported to occur on the outer edge of the fringing reefs (FAO/UNDP, 1983). They are caught by the small-scale fishermen using traps. The landings during 1983 is given as 59 tons (whole weight) (FAO Yearbook of Fisheries Statistics). The potential yield is unknown but thought to be not much different from the present landings.
Excepting the shallow-water lobster exploited off St Paul and New Amsterdam Islands, the crustacea make only a minor contribution to the total landings from the Islands and Banks. Potential yields are generally unknown, but are likely to be not much greater than the present landings. Greatest interest is presently directed towards exploiting deep-water shrimp stocks, and shallow-water shrimp culture on Mauritius.
| ITEM | LANDINGS |
POTENTIAL YIELD |
|---|---|---|
| (tons) | (tons) |
|
| Shallow-water shrimp : | ||
| - industrial and semi-industrial | none |
unknown |
| (but small) | ||
| - artisanal | negligible |
unknown |
| (but small) | ||
| Deep-water shrimp : | ||
| - industrial | negligible |
unknown |
| Shallow-water lobster : |
|
600 + |
| (known only for | ||
St Paul and New |
||
Holland Islands) |
||
| Deep-water lobster : | ||
| - industrial | none |
unknown |
| (but small) | ||
| Shallow-water crab : | negligible |
unknown |
| (but small) | ||
| Deep-water crab : | ||
| - industrial | none |
unknown |
| (but small) |
The annual landings of crustacea within the region seems presently to be about 25000 tons (whole weight) with shallow-water shrimp contributing roughly 80 percent of this amount. The most productive countries are Mozambique and Madagascar, with 65 and 22 percent of the total landings respectively.
According to present knowledge the potential yield is abut 30000 tons annually. This is not much greater than the present landings. Also having in mind that it may not be profitable to realise some of this potential, it is most likely than any future increases in the landings will be small and localised.
In respect to the separate categories of crustacea, the landings of shallow-water shrimp totalled nearly 20000 tons (whole weight) in recent years. Most of this comes from Mozambique and Madagascar, 70 and 25 percent respectively.
In both countries the shrimp are considered to be fully exploited and this is reflected in the management regimes. Increases in the fishing effort are being discouraged through a combination of licence limitation and fishery quotas in the case of Mozambique and Madagascar.
The other producing countries are Tanzania, Kenya and Somalia. With the possible exception of Kenya, the stocks of shallow-water shrimp in these countries are under-utilised. The additional yield from full exploitation in the future is estimated at about 1000-1500 tons (not including production from aquaculture).
Although stocks of deep-water shrimp are likely to occur throughout the region, almost all the present catch of about 1500 t (whole weight) is taken by trawlers operated off Mozambique. Shrimp are also being taken incidentally with the deep-water lobster off Somalia and with pots adjacent to Reunion.
Only in Mozambique are the deep-water shrimp nearing full exploitation. Views are being expressed that the fishing effort directed towards these stocks should not be substantially increased. In the other countries the management aim is to increase the landings subject to economic viability.
The only substantial fishery for shallow-water lobster occurs adjacent to St. Paul and New Amsterdam Islands. This is managed with the annual landings of about 600 t (whole weight) being fixed by quota and the fishing rights to one enterprise.
In all the other countries the lobster are taken by artisanal fishermen. The quantities landed are generally small and limited by the ability of the fishermen to market their catches. Whenever a suitable marketing infrastructure is established adjacent to productive fishing grounds the fishermen have generally responded with increased landings.
Deep-water lobster are caught off Somalia (1500 t whole weight) and Mozambique; (150 t whole weight) and in both places the stocks ares considered to be at or near fully exploited. A small stock is known to exist off Kenya, although apparently in insufficient quantities to justify exploitation. Lobster probably occur elsewhere within the region, however, this will need to be substantiated by surveys.
Due to their lower value the crab resources have received relatively little attention. In the shallow waters they are taken by the artisanal fishermen for local consumption. Small quantities are processed for distant markets, whenever a suitable marketing infrastructure exists.
The substantial landing of deep-water crab in Mozambique during 1984 (1095 tons whole weight) is a recent development based on the use of pots from a single vessel. As yet it is unknown whether catches of this magnitude can be sustained over a number of years.
Anonymous, 1978 Report on the test fishing trip of the freezer trawler "Kattegat" in the waters of the People's Republic of Mozambique from October 2 to December 12, 1977. Institute of Deep-Sea Fishery and Fish Processing, Rostock. German Democratic Republic, February 1977:
Anonymous, 1980 Les iles de l'Ocean Indian: Bilan et perspectives d'evolution des peches. Centre Francais du Commerce Exterieur; Les dossiers de la DPA. Serie "produits-pays" (Avril 1980): 93p.
Bertrand, J. 1985 La peche maritime a la Reunion: trente annees d'effort de developpement de la production. L'economie de la Reunion No. 15: 3-8.
Birkett, L., 1978 Western Indian Ocean Fishery Resources Survey. Report on the cruises of R/V PROFESSOR MESYATSEV, December 1975-June 1976/July 1977, Tech. Rep. Indian Ocean Programme, (21):97 p.
Brinca, L., Cristo M., and Silva C., 1983 Camarao de Profundidade-Relatio dos 1983 cruzeiros realizados con o N/I Ernst Haeckel. Revista de Investigacao Pesquira No. 5. Instituto de Investigacao Pesqueira, Maputo: 25-52.
Brinca, L., and Palha de Sousa, L., 1983 The biology and availability of the spiny lobster Palinurus delagoae off the coast of Mozambique. Revista de Investigacao Pesqueira No. 8. Instituto de Investigacao Pesqueira, Maputo : 25-52
Brinca, L., and Palha de Sousa, L., 1984 O recurso de camarao de aguas pouco profundas. Revista de Investigacao Pesqueira, No. 9. (1984) Instituto de Investigacao Pesqueira, Maputo : 45-62 (in Portuguese).
Brownell, W.N., Tanzania baseline study. Regional Project for the Developement and Management of Fisheries in the Southwest Indian Ocean, RAF/79/065/WP/03/82:33 p.
Brusher, H.A., 1974 The magnitude distribution and availability of prawn (Penaidae) resources in coastal and estuarine waters of Kenya 1970. J. Mar. Biol. Ass. India 16 (2):1-14.
Budnitchenko, V.A., V.A. Lednichenko, V.S Miroshnikov et al., 1977 Results obtained from the 'Aelita' exploratory surveys undertaken in the shelf and open waters continuous to the coast of the People's Republic of Mozambiqe (May 1976 through August 1977). Azcher NIRO, Kerch: 185 p.
Burczynski, J., 1977 Echo survey along the East African coast from Mombasa to Laurco. Marques by R.N Professor Mesyatsev in January/February 1976. FAO Fisheries Travel Report and aide memoire, (1162) Suppl. 1:28 p.
Bwathondi, P.O.J., 1973 The biology and fishery potential of palinurid lobsters in Tanzania. M.Sc. Thesis University of Dar-es-Salaam. 139 p.
---------, 1980 The spiny lobster fishery in Tanzania. Proc. Symp. on the Coastal and Marine Environment of the Red Sea, Gulf of Aden and Tropical Western Indian Ocean. Khartoum 9-14 Jan. 1980. Vol. II:281-292 p.
Bwathondi, P.O.J. and G. Mwaya, 1984 The fishery of crustacea and molluscs in Tanzania. The proceedings of the Norad-Tanzania Seminar to review the marine fish stocks and fisheries in Tanzania (Mbegani, Tanzania, 6-8 March 1984). Tanzania Fisheries Research Institute, Dar-es-Salaam, Norwegian Agency for International Development Bergen:19-28.
Duhamel, G., 1980 Evolution de la pecherie de langoustes (Jasus paulensis) aux iles Saint-Paul et Amsterdam La Peche Maritime, (1224):159-166.
Elmer, S., 1985 A report prepared for the technical support of the Ministry of Fisheries Project FAO/UNDP, FI:UTF/SOM/028/SOM. Field Document 2:14 p.
FAO/UNDP, 1971 Report to the government of Kenya on the Evaluation of Prawn (Penaeidae) and Spiny Lobster (Palinuridae) Marine Resources.Based on the work of H. Brusher, Marine Fishery Biologist.Rep. FAO/UNDP (TA), (3006):40 p.
--------, 1982 The stock assessment of the Kenyan demersal offshore resources surveyed in the period 1979-1980-1981. Work Report No.8 of the 'Offshore trawling survey' project KEN/74/023, 58 P. (mimeo).
--------, 1983 Mauritius Fisheries baseline study. Regional Project for the Development and Management of Fisheries in the Southwest Indian Ocean, RAF/79/065/WP/11/83:30 p.
FAO/IOP, 1979 Report of the workshop on the fishery resources of the Western Indian Ocean South of the Equator. Mahe, Seychelles, 23 October 4 November 1978. Dev. Rep. Indian Ocean Programme, (45):102 p.
Hall, D.N.F., 1960 A note on the Zanzibar rock-lobster fishery, Ann. Rep.EAMFRO: 32-38.
Johnsen, T., 1984 Somalia lobster trawl survey; Regional Project for the Development and Management of Fisheries in the Southwest Indian Ocean, RAF/79/065/WP/15/84:44 p.
Kanagawa Prefectural Government, 1969 The report of survey on the prawn fishing grounds along the coast of Tanzania, Japan:120 p.
Marcille, J., 1978 Dynamique des populations de crevettes peneides exploitees a Madagascar. Travaux et documents de l'ORSTOM No. 92:197 p (in French).
Mutagyera, W.B., 1978 Some observations on the Kenya Lobster Fishery E. Afric. Agric. For. J. 43(4):401-407
--------, 1984 Distribution of some deep-water prawn and lobster species in Kenya's waters. The proceedings of the Norad-Kenya seminar to review the marine fish stocks and fisheries in Kenya (Mombasa Kenya 13-15 March. 1984):21:26
Pecker, D., 1982 Present situation and background to fisheries statistics in Somalia. Statistical paper I. FAO/UNDP UTF/SOM/028/SOM :12 p. (plus appendices).
Ralison, A., 1978 Caracteristiques et tendances de l'exploitation crevettiere malgache de 1967 a 1977. Centre National de Recherche Oceanographiques (Nosy-be): Document n/78/1: 38 p. (in french)
Rey, J.C., 1982 The marine fisheries of Madagascar, Regional Project for the Development and Management of Fisheries in the Southwest Indian Ocean, RAF/79/065/WP?/82: 48p (plus figures and tables).
Saetre, R., 1984 Revisao dos conhecimentos sobre os recursos pesqueiros marinhos.Revista de Investigacao Pesqueira, No. 7. Instituto de Investigacao Pesqueira, Maputo:113-140 (in Portuguese)
Saetre, R. and R. de Paula e Silva, 1979 The main fish resources of Mozambique. Reports on surveys with the R/V 'Dr Fridtjof Nansen'. Servico de Investigacoes Pesqueiras, Maputo, Institute of Marine Research, Bergen:179 p.
Ulltang O., L. Brinca and C. Silva, 1980 A preliminary assessment of the shallow-water prawn stocks off Mozambique, North of Beira. Revista de Investigacao Pesqueira, No. 1. Servico Investigacoes Pesqueiras, Maputo:69 p.
Ulltang, O., L. Brinca and L. Sousa, 1985 State of the stocks of shallow-water prawns at Sofala Bank. Revista de Investigacao Pesqueira, No. 13. Servico de Investigacoes Pesqueiras, Maputo: 97-126.
Venema, S.C., 1984 Resource surveys other than those by Dr. Fridtjof Nansen. The proceedings of the Norad-Tanzania Seminar to review the marine fish stocks and fisheries in Tanzania (Mbegani, Tanzania, 6-8 March 1984). Tanzania Fisheries Research Institute, Dar-es-Salaam, Norwegian Agency for International Development, Bergen:85-96.
VNIRO, 1978 Western Indian Ocean Fisheries Resources Survey FAO/UNDP/USSR Cooperative Project Dev. Rep. Indian Ocean Programme, (46):130 p. (limited distribution)
White Fish Authority, 1979 Democratic Republic of Somalia. Fishing sector Planning Study Interim Report. Report No. MD 397:273 p.
Aug-Sept |
Nov-Dec |
Jan-Feb |
Jan-Feb |
|
|---|---|---|---|---|
1980 |
1980 |
1981 |
1982 |
|
| No. of stations | 157 |
209 |
261 |
190 |
| Catch/Effort (kg/h) : | ||||
| - mean | 23.65 |
18.66 |
23.87 |
22.61 |
| - variance of mean | 3.11 |
2.00 |
1.76 |
2.52 |
| Biomass (tons) : | ||||
| - mean | 3 003 |
2 369 |
3 031 |
2 871 |
| - 95% confidence limits | ± 439 |
± 352 |
± 330 |
± 395 |
Aug-Sept |
Nov-Dec |
Jan-Feb |
Jan-Feb |
|
|---|---|---|---|---|
1980 |
1980 |
1981 |
1982 |
|
| Biomass : | ||||
| - mean | 1 040 | 965 | 1 101 | 988 |
| - % of Biomass in | ||||
| total surveyed area | 35 |
41 |
36 |
34 |
| Aug-Sept | Nov-Dec | Jan-Feb | Jan Feb | |
| 1980 | 1980 | 1981 | 1982 | |
| H. triarthrus | 52.6 | 53.0 | 52.1 | 58.2 |
| A. foliacea | 18.9 | 16.4 | 16.3 | 5.6 |
| Aristeus spp. | 5.8 |
7.7 |
4.9 |
4.1 |
| Others | 22.7 | 22.9 | 26.7 | 32.1 |
| Bazaruto | Delagoa | Inhaca | |||||||
|---|---|---|---|---|---|---|---|---|---|
| Depth | Area | Biomass | (tons) | Area | Biomass | (tons) | Area | Biomass | (tons) |
| (km 2) | Summer | Winter | (km 2) | Summer | Winter | (km 2) | Summer | Winter | |
| 201-250 | 1,030 | 262 | 31 |
1,125 | 81 |
14 | |||
| 251-300 | 1,030 | 125 | 48 |
1,190 | 96 |
47 | 330 | 62 | 29 |
| 301-350 | 1,030 | 63 |
23 |
700 |
1 |
2 |
110 | 19 | 12 |
| 351-400 | 1,030 | 16 |
|||||||
| Total | 450 | 118 | 178 | 63 | 81 | 41 | |||
Year |
Effort |
Catch |
|---|---|---|
(Standard hours *) |
(tons) |
|
| 1967 | 11 360 |
775 |
| 1968 | 17 100 |
1 340 |
| 1969 | 16 710 |
1 635 |
| 1970 | 35 810 |
2 910 |
| 1971 | 78 640 |
4 080 |
| 1972 | 140 250 |
4 690 |
| 1973 | 144 420 |
4 800 |
| 1974 | 175 050 |
4 450 |
| 1975 | 126 850 |
4 630 |
| 1976 | 111 130 |
4 540 |
| 1977 | 106 690 |
5 125 |
| 1978 | 117 419 |
4 950 |
| 1979 | 115 668 |
4 330 |
| 1980 | 4 910 |
|
| 1981 ** | 5 075 |
|
| 1982 ** | 5 260 |
|
| 1983 ** | 5 503 |
|
| 1984 ** | 5 800 |
| Year | Shrimp | Lobster |
|---|---|---|
| (tons) | (tons) | |
1966 |
335.0 |
15.0 |
1967 |
- |
- |
1968 |
448.4 |
58.6 |
1969 |
555.6 |
41.4 |
1970 |
509.0 |
76.0 |
1971 |
364.3 |
26.7 |
1972 |
305.2 |
25.0 |
1973 |
307.0 |
- |
1974 |
101.0 |
79.0 |
1975 |
166.0 |
50.0 |
1976 |
272.9 |
- |
1977 |
238.0 |
- |
Depth |
Total |
No. of |
Prawns |
catch |
density |
Estimated |
|
|---|---|---|---|---|---|---|---|
Zones |
Area |
Trawls |
Caught |
per |
(kilos/ |
Total |
|
(fa) |
(sq.n.a.) |
[1] |
(kg) |
hour |
sq.n.a) |
Weight |
|
| January 1970 [2] | |||||||
| Ungwana Bay | 0-5 |
93 |
7 |
94 | 20.3 |
1 691.6 |
157 319 |
6-10 |
150 |
10 |
# | # |
1.3 |
171 |
|
| Sabaki/Mambrui | 6-10 |
6 |
1 |
0 | .. |
.. |
.. |
11-20 |
26 |
2 |
4.5 | 8.5 |
708.3 |
18 416 |
|
175 906 |
|||||||
| February 1970 [3] | |||||||
| Ungwana Bay | 0-5 |
93 |
12 |
84 | 13.8 |
920.0 |
85 560 |
6-10 |
150 |
9 |
7.5 | 1.8 |
120.0 |
18 000 |
|
| Sabaki/Mambrui | 6-10 |
6 |
1 |
5 | 9.5 |
633.3 |
3 831 |
11-20 |
26 |
3 |
11.5 | 11.5 |
766.7 |
19 934 |
|
127 325 |
|||||||
| March 1970 [3] | |||||||
| Ungwana Bay | 0-5 |
93 |
5 |
40 | 16.1 |
1 073.3 |
99 817 |
6-10 |
150 |
2 |
# | # |
20.0 |
3 000 |
|
| Sabaki/Mambrui | 6-10 |
6 |
2 |
15.5 | 15.5 |
1 033.3 |
6 210 |
11-20 |
26 |
1 |
# | # |
20.0 |
3 000 |
|
112 027 |
|||||||
| June 1970 | |||||||
| Ungwana Bay | 0-5 |
93 |
5 |
15 | 7.5 |
277.8 |
25 835 |
6-10 |
150 |
2 |
10.5 | 10.5 |
388.9 |
58 335 |
|
| Sabaki/Mambrui | 6-10 |
6 |
0 |
.. | .. |
.. |
.. |
11-20 |
26 |
2 |
108.5 | 108.5 |
4 018.5 |
104 481 |
|
188 651 |
|||||||
| July 1970 [2] | |||||||
| Ungwana Bay | 0-5 |
93 |
1 |
1.5 | 3.0 |
250.0 |
23 250 |
6-10 |
150 |
3 |
6 | 4.2 |
350.0 |
52 500 |
|
| Sabaki/Mambrui | 6-10 |
6 |
.. |
.. | .. |
.. |
.. |
11-20 |
26 |
1 |
51.5 | 128.1 |
10 675.0 |
277 550 |
|
353 300 |
|||||||
| October 1970 [3] | |||||||
| Ungwana Bay | 0-5 |
93 |
0 |
.. | .. |
.. |
.. |
6-10 |
150 |
0 |
.. | .. |
.. |
.. |
|
| Sabaki/Mambrui | 6-10 |
6 |
1 |
17.3 | 26.0 |
7 333.3 |
44 000 |
11-20 |
26 |
34 |
964.6 | 48.9 |
3 260.0 |
84 760 |
|
128 760 |
Fishery environment |
Total area available |
Annual estimated |
|---|---|---|
in nautical miles (**) |
biomass (kg) (***) |
|
| Creek : | ||
| - Mombasa | 78.5 |
43 000 |
| - Mtwapa | ||
| - Owyombo | ||
| - Kilifi | ||
| - Lamu | ||
| Reef : | ||
| - Shoreline | 171.6 |
94 000 |
| - Offshore islands | 119.4 |
66 000 |
| Coastline: | ||
| - (Shoreline areas not | 123.1 |
68 000 |
Influenced by fringing reef) |
||
| Total estimated stock | 271 000 | |
| Actual Kenya Production ('67-68) | 48 595 |
Area used |
Depth |
Area |
Biomass in area | ||
|---|---|---|---|---|---|
| Area no. | for |
Interval |
size |
P. carinatus |
P. sewellii |
predictions |
|||||
1 |
20 |
255-285 |
140 |
20 |
0 |
3 |
20 |
250-320 |
220 |
106 |
0 |
4 |
20 |
240-300 |
25 |
96 |
0 |
8 |
8 |
240-400 |
83 |
161 |
97 |
11 |
11 |
240-400 |
445 |
180 |
414 |
14 |
14 |
300-390 |
45 |
0 |
109 |
16 |
14 |
280-400 |
130 |
0 |
316 |
19 |
14 |
270-390 |
65 |
0 |
158 |
20 |
20 |
240-400 |
181 |
75 |
0 |
| Total standing stocks within trawl areas: | |||||
| Puerulus carinatus | 639 tons |
||||
| Puerulus sewellii | 1 094 tons |
||||
Years |
Landings (ton) | ||||
|---|---|---|---|---|---|
| frozen fish | lobster | fishmeal | |||
| (tail wt.) | (whole wt.) | ||||
| 1973 | 280* |
116* |
|||
| 1974 | 495* |
1 350** |
134* |
680** |
|
| 1975 | 1 175* |
1 500** |
383* |
950** |
|
| 1976 | 3 343* |
3 400** |
538* |
950** |
343* |
| 1977 | 3 400** |
1 150** |
? |
||
| 1978 | 235** |
20** |
? |
||
| 1979 | 3 080** |
(800)** |
? |
||
| 1980 | 8 530** |
(1 800)** |
? |
||

Figure 1 Country locations in South West Indian Ocean
Figure 2 Distribution of shallow water shrimps adjacent to the Sofala Bank; from Brinca and Palha de Sousa (1984)
Figure 3 Distribution of deep-water shrimp adjacent to Mozambique; from Brinca et al. (1983)
Figure 4 Distribution of deep-water lobster adjacent to Mozambique; from Brinca and Palha de Sousa (1983)
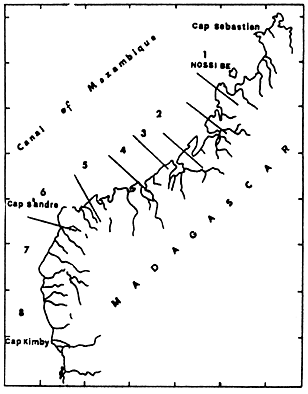
Figure 5 The management zones for shrimp in Madagascar; from Ralison (1978)
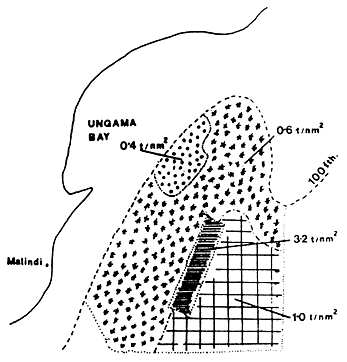
Figure 6 Densities of deep-water shrimp, from FAO/UNDP (1982)
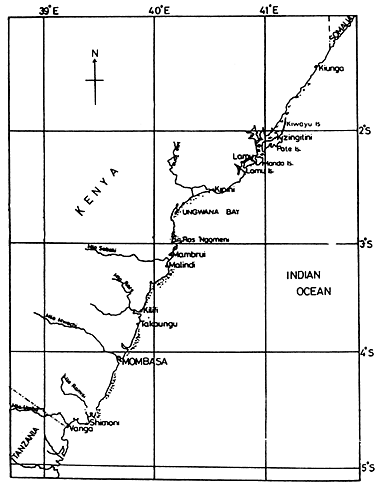
Figure 7 Locations for capture of shallow-water lobster; from Mutagyera (1978)
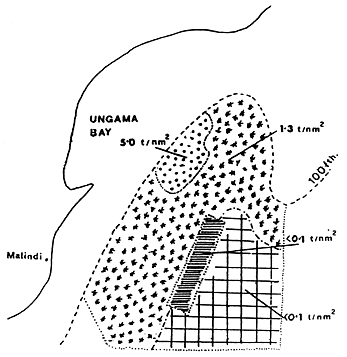
Figure 8 Densities of deep-water lobster, from FAO/UNDP (1982)
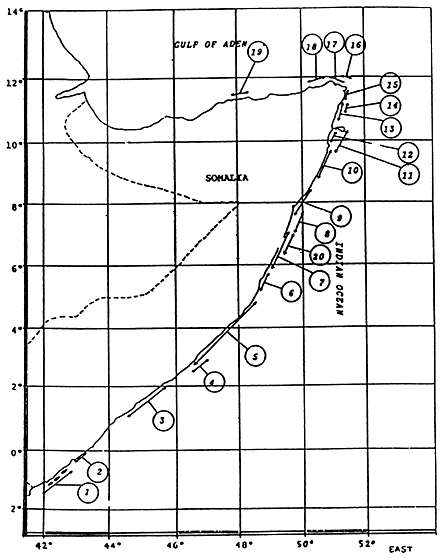
FIGURE 9: LOCATIONS OF TRAWLING GROUNDS FOR DEEP-WATER LOBSTER ADJACENT TO SOMALIA: FROM JOHNSEN (1984)
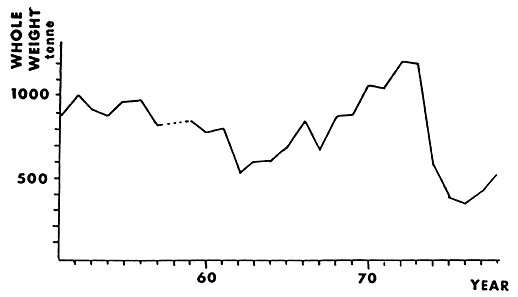
FIGURE 10: QUANTITY OF LOBSTER (JASUS PAULENSIS) LANDED FROM ST. PAUL AND NEW AMSTERDAM ISLANDS: FROM DUHAMEL (1980)
by
A. Ralison
(NATIONAL OCEANOGRAPHIC RESEARCH CENTRE; MADAGASCAR)
Marcille (1978) and Ralison (1978) studied the Maximum Sustainable Yield (MSY) of Penaeid shrimp populations of the North West Coast, but those of the West Coast, which have been exploited since the mid 1970s, are still not well-known. Despite this, exploitation of these populations has recently intensified.
This report is preliminary to a scientific study in preparation on the stocks of that region and their exploitation. This report includes basic data on such stocks and their fishery.
The period of study extends from 1974 to 1983 (10 years), but the first three years are not included since the shrimp fishery, South of Cape St. Andre, was negligible between 1971 and 1973.
During this period 49 trawlers exploited the area (Annex I). Some of these trawlers operated frequently or,like the "Anahidrano" which is a trawler of 42M of LOA and 1250 Hp and was not allowed to fish on the North West coast by the maritime administration, even permanently. Others were rarely present in this zone as the exploitation of this area was not easy, lacking shelter and being far from harbours and exposed to the trade winds (the "SOAVINA" or the "Nosy MITSIO" or the "Nosy SAKATIA).
Most of the vessels fishing in this zone are florida-rigged double beam freezer trawlers, spending more than 15 days on the fishing grounds.
Production Models require a standardisation of fishing effort of the different vessels. In order to obtain a reference vessel for the measure of unit-effort, the fleet was homogenised by division into smaller groups characterised by their respective horse powers. Six (6) such groups or categories of vessels were established (Table 1).
Type A trawlers, because of their small size, their reduced autonomy and their advanced age, made very few trips at the start of the fishery to the Western Coast.
Type B trawlers, owned by SOMAPECHE were present during longer periods on the West Coast, but only in the Northern areas of the zone under study. (Maintirano ...).
Type C trawlers predominated on the West Coast from 1974 to 1983. It would have been appropriate to choose these as reference vessels for calculating the fishing effort (particularly since they were present right from the beginning of the fishery), except that the fishing data of only 6 vessels out of 21 were available. This group was thus subdivided into :
C1 - trawlers without data on effort
C2 - trawlers with data on effort.
Type D trawlers were of little interest as they were either vessels which had disappeared from these fishing zones or vessels which have started to operate in this zone only at the end of the period of study.
Type E trawlers, constantly present in these zones, have the required characteristics to serve as a unit of reference for the whole period of study and for fishing zones of the West Coast. Moreover all the new trawlers which will join this fishery belong to this category of vessels.
Category F is represented by only one trawler: the ANAHIDRANO has 1250 horsepower and a length of 42m. This trawler would have been an excellent unit of reference since it operated constantly on the West Coast from 1974 to 1983. But unfortunately, since it was the only vessel in this category, it could not be used as such.
In view of the above, the Type E trawler was finally chosen as reference unit; it is a deep-freezer ship of 500 Hp, measuring 28-29 m and with a tonnage of 127-238T. It should be mentioned that Marcille (1978) used as reference unit the Northern-coast shrimp trawlers of 160-170 Hp measuring 15-18 m.
As on the North West Coast, fishing is carried out in muddy or sandy-muddy regions of the continental shelf with depths of less than 40 m.
A Marsden square of 10 miles side was proposed by the Maritime Administration for the survey of the fishing zones. It was observed that the priciple of utilizing these quadrants was accepted by the enterprises, and because it safeguards the skipper's confidentiality concerning specific trawling zones. The coding of the information required by the Maritime Administration was not so readily accepted, each company having adopted its own logbook system. It therefore became necessary to introduce a transcription system at the laboratory.
The 10 mile square quadrants are grouped into larger fishing zones which, on the West Coast, were composed of the three following entities:-
A first analysis of the distribution in space and time of the abundance of prawns from statistical data collected from 1974-1978, using Marcille's unit of effort, resulted in the following new division of the zone:
According to fisheries regulations, each shrimp trawler operating in Malagasy waters has to fill in forms in which the following information on catch are included:
Each company has established its own reporting forms and although some companies provide detailed information on their activities (nature of bottom, depth, climatic conditions, temperature of surface water ...) others are less cooperative and do not even transmit the minimum information required.
Analysis, transformation and transcription of the data furnished by different companies to standardised forms of the CNRO is necessary so as to permit proper interpretation of the data concerning the fishery as a whole.
Annex II gives the catches/month/zones in tonnes of whole shrimp, and Annex III shows detils of the corresponding standardised efforts.
The same species as those of the North West coast are caught South of Cape St. Andre:
| - | Penaeus indicus or 'white' | ||||||
| - | Metapenaeus monoceros or 'pink' or 'calendre; | ) | |||||
| - | Penaeus semisulcatus | ) or 'flower' | ) | ) | |||
| - | Penaeus japonicus | ) | ) or Tiger | ) Brown | |||
| - | Penaeus monodon or camaron | ) | ) | ||||
Monthly percentages of the weights of the various species were obtained from some "SOMAPECHE" trawlers which classify their catch into "white", "brown", "camaron" and "tiger" shrimps. On the assumption that the fishing was not directed at particular species and that none of the shrimp were rejected it was found that (fig. 2):
In fact, we find the same proportionalities among species on the North-West coast (Marcille 1978; Ralison, 1978).
Various methods for determination of the standard fishing effort are available, including that of ROBSON (1966) or of FONTENEAU and BOUILLON (1971) which needs computerised equipment not available to the institute. In the present context, a non-computerized method was used to determine the standard fishing effort, taking into consideration a standard vessel unit which was present for the longest period of time during the observation period (see Section I).
The data available, obtained after analysing the vessel log sheets, are values of catch in tonnes of whole shrimps - trawling hours/month/zone/vessel, except for some of the vessels for which there are only the landings per month/zone/vessel.
The gross hourly production for each category of vessels was calculated for each unit in space and time, that is for each month/zone over 10 years. Production figures corresponding to a nominal effort of less than 25h/month/zone per group of vessels were not used in the algorithms consisting of:
This equation is expressed as:
y = 0.00085 x + 0.578;
r = 0.980
The conversion coefficients of the nominal fishing effort into standard effort are given in Table 2. For fishing vesels where only monthly catch (in tonnes) is available (Type "C"), the standard effort for that group in space and time is obtained by dividing the monthly catch in each zone by the average catch/unit effort of the reference vessel Type "E". This mean yield is 70.72 kg/hour for all the zones for the period 1973-84.
The analysis in Annex III giving details of standard effort per month and per zone from 1974-1984 shows that the fishing effort on the West coast varies enormously, not only between zones but also from year to year. If the West coast is considered as a whole, 3 periods can be identified:
Table 3 below shows the global evolution of the distribution of effort by zones for 10 years of exploitation: trawlers which exploited Zone VII practically exclusively in 1974 have now moved to more Southern zones.
The application of Fox's Model for each fishing zone does not give any result except in Zone X, for which calculations are made only for the period 1977-1983.
In this case, the equation of yield in relation to effort is:
Log R = -109.10 -7.H + 2,07776;
r = 0,42.
The Maximum Sustainable Yield (MSY) would be 1.755 T with an optimal effort of 40,000 hours and an optimal yield per hour of 43,8 kg. The low value of 'r' shows that a high level of confidence cannot be placed in the results.
It is possible that the data were not recorded properly by fishing zone by the trawlers operating in this region during their operations in Zones VII, VIII and IX. Under these conditions, it is necessary to consider the West coast as a whole and it is found that the data from 1974 to 1979, on the one hand, and those from 1981 to 1983 provide two distinct coherent estimates.
Two hypotheses can be formulated to explain the evolution of the yields since the turning year of 1980:
Concerning the second hypothesis, it should be noted that FREON (1984) had demonstrated the existence of very important fluctuations in the stocks of Sardinella spp. off Senegal following hydrological modifications.
Figure 3 represents graphically the curves of catch per unit effort against catch calculated from data for the periods 1974-1979 and 1981-1983, which have high coefficients of correlation. The MSY are of the order of 1,277t (1974-1979) and of 3,750t (1981-1983) with optimal respective efforts of 50,000 hours and 110,000 hours.
Values obtained vary in the proportion of 1 to 2 and it appears judicious at this stage, while awaiting the integration of more data into the mathematical models, to take intermediate values of MSY of about 2500t for an effort of around 80,000 hours.
The objective of the present study on marine shrimps of the West coast is to make available to the Maritime Administration of Madagscar the information required for the management of the Penaeid stocks of this region. The values of MSY are required by the Administration so as to form the basis for deciding whether or not to allow this fishery, where effort has more or less stabilised over recent years, to expand.
In 1983, the total effort was almost 25,000 hours. Assuming the hypothesis of an optimal effort of 80,000 standardized hours, it should be possible to introduce more vesels and to multiply the effort allowed in 1983 by 3.
It is, however, recommended that any increase in effort be carried out with care since the optimal effort mentioned above is only hypothetical and should be corroborated with more data and analysis. On the other hand, studies of the North West coast have shown that the economic over-exploitation has been attained well before biological over-exploitation, and that management at MSY would not be a judicious policy objective.
- ANDRUANBAGATRA (J.P.C.), 1985 - L'exploitation des crevettes dans les eaux malgaches.
Mémoire de fin d'étude, Etablissement Enseign. Sup. Sci. Agronomiques.
- FONTENEAU (A.) et BOUILLON (P.), 1971 - Analyse des rendements des chalutiers ivoiriens. Définition d'un effort de pêche.
Doc. Sci. Centre Rech. Oceanogr. Abidjan, 2 (1-2) : 1-10
- FOX (W.W.), 1970 - An exponential surplus yield model for optimizing exploited fish populations.
Trans. Amer. Fish. Soc., 95(1) : 80-88.
- FREON (P.), 1984 - Des modèles de production appliqués à des fractions de stocks dépendantes des vents 'upwelling (pêche sardinière au Sénégal).
Océanogr. trop., 19 (1).
- LE RESTE (L.), 1978 - Biologie d'une population de crevette Penaeus indicus H. Milne Edwards, sur la côte nord-ouest de Madagascar.
Trav. Doc. ORSTOM, (92).
- MARCILLE (J.), 1978 - Dynamique des populations de crevettes pénéides exploitées à Madagascar.
Trav. Doc. ORSTOM, (92).
- RALISON (A.), 1978 - Caractéristiques et tendances de l'exploitation crevettière malgache de 1967 a 1977.
Doc. Sci. Centre Nat. Rech. Oceanogrl, No. 78/1.
- ROBSON (D.S.), 1966 - Estimation of the relative fishing power of individuals ships.
ICNAF Res. Bull., (3) : 5-14.
(1) |
(1) |
|||||
| Category | (A) (1) | B (1) | C | D | E | F |
| Horse Power (Hp) | 170 | 260-270 | 300-399 | 400-499 | 500 | 1.250 |
| Total length (M) | 19 | 17-19 | 22-25 | 24-48 | 26-29 | 42 |
| Tonnage (T) | 46 | 58-70 | 114-165 | 121-392 | 127-238 | 314 |
| Number (N) | 3 | 9 | 21 | 5 | 10 | 2 |
| Type of fishing | Horse power | Observed | Calculated |
|---|---|---|---|
| vessel | Hp | Coefficients | Coefficients |
| A | 170 | ... | 0,72 |
| B | 260-270 | 0,72 | 0,80 |
| C | 300-399 | 0,97 | 0,87 |
| D-2 | 400-499 | ... | 0,96 |
| E | 500 | 1,00 | 1,00 |
| F | 1.250 | 1,63 | 1,64 |
Year |
1974 |
1983 |
|---|---|---|
| Zone | ||
| VII | 94,6 |
23,2 |
| VIII | 2,0 |
18,7 |
| IX | 2,6 |
25,7 |
| X | 0,8 |
32,3 |
| Effort | 10.545 |
24.843 |
| total |
| Period | ||
|---|---|---|
-8 |
||
| 74-79 | Log R = -855.10 | .H + 1,83489 |
| r = 0,95 | ||
-8 |
||
| 74-80 | Log R = -472.10 | .H + 1,80957 |
| r = 0,56 | ||
| 80-83 | illegal | |
-8 |
||
| 81-83 | Log R = -405.10 | .H + 1,97814 |
| r = 0,97 | ||
List of Shrimp trawlers having operated on the West Coast from 1974 to 1983
| SOMAPECHE | : Societe Malgache de Pecherie (Mahajanga) |
| FAMAKO/SOPEBO | : Fanjonoana Malagasy-Koweitianina/ Societe des Pecheries du Boina (Mahajanga) |
| P.N.B. | : Societe des Pecheries de Nosy-Be (Nosy-Be) |
| SIPMAD | : Societe Industrielle et de Peche a Madagascar (Port St Louis) |
| REFRIGEPECHE | : Societe de Peche et Froid (Toamasina) |
G = Ice-plants
I = Methods of fishing other than the floridian double pole technique
| NAME | CHARACTERISTICS | REMARKS | |||||||||||||||
|---|---|---|---|---|---|---|---|---|---|---|---|---|---|---|---|---|---|
| CODE | TL | HP | T | TYPE | |||||||||||||
| (*) | |||||||||||||||||
| SOMAPECHE | |||||||||||||||||
| - Anahidrano | ANH | 42 | 1,250 |
314 |
F | ||||||||||||
| - Mandrare | MAN | 19 | 170 |
46 |
A | G | |||||||||||
| - Nosy Mangabe | NGB | 19 | 170 |
46 |
A | G | |||||||||||
| - Nosy Faly | NDF | 19 | 170 |
46 |
A | G | |||||||||||
| - Vezo | 1 | VZ1 | 19 | 270 |
70 |
B | G | ||||||||||
| - | " | 2 | VZ2 | 19 | 270 |
70 |
B | G | |||||||||
| - | " | 3 | VZ3 | 19 | 270 |
96 |
B | G | |||||||||
| - | " | 4 | VZ4 | 19 | 270 |
70 |
B | G | |||||||||
| - Boina | 1 | BN1 | 23 | 270 |
96 |
B | G | ||||||||||
| - | " | 2 | BN2 | 23 | 270 |
96 |
B | G | |||||||||
| - | " | 3 | BN3 | 23 | 270 |
96 |
B | G | |||||||||
| - Menabe | 1 | MB1 | 29 | 500 |
152 |
E | |||||||||||
| - | " | 2 | MB2 | 29 | 500 |
152 |
E | ||||||||||
| - | " | 3 | MB3 | 29 | 500 |
238 |
E | ||||||||||
| - | " | 4 | MB4 | 29 | 500 |
238 |
E | ||||||||||
| - | " | 5 | MB5 | 29 | 500 |
238 |
E | ||||||||||
| - Orion | 6 | DR6 | 29 | 500 |
152 |
E | |||||||||||
| - | " | 7 | DR7 | 29 | 500 |
152 |
E | ||||||||||
| FAMAKO/ SOPEBO | |||||||||||||||||
| - Patsabe | 4 | PB4 | 25 | 395 |
131 |
C | |||||||||||
| - | " | 5 | PB5 | 25 | 395 |
131 |
C | ||||||||||
| - | " | 6 | PB6 | 25 | 395 |
131 |
C | ||||||||||
| - | " | 7 | PB7 | 25 | 395 |
131 |
C | ||||||||||
| - | " | 8 | PB8 | 25 | 395 |
131 |
C | ||||||||||
| - Patsalena | 1 | PL1 | 25 | 395 |
165 |
C | |||||||||||
| - | " | 2 | PL2 | 25 | 395 |
165 |
C | ||||||||||
| - | " | 3 | PL3 | 25 | 395 |
165 |
C | ||||||||||
| - | " | 4 | PL4 | 25 | 395 |
165 |
C | ||||||||||
| - | " | 5 | PL5 | 25 | 395 |
165 |
C | ||||||||||
| - | " | 6 | PL6 | 25 | 395 |
165 |
C | ||||||||||
| - | " | 7 | PL7 | 25 | 395 |
165 |
C | ||||||||||
| - | " | 8 | PL8 | 25 | 395 |
165 |
C | ||||||||||
| P.N.B. | |||||||||||||||||
| - Nosy Mitsio | NOM | 17 | 260 |
58 |
B | G | |||||||||||
| - Nosy Sakatia | NOK | 17 | 260 |
58 |
B | G | |||||||||||
| - Nossibe | 1 | NB1 | 25 | 370 |
131 |
C | |||||||||||
| - | " | 2 | NB2 | 25 | 370 |
131 |
C | ||||||||||
| - | " | 3 | NB3 | 25 | 370 |
131 |
C | ||||||||||
| - | " | 4 | NB4 | 25 | 370 |
131 |
C | ||||||||||
| - Intersea | 21 | I21 | 22 | 300 |
126 |
C | G Sunk April 1981 | ||||||||||
| - | " | 22 | I22 | 22 | 300 |
126 |
C | G | |||||||||
| - Thaveechai | 5 | TC5 | 26 | 399 |
123 |
C | X) Statistics | ||||||||||
| - Ror Thaveechai | RTC | 25 | 399 |
114 |
C | X) not available | |||||||||||
| - Khantichai | 1 |
KTC | 27 | 500 |
156 |
E | X) Mas in Madagascar | ||||||||||
| - Vayubutra | 31 |
VBT | 29 | 500 |
138 |
E | X) in 1982-83 | ||||||||||
| SIPMAD | |||||||||||||||||
| - Soavina | 5 |
SV5 | 24 | 410 |
121 |
D | |||||||||||
| - | " | 7 |
SV7 | 24 | 410 |
121 |
D | ||||||||||
| - | " | 8 |
SV8 | 24 | 410 |
121 |
D | ||||||||||
| - | " | 10 |
S10 | 24 | 410 |
121 |
D | ||||||||||
| REFRIGEPECHE | |||||||||||||||||
| - Mascareignes-II | MAS | 48 | 450 |
392 |
D | ||||||||||||
| - Afrostar-II | AFR | 26 | 500 |
127 |
E | ||||||||||||
Catches per zone in tonnes of whole shrimps
month |
J | F | M | A | M | J | J | A | S | O | N | D | TOTAL |
|---|---|---|---|---|---|---|---|---|---|---|---|---|---|
| year | |||||||||||||
| Zone VII | |||||||||||||
| 1974 | 66,5 |
32,2 |
- | 20,5 |
101,1 |
103,4 |
58,7 |
67,7 |
47,2 |
13,2 |
18,3 |
31,7 |
560,5 |
| 1975 | 91,3 |
63,4 |
1,0 |
53,6 |
18,0 |
16,7 |
36,2 |
53,3 |
58,5 |
31,9 |
32,7 |
51,7 |
508,3 |
| 1976 | 64,0 |
17,6 |
1,0 |
17,7 |
24,5 |
50,2 |
58,2 |
72,3 |
46,6 |
61,1 |
49,0 |
52,6 |
514,8 |
| 1977 | 45,4 |
5,1 |
- | 20,7 |
19,4 |
9,9 |
6,8 |
10,5 |
2,1 |
5,2 |
2,6 |
13,1 |
140,8 |
| 1978 | 31,8 |
7,1 |
3,6 |
2,1 |
0,9 |
17,2 |
7,9 |
20,3 |
12,1 |
0,6 |
25,7 |
50,8 |
180,1 |
| 1979 | 52,3 |
12,1 |
10,2 |
9,7 |
0,5 |
11,3 |
52,6 |
25,2 |
6,8 |
3,5 |
14,8 |
64,5 |
263,5 |
| 1980 | 12,6 |
8,7 |
21,4 |
13,1 |
21,2 |
12,9 |
31,0 |
28,4 |
22,8 |
31,6 |
38,9 |
34,3 |
276,9 |
| 1981 | 97,2 |
17,8 |
12,8 |
8,6 |
16,4 |
27,9 |
22,9 |
6,5 |
16,2 |
1,4 |
28,9 |
48,5 |
305,1 |
| 1982 | 15,4 |
41,1 |
22,8 |
2,2 |
5,4 |
23,0 |
29,2 |
53,6 |
41,0 |
10,2 |
37,9 |
40,9 |
322,7 |
| 1983 | 36,8 |
96,4 |
27,4 |
30,9 |
35,2 |
76,7 |
34,7 |
31,5 |
39,5 |
16,5 |
20,1 |
12,0 |
457,7 |
| Zone VIII | |||||||||||||
| 1974 | - | - | - | - | - | - | 3,4 |
- | 2,5 |
- | - | - | 5,9 |
| 1975 | 10,2 |
1,2 |
- | 2,0 |
0,9 |
1,2 |
0,8 |
- | - | - | 3,1 |
2,1 |
21,5 |
| 1976 | 2,1 |
- | 2,7 |
1,3 |
3,1 |
- | - | 0,2 |
- | - | 1,2 |
- | 10,6 |
| 1977 | 15,5 |
14,6 |
- | 2,0 |
- | - | - | 0,3 |
0,3 |
- | 0,6 |
- | 33,3 |
| 1978 | - | - | - | 1,1 |
- | - | 2,3 |
2,0 |
- | - | 0,5 |
0,1 |
6,0 |
| 1979 | - | - | - | - | - | 4,2 |
0,1 |
0,9 |
3,4 |
- | - | - | 8,6 |
| 1980 | - | - | - | - | - | - | - | 2,9 |
- | - | 1,3 |
1,1 |
5,3 |
| 1981 | 4,2 |
9,3 |
5,9 |
11,1 |
4,1 |
7,6 |
2,6 |
2,9 |
1,3 |
0,5 |
3,4 |
8,3 |
61,2 |
| 1982 | 15,3 |
17,7 |
22,2 |
2,2 |
0,7 |
- | - | 0,4 |
- | 0,3 |
1,2 |
4,4 |
64,4 |
| 1983 | 2,9 |
1,6 |
1,3 |
6,8 |
1,5 |
33,1 |
22,9 |
21,3 |
38,5 |
24,4 |
31,3 |
20,6 |
206,2 |
| Zone IX | |||||||||||||
| 1974 | - | - | - | - | - | - | - | - | - | 10,5 |
- | - | 10,5 |
| 1975 | 9,4 |
- | - | 12,0 |
18,7 |
14,2 |
1,5 |
- | 0,8 |
- | - | - | 56,6 |
| 1976 | - | - | 7,7 |
6,4 |
31,4 |
0,3 |
- | 2,7 |
- | - | 1,3 |
0,6 |
50,4 |
| 1977 | - | 3,5 |
- | 6,3 |
0,5 |
- | 16,5 |
4,2 |
1,7 |
0,7 |
- | - | 33,4 |
| 1978 | 7,1 |
1,3 |
- | 5,4 |
2,6 |
8,4 |
1,0 |
7,7 |
0,0 |
- | 0,9 |
0,6 |
35,0 |
| 1979 | - | - | 4,1 |
15,9 |
0,4 |
1,8 |
0,7 |
6,3 |
0,4 |
- | 1,3 |
1,1 |
32,0 |
| 1980 | 6,2 |
14,4 |
1,1 |
9,2 |
8,2 |
1,7 |
7,1 |
13,9 |
2,3 |
16,8 |
15,5 |
8,8 |
105,2 |
| 1981 | 0,7 |
3,2 |
0,8 |
7,1 |
16,3 |
50,7 |
21,7 |
4,5 |
3,7 |
4,0 |
15,3 |
5,1 |
13,1 |
| 1982 | 10,7 |
7,8 |
17,5 |
17,6 |
10,8 |
11,2 |
8,9 |
3,7 |
4,4 |
3,9 |
11,9 |
15,1 |
123,5 |
| 1983 | 12,8 |
14,3 |
31,3 |
7,1 |
6,8 |
34,1 |
59,7 |
43,4 |
33,9 |
66,2 |
29,4 |
4,8 |
343,8 |
| Zone X | |||||||||||||
| 1974 | - | - | - | - | - | 1,6 |
- | - | - | 1,4 |
- | - | 3,0 |
| 1975 | - | - | - | 10,7 |
41,2 |
5,3 |
5,5 |
- | - | - | - | - | 62,7 |
| 1976 | - | - | 6,3 |
8,5 |
0,5 |
- | - |
- | - | - | - | 11,9 |
27,2 |
| 1977 | - | - | - | 41,3 |
2,1 |
- | 2,9 |
3,5 |
1,0 |
0,3 |
- | - | 51,1 |
| 1978 | 41,7 |
29,6 |
- | 16,4 |
12,5 |
14,7 |
- | 2,7 |
4,8 |
- | 7,1 |
25,2 |
154,7 |
| 1979 | - | - | 25,7 |
52,0 |
37,0 |
- | - | 0,6 |
- | - | 3,1 |
- | 118,4 |
| 1980 | 78,9 |
33,3 |
28,4 |
52,2 |
25,8 |
25,2 |
12,0 |
18,7 |
19,9 |
7,9 |
41,2 |
70,0 |
413,5 |
| 1981 | 92,9 |
122,1 |
167,7 |
182,6 |
135,0 |
134,1 |
57,1 |
16,4 |
13,9 |
11,1 |
48,6 |
14,0 |
995,5 |
| 1982 | 37,3 |
43,1 |
145,1 |
221,8 |
199,7 |
81,1 |
34,3 |
24,0 |
- | 5,8 |
19,4 |
48,9 |
860,5 |
| 1983 | 65,8 |
51,2 |
218,9 |
191,6 |
143,1 |
66,3 |
62,8 |
22,2 |
17,7 |
13,9 |
8,4 |
- | 861,9 |
Catches in tonnes of whole shrimps (all zones of the West Coast)
month |
J | F | M | A | M | J | J | A | S | O | N | D | TOTAL |
|---|---|---|---|---|---|---|---|---|---|---|---|---|---|
| year | |||||||||||||
| 1974 | 66,5 |
32,2 |
- | 20,5 |
101,1 |
105,0 |
62,1 |
67,7 |
49,7 |
25,1 |
18,3 |
31,7 |
579,9 |
| 1975 | 110,9 |
64,6 |
1,0 |
78,3 |
78,8 |
37,4 |
44,0 |
53,3 |
59,3 |
31,9 |
35,8 |
53,8 |
649,1 |
| 1976 | 66,1 |
17,6 |
17,7 |
33,9 |
59,5 |
50,5 |
58,2 |
75,2 |
46,6 |
61,1 |
51,5 |
65,1 |
603,0 |
| 1977 | 60,9 |
23,2 |
- | 70,3 |
22,0 |
9,9 |
26,2 |
18,5 |
5,1 |
6,2 |
3,2 |
13,1 |
258,6 |
| 1978 | 80,6 |
38,0 |
3,6 |
25,0 |
16,0 |
40,3 |
11,2 |
32,7 |
16,9 |
0,6 |
34,2 |
76,7 |
375,8 |
| 1979 | 52,3 |
12,1 |
40,0 |
77,6 |
37,9 |
17,3 |
53,4 |
33,0 |
10,6 |
3,5 |
19,2 |
65,6 |
422,5 |
| 1980 | 97,7 |
56,4 |
50,9 |
74,5 |
55,2 |
39,8 |
50,1 |
63,9 |
45,0 |
56,3 |
96,9 |
114,2 |
800,9 |
| 1981 | 195,0 |
152,4 |
187,2 |
209,4 |
171,8 |
220,3 |
104,3 |
30,3 |
35,1 |
17,0 |
96,2 |
75,9 |
1.494,9 |
| 1982 | 78,7 |
109,7 |
207,6 |
243,8 |
216,6 |
115,3 |
72,4 |
81,7 |
45,4 |
20,2 |
70,4 |
109,3 |
1.371,1 |
| 1983 | 118,3 |
163,5 |
278,9 |
236,4 |
186,6 |
210,2 |
180,1 |
118,4 |
129,6 |
121,0 |
89,2 |
37,4 |
1.869,6 |
Total standardised effort
| Zone 7 | |||||||||||||
month |
J | F | M | A | M | J | J | A | S | O | N | D | TOTAL |
| year | |||||||||||||
| 1974 | 1.678 |
163 |
- | 271 |
1.454 |
1.516 |
968 |
1.319 |
1.195 |
369 |
300 |
449 |
9.982 |
| 1975 | 1.752 |
1.404 |
14 |
736 |
275 |
351 |
712 |
1.127 |
936 |
602 |
523 |
1.287 |
9.719 |
| 1976 | 1,402 |
225 |
19 |
263 |
354 |
782 |
748 |
1.346 |
854 |
1.526 |
1.064 |
1.438 |
10.021 |
| 1977 | 838 |
114 |
- | 229 |
209 |
182 |
166 |
248 |
91 |
236 |
85 |
261 |
2.659 |
| 1978 | 864 |
98 |
16 |
28 |
30 |
375 |
181 |
444 |
264 |
21 |
446 |
808 |
3.575 |
| 1979 | 660 |
173 |
93 |
87 |
13 |
257 |
1.140 |
612 |
153 |
95 |
568 |
1,594 |
5.445 |
| 1980 | 302 |
75 |
167 |
158 |
209 |
253 |
595 |
680 |
638 |
939 |
831 |
662 |
5.509 |
| 1981 | 1.048 |
271 |
196 |
58 |
262 |
444 |
458 |
173 |
358 |
71 |
665 |
1.079 |
5.086 |
| 1982 | 414 |
391 |
108 |
27 |
93 |
417 |
639 |
1.123 |
740 |
283 |
925 |
1.074 |
6.237 |
| 1983 | 689 |
456 |
101 |
122 |
174 |
432 |
556 |
657 |
927 |
567 |
677 |
413 |
5.771 |
| Zone 8 | |||||||||||||
month |
J | F | M | A | M | J | J | A | S | O | N | D | TOTAL |
| year | |||||||||||||
| 1974 | - | - | - | - | - | - | 114 |
- | 96 |
- | - | - | 210 |
| 1975 | 166 |
17 |
- | 44 |
26 |
30 |
15 |
- | - | - | 88 |
79 |
465 |
| 1976 | 47 |
- | 26 |
7 |
35 |
- | - | 11 |
- | - | 24 |
- | 150 |
| 1977 | 104 |
232 |
- | 25 |
- | - | - | 4 |
20 |
- | 27 |
- | 412 |
| 1978 | - | - | - | 14 |
- | - | 52 |
- | - | - | 16 |
10 |
92 |
| 1979 | - | - | - | - | - | 7 |
13 |
48 |
- | - | - | 130 |
|
| 1980 | - | - | - | - | - | - | - | 49 |
- | - | 42 |
29 |
120 |
| 1981 | 45 |
113 |
52 |
86 |
46 |
125 |
60 |
79 |
41 |
13 |
116 |
135 |
911 |
| 1982 | 276 |
148 |
104 |
20 |
7 |
- | - | 10 |
- | 26 |
36 |
116 |
743 |
| 1983 | 69 |
8 |
10 |
29 |
12 |
283 |
472 |
130 |
1.037 |
804 |
963 |
549 |
4.656 |
| Zone 9 | |||||||||||||
month |
J | F | M | A | M | J | J | A | S | O | N | D | TOTAL |
| year | |||||||||||||
| 1974 | - | - | - | - | - | - | - | - | - | 270 |
- | - | 270 |
| 1975 | 141 |
- | - | 128 |
349 |
222 |
40 |
- | 26 |
- | - | - | 906 |
| 1976 | - | - | 68 |
72 |
347 |
6 |
- | 65 |
- | - | 54 |
48 |
660 |
| 1977 | - | 43 |
- | 62 |
9 |
- | 399 |
110 |
64 |
25 |
- | - | 712 |
| 1978 | 165 |
21 |
- | 37 |
42 |
139 |
14 |
177 |
5 |
- | 31 |
25 |
656 |
| 1979 | - | - | 47 |
178 |
12 |
41 |
23 |
151 |
11 |
- | 80 |
11 |
554 |
| 1980 | 145 |
125 |
32 |
153 |
100 |
46 |
142 |
340 |
70 |
296 |
414 |
185 |
2.048 |
| 1981 | 20 |
33 |
7 |
59 |
201 |
697 |
392 |
127 |
74 |
106 |
329 |
113 |
2.158 |
| 1982 | 151 |
58 |
74 |
155 |
161 |
184 |
189 |
72 |
110 |
130 |
352 |
249 |
1.885 |
| 1983 | 190 |
58 |
107 |
37 |
31 |
320 |
1.183 |
861 |
873 |
1.908 |
795 |
123 |
6.386 |
| Zone 10 | |||||||||||||
month |
J | F | M | A | M | J | J | A | S | 0 | N | D | TOTAL |
| year | |||||||||||||
| 1974 | - | - | - | - | - | 23 |
- | - | - | 60 |
- | - | 83 |
| 1975 | - | - | - | 104 |
287 |
120 |
127 |
- | - | - | - | - | 638 |
| 1976 | - | - | 73 |
126 |
22 |
- | - | - | - | - | - | 215 |
436 |
| 1977 | - | - | - | 136 |
23 |
- | 94 |
75 |
44 |
14 |
- | - | 386 |
| 1978 | 518 |
344 |
- | 100 |
118 |
251 |
- | 58 |
97 |
- | 126 |
235 |
1.847 |
| 1979 | - | - | 132 |
331 |
202 |
- | - | 22 |
- | - | 80 |
- | 770 |
| 1980 | 856 |
240 |
177 |
442 |
272 |
292 |
240 |
418 |
366 |
164 |
806 |
1.034 |
5.307 |
| 1981 | 796 |
953 |
808 |
1.235 |
1.421 |
1.917 |
1.096 |
292 |
304 |
263 |
905 |
364 |
10.354 |
| 1982 | 613 |
409 |
1.004 |
1.006 |
1.138 |
1.104 |
594 |
507 |
- | 220 |
560 |
915 |
8.070 |
| 1983 | 853 |
317 |
928 |
1.184 |
1.602 |
817 |
875 |
395 |
378 |
411 |
270 |
- | 8.030 |
Total standardized effort - all zones
month |
J | F | M | A | M | J | J | A | S | O | N | D | TOTAL |
|---|---|---|---|---|---|---|---|---|---|---|---|---|---|
| year | |||||||||||||
| 1974 | |||||||||||||
| 1974 | 1.678 |
463 |
- | 271 |
1.454 |
1.539 |
1.082 |
1.319 |
1.291 |
699 |
300 |
449 |
10.545 |
| 1975 | 2.059 |
1.421 |
14 |
1.012 |
937 |
723 |
894 |
1.127 |
962 |
602 |
611 |
1.366 |
11.728 |
| 1976 | 1.449 |
225 |
186 |
468 |
758 |
788 |
748 |
1.422 |
854 |
1.526 |
1.142 |
1.701 |
11.267 |
| 1977 | 942 |
389 |
- | 452 |
241 |
182 |
659 |
437 |
219 |
275 |
112 |
261 |
4.169 |
| 1978 | 1.547 |
463 |
16 |
179 |
190 |
764 |
247 |
679 |
366 |
21 |
619 |
1.078 |
6.169 |
| 1979 | 660 |
173 |
272 |
599 |
227 |
360 |
1.170 |
798 |
212 |
95 |
728 |
1.605 |
6.899 |
| 1980 | 1.303 |
440 |
376 |
753 |
581 |
591 |
977 |
1.487 |
1.074 |
1.399 |
2.093 |
1.910 |
12.984 |
| 1981 | 1.909 |
1.370 |
1.063 |
1.438 |
1.930 |
3.183 |
2.006 |
671 |
777 |
453 |
2.015 |
1.691 |
18.506 |
| 1982 | 1.454 |
1.009 |
1.290 |
1.208 |
1.399 |
1.704 |
1.422 |
1.712 |
850 |
659 |
1.873 |
2.454 |
17.034 |
| 1983 | 1.801 |
839 |
1.146 |
1.372 |
1.819 |
1.792 |
3.086 |
2.343 |
3.265 |
3.590 |
2.705 |
1.085 |
24.843 |
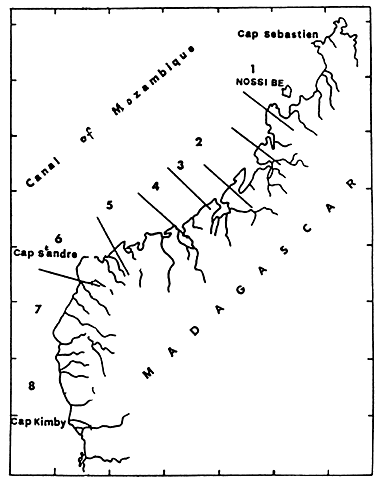
FIGURE 1: THE MANAGEMENT ZONES FOR SHRIMP IN MADAGASCAR: FROM RALISON (1987)
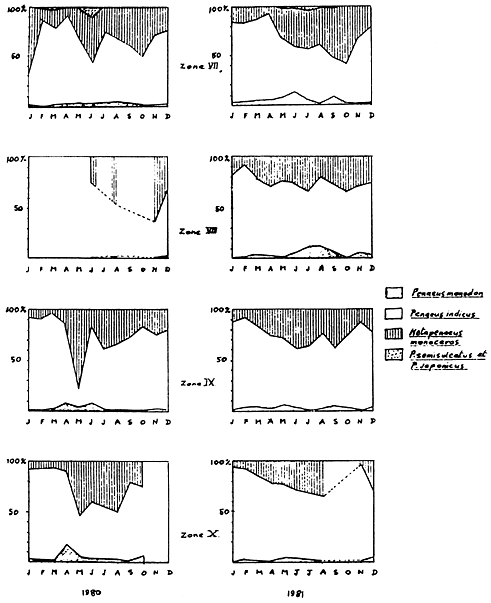
FIGURE 2: WEIGHT PERCENTAGES OF SPECIES CAUGHT
FIGURE 3: EVOLUTION OF CATCHES IN RELATION TO EFFORT (all zones)
par
A.G.A. Rabarison
(CENTRE NATIONAL DE RECHERCHES OCEANGRAPHIQUES, MADAGASCAR)
Le valakira est un barrage en form de "V" pointé vers le large, d'ouverture assez large (80o environ). Les cotés sont composés de poteaux en bois de palétuvier fichés dans la vase, ayant une hauteur de 1,50m de distant de 80cm. Le système de filtration est constituté par des lattis attachés aux poteaux et faits de râchis de raphia ou de bambou éclaté, reliés entre eux par des ficelles torsadées faites de raphia également. La grosseur des ficelles détermine l'espacement des tiges qui est de 0,5 & 0,7 cm. Les lattis forment des unités de 15m de long, appelées "kira". L'ensemble est un corral appele valakira (fig. 1 et fig. 2). Le nombre d'unités est en moyenne de 40, le coté faisant face au courant du reflux étant plus long de 2 unités pour augmenter la surface pêchante. Les ailes du barrage ont ainsi entre 270 et 300 m de longueur. A la pointe du "V" se trouve la chambre de capture faite de lattis de bambou éclate de 2m de hauteur avec une fenètre pour le ramassage des captures. Les deux unités près de la chambre sont doublées en hauteur afin d'augmenter la puissance de pêche, alors que les extremités du "V" sont fixées en boucles pour décourager les poissons voulant remonter les ailes du barrage.
Les valakira sont installés dans la zône médio-littorale et préferentiellement autour d'un estuaire ou dans les fonds de baie. Engin de pêche fixe, il necessite de forts courants de marées, obtenus par un marnage important. Le fond doit être sableux ou sablo-vaseaux afin de permettre aux lattis de rester bien fixés dans le sédiment. Les zônes exploitées par ce type d'engin sont le coté Est de la baie d'Ambaro, le fond de la baie de Narinda, les embouchures et estuaires des rivières entre Nosy-Bé et Analalava.
Le valakira est installé en début de vive-eau, quand le niveau de la basse mer atteint 1,0m, soit deux à trois jours avant la pleine lune ou la nouvelle lune. Les barrages sont en pêche pendant six a à sept jours et relevés quand la basse mer remonte à plus de 0,90m.
Lors de chaque reflux, le pêcheur est sur le kira à la mi-marée pour vérifier que les lattis restent en place. La force du courant les aidant, les crevettes ont en effet tendance à fouiller sous le sédiment pour s'échaper. Quand le kira est à sec, les prises sont puisées de la chambre avec des paniers en osiers. Un premier tri des crevettes est effectué. Parmi les poissons, seuls les gros individus et les Carangoidés sont gardés.
L'exploitation d'un valakira nécessite une certaine mise de fond. Le coût d'un engin de 40 unités étant de 140,000 FMG en 1983. A ceci, il faut ajouter l'achât d'une pirogue pour le transport de l'engin et les visites quotidiennes durant la période de pêche. Les unités sont reparées ou entierement remplacées entre les marées. En général, le pêcheur est propriétaire de son valakira et se fait aider par un marin-pêcheur. Mais beaucoup traveillent pour le compte d'un patron possédant 2 ou plusieurs barrages et qui n'est pas lui-meme pêcheur. La rémuneration du darin se fait à la part (tièrs des captures).
Les grosses crevettes triées, constituant la catégorie "crevette collectée", sont achetées par deux sociétés basées à Antsiranana qui les exportent sur Maurice, la Réunion ou la France. Les crevettes sont conservées sous glace au village, puis acheminées par route jusqu'aux salles de traitement et de stockage. Les crevettes sont commercialisées sous forme de "queue congelée" en boite de 2kg ou "decortiquée bouillie et séchées" en sachet de 500 g.
Le restant de la capture, constituant la categorie "crevette bouillie", est bouilli et séché sur place soit par les pêcheurs soit par des intermédiaires qui les revendent sur les marchés de l'intérieur. Théoriquement, des statistiques sur les quantités sortant de chaque village sont tenues mais dans la pratique ce n'est pas le cas.
Le tableau suivant présente l'évolution de la production des sociétés de collecte.
| Année | 1971 | 1972 | 1973 | 1974 | 1975 | 1976 | 1977 | 1978 | 1979 | 1980 | 1981 | 1982 |
|---|---|---|---|---|---|---|---|---|---|---|---|---|
| Tonnes | 153 | 166 |
273 |
291 |
243 |
245 |
180 |
159 |
167 |
145 |
153 |
178 |
| Nombre de | ||||||||||||
| sociétés | 2 | 2 |
3 |
3 |
2 |
2 |
2 |
2 |
3 |
3 |
3 |
3 |
| de collecte |
Le nombre de sociétés n'influe pas d'une manière significative sur le niveau de la production. Ceci vient du fait de la mauvaise organisation de la collecte (problème de transport, insuffisance de glace).
L'évolution de l'effort peut être résumé ainsi :
| Année | 1972 |
1975 |
1983 |
|---|---|---|---|
| Nombre de | |||
| valakira | 35 |
300 |
120 |
| (effort) |
Apres l'augmentation spectaculaire de 1975, le nombre de valakira a chuté. On observe actuellement une relance de la pêche, mais l'effort de pêche ne dépassera vraisemblablement pas le nombre de 200 valakira. Actuellement les barrages sont placés sur deux rangés dans les embouchures et sur une seule, le long des versants.
A cause de l'espacement réduit entre les tiges de lattis, le valakira peut capturer des individus de petite taille (jusqu'a 9mm de longueur de carapace). Dans ce sens les prises du valakira permettent d'obtenir une image exacte du passage des cohortes de la zône de mangrove aux fonds chalutables. L'engin capture également des femelles' adultes (1c+37mm) qui restent dans la zône médio-littorale, en fin de saison des pluies (Mars) et au milieu de la saison sêche (Aout). Mais son efficacité est limitée par plusieurs facteurs dont : le comportement des crevettes (tendant soit à sauter le barrage soit à s'échapper en passant sous les lattis), l'amplitude de la marée et la force du courant (déteriorant les tiges des kira ou augmentant l'écartement) ainsi que la configuration du fond (pouvant provoquer le phénomène d'évitement du barrage surtout quand le reflux n'est pas assez fort).
Parmi les cinq espèces Peneidae présentes dans la pêcherie, Penaeus indicus est dominante toute l'année alors que sur les fond chalutables P. semisulcatus la remplace durant la saison sêche. La composition spécifique moyenne des captures durant l'année est la suivante.
Les poissons capturés sont en général des espèces cotières euryhalines (Leiognathus equula, Therapon theraps) ou des juveniles de grosses espèces pélagiques (Chorynemus tool, Caranx tille). Les espèces dominantes observées par mois sont les suivantes :
| Mois | Avril | Mai | Juin | Aout | Septembre | Octobre |
|---|---|---|---|---|---|---|
| Especes | Leiognathus | Sardinella | Choryneaus | Therapon | Mugil | Rastrelliger |
| dominantes | equula | gibbosa | tool | theraps | strongilocephalus | kanagurta |
| Sardinella albella |
A partir de moyennes calculées sur 4 annees provenant de collecte d'une société, on peut délimiter une haute saison allant de mars à juillet et une basse saison d'octobre à fevrier.
| Mois | J | F | M | A | M | J | J | A | S | O | N | D |
|---|---|---|---|---|---|---|---|---|---|---|---|---|
| Collecte | ||||||||||||
| (tonnes) | 4,7 | 4,5 | 10,3 | 10,3 | 13,6 | 7,2 | 6,7 | 5,3 | 5,2 | 3,0 | 4,2 | 4,0 |
L'arrivée des juvéniles dans la zône de valakira a été observée de janvier à avril puis en septembre. La taille de recrutement est légerement plus grande chez les mâles que les femelles.
| Mois | J |
F | M | A | M | J | J | A | S | O | ||||||||||||||||||||||||||||||||||||||||||||||||||||||||||||||||||||||||||||||||||||
|---|---|---|---|---|---|---|---|---|---|---|---|---|---|---|---|---|---|---|---|---|---|---|---|---|---|---|---|---|---|---|---|---|---|---|---|---|---|---|---|---|---|---|---|---|---|---|---|---|---|---|---|---|---|---|---|---|---|---|---|---|---|---|---|---|---|---|---|---|---|---|---|---|---|---|---|---|---|---|---|---|---|---|---|---|---|---|---|---|---|---|---|---|---|---|
| Taille de | ||||||||||||||||||||||||||||||||||||||||||||||||||||||||||||||||||||||||||||||||||||||||||||||
| recrutement | 9 |
- |
13 |
10 |
14 |
14 |
- |
14 |
11 |
13 |
|
|||||||||||||||||||||||||||||||||||||||||||||||||||||||||||||||||||||||||||||||||||
| (Lc en mm) | 10 |
- |
8 |
9 |
13 |
11 |
- |
13 |
9 |
13 |
||||||||||||||||||||||||||||||||||||||||||||||||||||||||||||||||||||||||||||||||||||
| Taux de % | ||||||||||||||||||||||||||||||||||||||||||||||||||||||||||||||||||||||||||||||||||||||||||||||
| juveniles | 40 |
- |
25 |
32 |
8 |
31 |
- |
31 |
34 |
21 |
||||||||||||||||||||||||||||||||||||||||||||||||||||||||||||||||||||||||||||||||||||
| Lc < 16 mm |
Le pourcentage élevé des petites crevettes (2 mois environ) traduit le recrutement dans la zône. On note en janvier l'arrivée de la première génération; en avril celle de la cohorte intermédiaire et à partir de juin à septembre, celle des deux dernières générations de l'année (cohortes ab2 et B de Le Reste, 1978).
La pêche traditionelle de la crevette est un secteur important de l'économie locale. L'amélioration du système devrait permettre d'en faire un apport protéinique non négligeable, et d'un prix abordable aux populations et accessoirement une source de devises étrangères. Cependant les valakira posent le problème de rationalisation de l'exploitation. Etant donné que la pêcherie est installée dans la zône d'estuaire, voie de migration vers les fonds vaseux des baies ou du plateau continental, la majorité de capture est constituée par la classe d'age 3-4 mois. Le recrutement s'opère à l'age de 2-1/2 mois et il est observé presque toute l'année. De ce fait, l'aménagement de la pêche serait à rechercher plutôt vers une amélioration de la sélectivité de l'engin que vers la protection par le système de fermeture. Peu de chose a été fait concernant cette pêche et l'objectif prioritaire des travaux devra être, outre l'amélioration de la collecte des statistique, l'expérimentation d'un engin plus selectif mais dont la conception ne s'éloigne pas trop du valakira traditionnel. Un des résultats auquel on peut s'attendre serait l'augmentation dans les captures des classes d'age 4-5 mons, car il est établi qu'une partie de la population au moins séjourne dans la zône de pêche ó mois.
La pêche des "valakira" ou barrages côtiers a été observée en 1983. Des données sur l'évolution de l'effort de pêche (exprimé en nombre de valakira par an) et de la capture (production des sociétés de collectes) sont discutées. Le système de pêche est décrit pour la prèmiere fois et discuté sur le plan de la technologie. Des renseignements préliminaires sur la biologie de la pêche sont également donnés (haute saison de pêche, recrutement et migration hors de la zône, espèces capturées). Cette étude est encore en cours.
by
N.Y. Razafindralambo
(CENTRE NATIONAL DE RECHERCHES OCEANOGRAPHIQUES, MADAGASCAR)
Starting from nothing in 1967, the Madagascar shrimp fishery comprised 35 trawlers in 1977 and 48 in 1983 (of which 40 are still operating).
Following this increase in numbers, the gross tonnage as well as the engine power increased. Moreover, detection methods became more sophisticated (including the replacement of the try-net by echo sounders more sensitive to shrimp concentrations, and the use of radar for navigation, especially at night).
This preliminary communication attempts to study in what ways these improvements in the fleet, which signify an increase in the unit costs of the trawlers and their operating expenditure, are justified by increased captures. In other words, the objective of this study is to evaluate the economic and financial profitability of each type of trawler exploiting Malagasy waters.
| Type | Number | Horse Power |
Gross Tonnage |
Overall Length,m |
Endurance in days |
No. of crew |
|---|---|---|---|---|---|---|
| (1) | (2) | (3) | (4) | (5) | (6) | (7) |
F |
1 |
1,250 |
314 |
41.6 |
25 |
25 |
F |
8 |
500 |
238 |
28.1 |
25-52 |
27-27 |
F |
3 |
450 |
392 |
48.2 |
20-35 |
17 |
F |
2 |
400 |
118 |
25 |
--- |
18 |
F |
6 |
395 |
145 |
25.2 |
52 |
16 |
F |
4 |
380 |
131 |
25 |
30 |
16-23 |
F |
1 |
365 |
126 |
22.25 |
--- |
--- |
I |
4 |
287 |
58 |
17.3 |
5 |
12-13 |
I |
7 |
270 |
85 |
21 |
18 |
22 |
I |
4 |
150 |
30 |
15 |
5 |
8-11 |
TOTAL |
40 |
15,293* |
61,107** |


Compared with 1977, the number of trawlers has increased by 17% and the gross tonnage and engine power per boat have increased by an average of 31% and 3.6% respectively.
The notable increase in gross tonnage can be explained by the improvement in detection methods which reduce the searching time and increase the probability of capture; hence the necessity of providing a hold of larger capacity.
There were more freezer trawlers (about 65% of the total fleet) than ice-boats in 1983.
Owing to the growing importance of freezer trawlers (equivalent to an increase in number of 1.5 x between 1977 and 1983), it became necessary to modify the original reference boat unit (an ice-boat of 15m L with a 150 HP engine), which was valid only for the North-West zone. On the one hand, the heterogeneity of the fleet and on the other hand the classification of the boats by similar characteristics, make it difficult to identify a new reference boat unit to apply to the whole west coast.
The study of profitability included three fishing companies which provided data. For practical reasons, the trawlers have been classified into five groups according to their horsepower.
| Type of Trawler | Catch Tonnes | Fuel in million FMG |
Ice & Water in million FMG |
Salaries & wages in million FMG |
Other variable costs in million FMG |
Fixed Costs in million FMG |
Total Costs in million FMG |
|---|---|---|---|---|---|---|---|
| (1) | (2) | (3) | (4) | (5) | (6) | (7) | (8) |
| 150 HP (46) | 307,5 |
45 |
17 |
34 |
110,1 |
34,9 |
241 |
| 270-280 HP (116) | 1018,3 |
228 |
23,1 |
219 |
309,7 |
142 |
921,8 |
| 365-400 HP (11C) | 1282,3 |
415 |
9,5 |
315,2 |
437,8 |
128,8 |
1306,3 |
| 450-500 HP (7C) | 1047 |
285 |
- |
395,9 |
331,3 |
158,7 |
1134,9 |
| 1250 HP (1C) | 205 |
73 |
- |
57,2 |
85,1 |
40,7 |
256 |
| SUB-TOTAL | 3860,6 |
1046 |
49,6 |
985,3 |
1274,0 |
505,1 |
3860,0 |
| 2 Barges | - |
13 |
- |
7 |
35 |
- |
55 |
| TOTAL | 3860,6 |
1059 |
49,6 |
992,3 |
1309,0 |
505,1 |
3915,0 |
The catches of the three fishing companies reach about 4,000 tonnes with a value of 10,300 million FMG and incur costs in the order of 3,90 million FMG. Fuel comprises one third of the variable costs (which includes the operating expenses for two container barges which alone transport the catch from the fishing boats to the Port).
For an average annual operation:
One 150 Hp ice boat costs 60 million FMG for a catch of 77 tonnes of whole shrimp;
One ice boat of 270-280 HP costs 83.3 million FMF for a catch of 92.5 tonnes;
One trawler of 365-400 HP costs about 119 million FMG for a catch of 116.5 tonnes;
One freezer trawler of the 450-500 HP type costs about 162 million FMG for a catch of 150 tonnes;
and one 1250 HP freezer trawler costs 256 million FMG for a catch of 205 tonnes.
From Table 2 and the above information, it appears on first sight in terms of total costs, that the type of trawler with 150 HP engine is the most profitable, with the lowest cost of 779 FMG per kg of whole shrimp caught. It is also apparent that the greater the power, the greater the supplementary expenses incurred.
| HP of Vessel | Catch in tonnes (1) |
Costs (2) |
Catch per unit cost (1) : (2) |
|---|---|---|---|
150 |
77 |
60 |
1,28 |
270-280 |
92,5 |
83,8 |
1,10 |
365-400 |
116,5 |
119 |
0.98 |
450-500 |
150 |
162 |
0.92 |
1250 |
205 |
256 |
0,80 |
A 150 HP trawler thus shows the highest catch per unit cost. Its operational characteristics, however, are limited in terms of its size, endurance at sea and capacity being unable to undertake long journeys and to cover the areas of greatest density over the wholwest coast. Moreover, the conditions for the crew are not comfortable.
WARREN and GRIFFIN (1980) have distinguished two kinds of costs for a better appreciation of profitability:
For each class of trawlers, the percentage of total costs are as follows:-
| Variable costs (%) | Fixed Costs (%) | Total (%) | |
|---|---|---|---|
150 HP |
85,5 |
14,5 |
100 |
270-280 HP |
84,6 |
15,4 |
100 |
365-400 HP |
90 |
10 |
100 |
450-500 HP |
86 |
14 |
100 |
1250 HP |
84 |
16 |
100 |
From the standpoint of variable costs, and ignoring fixed costs which might bias the analysis (e.g. the trawlers are not of the same age), the operation of a freezer trawler of 1,250 HP appears most profitable.
Nevertheless, in comparison with the shrimp trawlers of the Gulf of Mexico where variable costs comprise 70-75% of total costs, this same percentage is too high in Malagasy trawlers. This can be explained by difference in the price of fuel, of fishing gears, etc. between the two countries.
Three of the four fishing companies have together produced a gross benefit of 3,300 million FMG and a net profit of 2,300 million FMG. This means that the year 1983 has been profitable for the shrimp industry, although the fleet has only been utilised at 85% of its total capacity.
The provisional financial results by type of trawler are:
Vessel | Total Receipt | Total Costs | Global Profit | Profit per |
|---|---|---|---|---|
150 HP (4) |
791,5 |
241,0 |
+ 550,5 |
+ 137,6 |
270-280 HP (11) |
2621,0 |
921,8 |
+ 1699,2 |
+ 154,6 |
365-400 HP (11) |
3300,5 |
1306,3 |
+ 1994,2 |
+ 181,3 |
450-500 HP (7) |
2696,2 |
1134,9 |
+ 1561,3 |
+ 223,0 |
1250 HP (1) |
527,6 |
256,0 |
+ 271,6 |
+ 271,6 |
From the point of view of financial results, it is the 1,250 HP trawler which is the most profitable. Might one conclude, therefore, that this trawler is the most profitable in economic terms?
It is necessary to consider the disadvantage and advantages of operation of a given vessel faced with the biological and geographical realities in Madagascar. This freezer trawler certainly ensures a greater and higher valued production due to its preservation system and to its greater endurance and capacity on one hand, but on the other hand, it cannot operate close to the coast.
Moreover, the price of such a trawler is a burden which cannot be afforded by all the companies. Its operation can always be combined with an ice-boat of 270-280 HP or with a freezer trawler of 450-500 HP.
The problem which is posed is that of identifying the optimal combination of these types of trawlers in a fleet which produces the best returns for the companies and the national economy.
CLARK and KIRKWOOD (1979) propose the simultaneous use of three types of parameters - technological (e.g. catchability co-efficient), biological and economic - in order to establish a bio-economic model and to resolve the above optimisation problem.
Taking account of available data, one can already foresee for the management to be undertaken in the Malagasy shrimp industry, the future choice of two types of trawlers which are most profitable to operate. While awaiting the availability and analysis of other biological information (e.g. fishing effort of each type of trawler) and economic data, two factors which already limit the elaboration of a bio-economic model are:
An increase in profitability also necessitates continuous and vigilant maintenance and repair of the trawlers.
- CLARK (C.W.) et KIRKWOOD (G.P), 1979 - Bioeconomic model of the Gulf of Carpentaria prawn fishery. J. Fish. Res. Board CANADA No. 36, pp 1304-1312.
- MARCILLE (J.), 1978 - Dynamique des populations de crevettes peneides exploités a Madagascar: Analyse des rendements des chalutiers; travaux et documentation de l'ORSTOM, Paris, FRANCE, pp 70-78.
- RALISON (A.), 1978 - Caractéristiques et tendances de l'exploitation crevettière malgache de 1967 a 1977. Doc. Sci. Centre Nat. Rech. Océanogr., NOSY-BE, No. 1, 37p.
- WARREN (J.P.) et GRIFFIN (W.L.), 1980 - Cost and Return trends in the Gulf of Mexico shrimp industry, 1971 - 1978, Technical Article No. 14996, Texas Agriculgural Exp. Station, Texas A and M University, U.S.A.
Ces données ont été recueillies à la suite des enquêtes et observations effectuées par le Département Halieutique du Centre National de Recherches Océanographiques, dirigé par M. Rabarison A.G.A. biologiste.
ANNEE |
58 |
71 |
72 |
73 |
74 |
75 |
76 |
77 |
78 |
79 |
80 |
81 |
82 |
83 |
84 |
|---|---|---|---|---|---|---|---|---|---|---|---|---|---|---|---|
| N.V. | 10 | - | 35 | - | - | 300 | - | - | - | - | - | 125 | - | 128 | 183 |
| P(ton) | ? | 153 | 166 | 273 | 291 | 242 | 245 | 180 | 150 | 167 | 145 | 153 | 178 | 180 | 104 |
| S.C. | - | - | - | SUM | SUM | SUM | SUM | SUM | SUM | SUM | SUM | SUM | SUM | SUM | SUM |
| GR | GR | GR | GR | SOR | SOR | SOR | SOR | SOR | SOR | SOR | RSA | ||||
| SIP | - | - | - | - | - | - | PNB | PNB | PNB | PNB | PNB | ||||
La majeure partie des crevettes dont la longueur céphalothoracique est supérieure à 17mm considerée comme gros calibre, est destinée à 90% à l'exportation. Ces crevettes sont appelées "crevettes de collecte".
Mois |
J |
F |
M |
A |
M |
J |
J |
A |
S |
O |
N |
D |
Moyenne |
|---|---|---|---|---|---|---|---|---|---|---|---|---|---|
| % | |||||||||||||
| en nomb. | 47 | - | 30 | 48,5 | 44 | 36 | 43 | 41 | 45 | 29 | - | 56 | 42,1 |
| en poids | 20 | - | 8 | 24 | 25 | 20 | 20 | 12 | 21 | 11 | - | 36 | 21,5 |
Les crevettes dont la Lc est inférieure à 17mm entrent dans la catégorie commerciale à bouillir et sont appelées "crevettes bouillies". Celles-ci sont exportées partiellement, en particulier vers La Réunion et representent en moyenne 21,5% des crevettes capturées.
A raison de 2 pécheurs par valakira, le nombre moyen de pécheurs est estimé à 366 personnes en 1984.
Le Tableau 3 montre le coût des transports supportés par une Société de collecte.
| Mois | Location de voiture |
Carburant | Total en Faq |
Quantites transport,es en Kg | Frais/Kg tansportés |
|||
|---|---|---|---|---|---|---|---|---|
| Crev. | Cam. | Poisson | Total | |||||
| Janv. | 351,500 |
54,760 |
406,260 |
689 |
250 |
291 |
1,230 |
330 |
| Fevr. | 674,000 |
67,636 |
741,636 |
2,195 |
360 |
428 |
2,983 |
249 |
| Mars | 379,500 |
182,188 |
561,688 |
4,906 |
598 |
1,170 |
6,674 |
84 |
| Avril | 575,000 |
150,810 |
725,810 |
1,695 |
223 |
1,641 |
3,559 |
203,9 |
| Mai | 1,023,000 |
308,560 |
1,331,560 |
4,880 |
286 |
5,538 |
10,704 |
106 |
| Juin | 885,500 |
205,366 |
1,090,866 |
6,257 |
149 |
8,721 |
15,127 |
72 |
| Juil. | 644,000 |
143,140 |
787,140 |
9,828 |
95 |
2,428 |
12,351 |
64 |
| Aout | 552,000 |
188,632 |
740,632 |
4,724 |
1,041 |
214 |
5,979 |
124 |
ou Crev. = crevettes blanches; Cam. = Camarons
Le coût des transports inclue aussi celui des poissons qui représente 34% en moyenne des coûts totaux, soit 66% pour les crevettes équivalents à 4 milliards de Fmg par an.
Les coûts d'exploitation du valakira sont par contre supportés par le pécheur et d'un village à l'autre, le prix des matériaux et celui de main d'oeuvre peuvent varier mais dans une faible proportion. Il en resulte qu'un valakira moyen de 40 unités se valorise comme suit: (prix 1984)
Désignation | Prix unitaire | Nombre | Prix total en FMG |
|---|---|---|---|
| - Champ de capture | |||
. paquets de 1000 tiges |
750 | 40 |
30.000 |
. rouleaux de ficelles |
100 | 4 x 40 |
16.000 |
. tiges de bois |
15 x 25 | 25 x 40 |
20.000 |
. main d'oeuvre |
1000 | 40 |
40.000 |
| - Chambre de capture | |||
. tiges de bambous |
15 | 55 x 5 |
4.125 |
. rouleaux de ficelles |
100 | 6 x 5 |
3.000 |
. tiges de bois |
20 a 30 | 10 x 5 |
1.250 |
. mains d'oeuvre |
2000 | 5 |
10.000 |
TOTAL |
124.375 |
||
Pour relever les valakira apres chaque marée, le pêcheur utilise une pirogue qui est achetée en tronc deja creusée, non encore poli et qui coûte entre 40.000 Fmg et 60.000 Fmg. Si la finition coute entre 5000 et 10.000 Fmg, la pirogue revient entre 50.000 et 70.000 ou en moyenne à 60.000 Fmg.
Ainsi les dépenses annuelles totales s'élévent á 121.900 Fmg (Tableau 5)
Désignation | Prix unitaire en FMG | Nombre | Prix total en FMG |
|---|---|---|---|
| main d'oeuvre | 1.500 |
20* |
30.000 |
| tiges de bambous | 15 |
3 x 20 |
900 |
| tiges de raphia | 750 |
1 x 20 |
15.000 |
| rouleaux de fil | 100 |
2 x 20 |
4.000 |
| tiges de bois | 20 |
30 x 20 |
12.000 |
| pirogue | 60.000 |
1 | 60.000 |
TOTAL |
121.900 |
* On a émis l'hypothèse suivant laquelle le valakira est implanté 20 fois dans l'année c'est à dire ne fonctionne que dix mois sur douze et à raison de deux marées par mois.
Un valakira à une durée de vie moyenne d'un an et sa dépréciation à la même valeur que celle de ses dépenses de fabrication d'entretien ou de réparation soit 61.900 Fmg.
Quant à la pirogue qui sert aussi pour d'autres occupations (pêche, transport) et qui dure environ 10 ans le coût de l'amortissement est evalué à 6000 Fmg/an; le coût total annuel de l'amortissement s'élève donc à 67.900 Fmg.
Si le pêcheur s'occupe lui-même de l'écoulement de ses produits, il aura à supporter les frais de transport; mais en général, ce sont surtout les Sociétés qui prennent en main la commercialisation.
by
B.Thiga
(GOVERNMENT OF KENYA/ UNDP/ FAO Pilot Project)
Shrimps (Prawns/Crustacea) are among the most important resources of the coastal fisheries. In the international trade they are considered a luxury food commodity. Though their distribution is worldwide up to subpolar latitudes, they are mainly found in tropical and subtropical regions. Most of the highly commercially valued species of shrimps are to be found in fishing grounds between the tropical seas.
In Kenya, shrimps are among the group of crustacea which have been exploited for many years. Fishing methods range from simple local gear used by artisanal fishermen along the coast to highly mechanised trawlers operated by private companies. Data collected from shrimp landing centres for the last three years do not indicate a definite trend in the catch as shown in the following table:
Year | 1982 | 1983 | 1984 |
|---|---|---|---|
| ---------------------------------------------------------------------------------------------------------------------------------------- | |||
| Quantity (Kg) | 314388 |
314388 |
405643 |
This is perhaps due to various factors which need further investigation.
There is a very high demand for shrimps especially in industrialized countries and this has created a strong incentive for developing countries to concentrate on this fishery for export. This has been done in most cases by increasing the number of shrimp trawlers. As a result there is massive exploitation of this coastal resource which has led to situations where some of the stocks have been depleted. In areas where increased fishing pressure is possible there exist other problems for the fishing industry like increased operation costs due to energy crisis.
In some cases mostly in industrialized countries pollution is a key factor affecting the nursery grounds, thereby reducing recruitment.
The above factors make management of fishing grounds difficult but however enhance the chances of shrimp culture development.
For several centuries countries of South East Asia have been trapping and growing penaeid shrimp in intertidal ponds although commercial shrimp culture can be dated to the beginning of the sixties in Japan. In Latin America shrimp culture activities started in the late sixties.
In Africa despite the presence of vast coastal areas with good potential for development and presence of species suitable for culture, shrimp culture has not been developed to any remarkable extent apart from a few trials (unrecorded) in Tunisia and Ivory Coast. In countries like Japan where shrimp culture is developed great efforts and funds have been applied. The result has been successful as over 1,000 tons of cultured shrimps are produced each year.
There are numerous suitable and favourable factors for establishment of shrimp culture in Kenya and this may generally also apply to other countries in the tropics. Kenya is within the tropics which is the natural habitat of most of the fast growing species of shrimps and thus gravid females could be available easily and abundant of wild fry in great numbers. The tidal range is high (highest 4 m in Kenya) and this allows the use of gravity for filling and draining the ponds thereby avoiding use of external energy for pumping and this would lower the cost of investment. In addition, although the tidal range is 4 metres most of the intertidal zone is comparatively of a high elevation to the high tide levels as a result the dykes needs not cover the full tidal range height. Most of the coastal areas are marshy land which is idle. This indicates that there would be no competition for land with other profit making investment like agriculture or livestock development. This land could thus be obtained easily. The shrimp culture potential areas are generally in the rural areas where labour is abundant and cheap.
Kenya is a country with a very vast coastal area with extensive lagoon systems. These lagoons are subjected to tidal influence and in some areas mangrove swamps occurs.
The intensity and extend of the mangrove is different from place to place. Some of the lagoons experience inflow of freshwater from rivers which are perennial but some have freshwater inflow only during the rainy season. These lagoons also serve as a fishing ground for local fishermen who cannot afford mechanized gear to go further out in the sea.
Though a more thorough study is necessary the intertidal area around these lagoons may be good potential shrimp farming areas.
Till 1978 no detailed work has been carried out to find out if coastal mariculture is practical in Kenya.
The climate and ecological conditions of marine organisms along the Kenyan Coast are similar to those of other countries around the Indian Ocean where coastal aquaculture has been successful.
On realising this, the Government requested the establishment of a pilot project to test the technical and economic feasibility of coastal aquaculture along Kenya Coast under local conditions.
The work on the project was started in 1978 financed jointly by Kenya Government/UNDP and executed by FAO.
The project is located in Ngomeni which is 25 km North of Malindi town. This area was selected partly because of positive features for mariculture namely, appropriate soil which is composed mainly of clay which would retain water satisfactorily. The area is free of pollution. The area is generally flat and this would lower construction work.
Also initiated together with the pond construction work was a biological survey programme to find out the availability and abundance of wild shrimps seed (baby prawns) and fish for stocking material.
The results of this survey has indicated that, three commercially important penaeid species are available in the area namely: Penaeus indicus, Penaeus monodon, Metapenaeus monoceros. Of these P. indicus forms about 85% while other two form the remaining 15%. The biological survey has also confirmed that the shrimp seeds are available almost throughout the year round but with abundance fluctuations in some months.
Small growout ponds ranging from 1.0 hectares to 1.7 hectares have been constructed using manual labour. Up to now 9 growout ponds have been completed with a total area of 13.0 hectares. For the construction materials, shovels are used for digging, wheel-barrows for transportation while wooden boards are provided as runners for the wheel-barrows.
The main operations in the farm after the pond is complete can be generalised as follows.
Ponds are prepared for stocking by trapping in 10-15 cm of water and retaining it for 10-15 days till enough lab-lab (micro-benthic plants and animals) is developed. In some ponds organic and inroganic fertilizers are added to enhance quick growth. When adequate lab-lab is developed and if the tides allow the level of water is raised to 30-40 cm for stocking.
Juvenile shrimps are collected from the lagoon during the low tides using pole seine nets or stick net. When collection is done in the area next to the aquafarm the shrimp seeds are put in basins and transported to the pond site for stocking. However, sometimes it is necessary to collect the shrimp seed further away from the farm. In the latter situation, collected shrimps seeds are held in float cages and towed with a boat to the farm during the high tide.
The captured shrimp seeds are estimated and released to grow out ponds. The stocking density has been maintained at 30,000/ha. In most cases the average weight for stocked shrimp is about 0.08 gm.
Due to the characteristic of the tides, it is not possible to fill the ponds with water throughout the month. It is only possible to fill the ponds after every other week. This together with lack of inflow of freshwater and high rate of evaporation raise salinity. Salinities as high as 55 ppt have been recorded in the ponds during the hot season while the salinity in the laoon almost maintains at 36-37 ppt.
To check further salinity increase water in the ponds is changed as often as practical. The fresh tidal water from the sea also brings in nutrients to the pond.
Pond gates are fitted with adequate fine mesh screens to prevent escape of the shrimps and also filters other marine fishes which may be in the incoming water.
In some cases the lab-lab growing on the pond bottom detaches and rises to the surface and drifts to the edge of the pond. This is mainly removed and put on the dykes to dry otherwise it would eventually deteriorate and pollute the pond.
During the culture period, the level of water is progressively increased from the initial 30-40 cm at stocking to 55-60 cm or maximum possible by harvest.
Harvesting is done after 90-100 days of growth when one production cycle is complete. This is effected by draining all the water in the ponds. The shrimps generally tend to swim with the draining water and congregate at the gate where they are eventually seined or scooped out.
It has been observed that the harvested shrimps are composed approximately of 95% P. indicus in most case while the rest is mainly P. monodon which apparently grows to a bigger size. There are hardly any M. monoceros at harvest. The average weight of the harvest shrimps in most cases ranges from 10 g to 14 g for P. indicus while P. monodon would be above 25 g.
It is possible to prepare a pond for the next production cycle within 15-30 days if conditions are favourable. This pond preparation period together with the growth period makes up a complete production cycle of about 115 days. Three harvests per year per pond is the usual practice.
Production from 1982 when the first pond was complete to the present has been rather variable. Production ranging from 200 kg/ha/yr to 900 kg/ha/yr have been realised in some cases. It has been observed that production is slightly improved by addition of fertilizers.
Lastly, I may say that various private parties have shown remarkable interest to start shrimp culture in Kenya. As now there are no visible private shrimp ponds but some people both Kenyans and foreigners have already started carrying out investigation on various potential sites for shrimp culture.
by
H.P. Stirling
(CENTRE NATIONAL DE RECHERCHES OCEANOGRAPHIQUES, MADAGASCAR)
There is no doubt that the wild penaeid stocks of the North-West coast of Madagascar are fully exploited, and that a further significant increase in shrimp production can only be achieved by the development of shrimp culture, as has already occurred in Southeast Asia. There are good prospects for introducing shrimp culture in Madagascar, there being two basic, yet fundamentally different approaches to the culture of penaeid shrimp, intensive and extensive, which are outlined below. This report presents the case for initiating extensive prawn culture, particularly in the North-West zone of Madagascar in which a shrimp processing and export infrastructure already exists.
Intensive culture relies on technology to provide an optimal aquatic environment for shrimp, enabling them to be stocked at densities very much greater than in nature, and capable of yielding several tons per ha. per year. Such methods involve high costs for construction, investment in plant and power consumption and rely on the provision of a nutritionally complete diet, which alone comprises a large proportion of variable production costs. The need for precise control over stocking neccesitates the construction of costly hatchery facilities where control of water quality, nutrition and disease is all the more important. Only advanced countries, notably Japan and Taiwan, have been able to profitably develop such intensive methods on account of their long experience of aquaculture, highly developed technological infrastructure, presence of a food technology industry capable of producing compounded diets and, above all, very high market prices for top quality live shrimp.
An intensive approach to shrimp production was advocated by the Consultants France Aquaculture, in a report commissioned by Nosy-Peche in 1980. Many similar proposals have been made by European and American aquaculture consultants throughout the third world, which tend to stress the application of Western engineering technology but often fail to appreciate the reality of the local situation and the order of priorities of national development objectives. In most developing countries, labour (admittedly unskilled) is both plentiful and cheap while technology is expensive to buy and extremely difficult to maintain. Madagascar, in particular, lacks a sufficiently developed communication system and technological infrastructure; it is characterised by high fuel and electricity costs and lacks the sophisticated local market for prawns characteristic of Southeast Asia. Moreover, there is no historical experience of aquaculture and suitably trained and motivated local manpower is not available. Launching de novo into intensive prawn culture would be highly inappropriate for Madagascar in its present state of development.
Extensive methods of prawn production rely upon capitalizing on the ability of most tropical countries to harbour natural populations of penaeid shrimp through the application of sound ecological principles. The coastal mangrove ecosystem, which characterises much of the coast of Madagascar, functions as the main nursery ground for post-larval and juvenile penaeids, particularly the commercial species contribution to the valakira and bottom trawl catches. The mangrove is an open tropical ecosystem which interfaces with the terrestrial and marine environments, and in which large quantities of inorganic and organic nutrients, carried down the rivers and produced in situ by the trees, is trapped and recycled through the activities of the varied flora and fauna. Thus a large supply of particulate organic food ideal for shrimp is available as well as large quantities of wild shrimp seed. There is, therefore, no need for specialised food technology nor for shrimp hatcheries for the forseeable future.
Suitable manipulation of the mangrove environment, through construction of earthen ponds which rely on tidal exchange to oxygenate the water and bring in particulate food, enables shrimp to be cultured using a very simple level of technology. The only inputs required are occasional dressings of agricultural lime to neutralize soil acidity and the application of locally available organic fertilisers, such as sugar cane compost and animal manure, to promote benthic algal production. Control of predators and competitors of the shrimp is also advisable, through the use of vegetable poisons such as rotenone, derris, tea seed or tobacco. Such extensive rearing techniques without supplementary feeding are capable of producing 250-800 kg per ha. per year (depending on quality of pond management and natural productivity) for very low labour, capital and running costs. Giving moderate doses of supplementary feeds, such as shrimp processing wastes, permits stocking densities to be increased and productivity per ha. to be more than doubled. Attempts to raise shrimp yields much above 1-1.5 tons per ha. inevitably lead to mortality problems caused by poor water quality, cannibalism or disease and are best avoided. Penaeid shrimps are particularly susceptible to such problems compared to finfish such as tilapia, mullet or milkfish. Production cycles, which last about 6 months from stocking to harvest of young adults, are best geared so that harvest coincides either with seasonal shortages in the world market (with higher export prices), or with periods of under-capacity in the processing plant, i.e. during the closed fishing season (mid-December to mid-February) and the low fishing season 6 months later. This is one great advantage of culture over capture.
Extensive shrimp culture is to be strongly advocated in the present socio-economic climate of Madagascar. In comparison with intensive culture, it is far easier to impart the necessary skills to local people and there will be far less reliance on imported technology, foreign specialist expertise and savings in foreign exchange. Consequently there are better prospects for a self-sufficient aquaculture industry in the future, and for the eventual establishment of family-owned aquaculture enterprises throughout the North-West region who would be well placed to sell their product through the industrial shrimp companies, who have the vitally important processing and marketing infrastructure. Potentially this represents a widespread and significant economic benefit to the coastal fishing communities of North-West Madagascar, and there are good prospects for reducing the pressure on wild shrimp populations exerted by the artisanal valakira fishery.
The main requirement is for suitably sheltered flat coatal land, free from aquatic pollution and severe problems of inundation. Madagascar has an abundance of suitable areas, including the extensive mangrove zones of the North-West coast, particularly the Baie d'Ambaro and the large estuaries of Narindra and Mahajamba. In addition there appears to be several suitable sites on Nosy-be, one of the largest and most convenient being Anse de Cratere, as proposed in the report of France Aquaculture. Preliminary investigation of soil and water characteristics indicates that the local volcanically derived soils are of the ideal clay-loam type with little evidence of the acid-sulphate reaction which bedevils many potential sites in the far east.
Madagascar also enjoys two important advantages for extensive aquaculture; an ideal tidal regime for filling, exchanging water and emptying the ponds, with an annual mean range at Nosy-Be of 2.3 m which increased to 3.6 m on spring tides, and an almost certainly adequate supply of wild prawn post-larvae, at least in the Baie d'Ambaro. One possible difficulty may be the separation of seed of the more desirable species for culture, notably Penaeus monodon and Penaeus indicus which can attain total weights of 50-60 g in 6 months, from smaller, less desirable but more abundant species such as Metapenaeus monoceros, which grows to 5-10 g but in only 2-3 months. It is worth noting the considerably faster growth rates that can be achieved in a well-managed aquaculture environment compared with the wild. Another problem is that P. monodon, the largest, most valuable and fastest growing species, is rare in the Baie d'Ambaro/Nosy-Be region, so fry will have to be collected from the estuaries of Baie de Narindra and Baie de Mahajamba where it occurs in sufficient quantities.
At present, the shrimp and fish resources of the mangrove zone are exploited only by primitive artisanal methods which give a very low yield on a unit area basis. The major method is the "valikira" intertidal barrage trap which catches juvenile penaeids, young fish and the mangrove crab Scylla serrataa. Such traps, where widely employed as in the Baie d'Ambaro, exert heavy mortality on sub-adult prawns and present a possible threat to adult stocks similar to "growth overfishing", whereby excessive catches of juveniles prevent adequate numbers growing on to recruit to the adult populations offshore. The latter are effectively exploited by the mechanized bottom trawling industry in Madagascar, through the provision of limited fishing licenses for each zone.
While the activities of the artisanal trap fishermen need to be controlled and further expansion prevented to protect the shrimp stocks, it is not socio-economically feasible to reduce their activities. In any case, juvenile prawns in the mangrove suffer a very high rate of natural mortality which a moderate number of valakira traps would merely replace, without harm. Coastal aquaculture can provide a useful "safety valve" for alleviating pressure on the juvenile shrimp populations, and it presents an opportunity to diversify from traditional trapping to husbandry, with the possibility of increased incomes for those fishermen taking the initiative. Aquaculture cannot be expected to transform the situation overnight, as it requires a drastic change in outlook from a hunting tradition to one of husbandry and care. The development of coastal aquaculture and training of local cadres at the village level will require the participation of international development organisations such as FAO, once its biological and technical feasibility has been established by the present UNESCO project in collaboration with CNRO.
It is important to bear in mind the crucial nursery role played by the mangrove environment in natural fish and prawn populations, and large-scale clearance of mangrove for aquaculture should be avoided. Where this has been done in Southeast Asia, biological productivity and cultured shrimp yields have fallen drastically after initial high levels which depended on the capital accumulation of organic food materials built up by the mangrove. The mangrove zone must be managed carefully in order to conserve its productivity and a balance achieved between developments such as aquaculture and its important role in natural fish and crustacean resources. Judicious aquaculture development, however, does not pose any threat to the environment.
The active participation of the shrimp fishing industry in the development of shrimp culture in Madagascar should be encouraged. This industry has demonstrated much enterprise in the development of the capture, processing and marketing of penaeid shrimp. It is well placed to take the first steps towards prawn cultivation on account of its access to technical infrastructure, including civil and mechanical engineering workshops, food processing facilities and cold stores and the all-important knowledge of overseas markets.
This industry can also utilise its shrimp processing wastes, consisting of shrimp cephalothorax when shrimp are de-headed in the factory, which comprise about 38% of the total body weight. Such wastes are presently dumped at sea, but would constitute a nutritionally ideal diet for cultured shrimp, with a perfect amino acid balance. Possible problems of introducing diseases and parasites into the cultured stock can be overcome by suitable treatment, such as cooking or ensiling. Another possibility is the utilization of the considerable quantities of by-catch of small finfish (principally of the families Leiognathidae, Carangidae, Mullidae, Clupeidae, Pomadasyidae and Therapondidae), nearly all of which is dumped at present except for the larger Carangids, Otolithes, Rastrelliger and the sole Psetiodes erumei. This would represent a potentially valuable source of high quality animal protein which, with a low technology processing system such as acid silage, could provide a useful protein supplement to shrimp feeds, and also other domestic livestock such as pigs and chickens. Thus the value of the shrimp by-catch could be raised sufficiently to make it economic for it to be retained on board, assuming that enough hold capacity would be available (which is true at least for the larger vessels).
There is, therefore, the eventual possibility of integrating shrimp catching and shrimp culture within one organisation, with the possibility of adopting more intensive shrimp culture systems involving feeding at least to moderate levels and a consequent increase in productivity.
The development of shrimp culture also requires outside specialist expertise on assessing the suitability of coastal environments, including currents and tides, seasonal incidence of cyclones and precipitation, water quality (especially salinity, temperature, dissolved oxygen, pH and nutrient levels) sediment characteristics (notably water-holding capacity, sulphur content, organic content and Eh). Also necessary are physical surveys of potential sites, surveys of wild shrimp seed supplies in space and time, and knowledge of cultivation systems and techniques. This expertise is best provided by non-profit making national or international development agencies involving medium term agreements with the national government which specifically address themselves to:
The purpose of UNESCO's project MAG/81/TOI is to collaborate with the national CNRO to achieve these objectives and assist with the overall development of marine resources, based on sound and comprehensive environmental data. A short-term objective is an in-depth appraisal of the potential for Madagascar. Extension of the project is being sought for 2-3 years beyond the present Phase I, which is due to terminate in 1986.
There are good prospects for developing extensive penaeid shrimp culture in Madagascar, especially along the North-West coast which has an abundance of suitable coastal sites. Moreover, most of the industrial shrimp companies, with their business and export experience, are located in this region, as well as the national marine research centre (CNRO). There is much to be gained through collaboration in aquaculture development between National Government, the shrimp industry and international development agencies in order to meet national development goals.
by
Y. Enomoto, M.I. Jehangeer and M. Munbodh
(ALBION FISHERIES RESEARCH CENTRE, MAURITIUS)
An increased demand for shrimps in local and foreign markets has recently generated interest in marine shrimp farming in Mauritius. Several species of marine shrimps are known to occur in the coastal waters around Mauritius but virtually no basic biological information is available on them. Research work started in 1984 (Enomoto et al, in preparation) has elucidated some aspects about the taxonomy, ecology and biology of the commonly occuring marine shrimps in Mauritius. Among the shrimps identified, four species: Penaeus monodon (Fabricius), Penaeus latisulcatus (Kishinouye), Penaeus canaliculatus (Oliver), and Metapenaeus monoceros (Fabricius) have been found to have some potential for aquaculture in Mauritius.
The natural shrimp stock however appears to be rather small. Only a few tonnes are taken annually by some thirty to forty active shrimp fishermen. The fishing gear used is a small mosquito net mounted on 2 poles and not exceeding 2m2. Fishing operations are carried out at night by individual fishermen using artificial light. Surveys of shrimp seed resources showed that with the possible exception of P. latisulcatus and M. monoceros the low availability of natural shrimp seed specially of P. monodon would considerably limit the number of ponds which could be stocked. Hence to enable the future development of marine shrimp aquaculture, it is necessary to develop the artificial seed production of the appropriate local marine shrimp species.
Penaeid shrimp hatcheries are being established in many parts of the world to meet the increasing demand for quality shrimp seed for coastal aquaculture. However, for an efficient programming of post larvae production, a steady supply of spawners is essential. Recent work in Mauritius (Enomoto et al in preparation), shows that mature specimens of P. monodon, P. latisulcatus and M. monoceros could be available at certain period of the year to make hatchery operation possible. Hence a brief account of the breeding biology of the most important shrimp species is presented. Spawning and larval rearing of P. monodon and M. monoceros are reported for the first time in Mauritius. The prospects for marine shrimp culture is outlined.
The juvenile phases of most penaeid shrimp species are spent in estuaries or shallow coastal areas from where the shrimps emerge at the onset of maturity of migrate against a regional current to oceanic depths to spawn (Racek A.A. 1972, Motoh, 1981). From the percentage of mature specimens (Stage III & IV) in samples collected at regular intervals from the shallow coastal waters between January 1984 to August 1985, the spawning seasons can be represented as per Table 1.
Species | Spawning season |
|---|---|
| P. monodon | Summer (September-May) with peak between February- May. |
| M. monoceros | Summer, with 2 peaks, in early (October-December) and late summer (March-May). |
| P. latisulcatus | Year round, with 2 peaks in early summer (October- November) and late summer (March-May). |
Fully gravid specimens of P. monodon and M. monoceros were available during the spawning seasons whereas, only maturing ones (Stage III) were obtained in the case of P. latisulcatus. No mature females of P. canaliculatus were found though fully mature males were generally caught.
Adult specimens of P. monodon (female: CL>47 mm; Male: CL>37 mm, Motoh, 1981), and M. monoceros were caught by beach seine from the estuary at Grand River South East and transported to Albion Fisheries Research Centre in aerated plastic containers in batches of not more than five at a time. Each trip lasted between one to two hours. Each mature female (Stage IV) was immediately transferred in fibreglass aquaria containing 0.5 m3 full strength filtered sea water with good aeration. After spawning the females were removed and the number of eggs spawned and subsequently the number of hatched nauplii were estimated by counting aliquot samples. The result is given in Table 2.
Out of fourteen gravid P. monodon females, six spawned within thirty six hours after being transferred in water of salinity of 32%. Three of these females spawned in March when no larval rearing tanks were available. For practical purposes, these spawning were overlooked, though nauplius and zoea stages were observed in the spawning tanks. Hatching rate of P. monodon varied bwtween 41% and 60%. Out of nine gravid M. monoceros females, three spawned within six hours after being transferred in water of salinity 32%. Hatching rate varied between 46% and 64%.
| Date (1985) | Species | Carapace | Time transferred | Date and time | No. of eggs | No. of nauplii | Hatching | Remarks |
|---|---|---|---|---|---|---|---|---|
| length | to 32%o water | spawned | laid | hatched | rate % | |||
| (mm) | ||||||||
| 5 April | P. monodon | 58.9 | p.m. 10 | a.m. 3 | 18 x 104 | 7.4 x 10⁴ | 41 % | Some post larvae |
| 6-4-85 | obtained | |||||||
| 25 April | P. monodon | 64.0 | p.m. 10 | a.m. 3 | 26 x 104 | 14 x 104 | 54 % | Up to mysis stage |
| 26-4-85 | ||||||||
| 26 April | P. monodon | 56.0 | p.m. 10 | a.m. 3.30 | 20 x 104 | 12 x 104 | 60 % | Up to mysis stage |
| 27-4-85 | ||||||||
| 5 April | M. monoceros | 25.0 | p.m. 10 | a.m. 4 | 4.5 x 10⁴ | 2.3 x 10⁴ | 60 % | Up to mysis stage |
| 6-4-85 | ||||||||
| 4 May | M. monoceros | 26.0 | p.m. 11 | a.m. 2 | 5 x 10⁴ | 3.2 x 10⁴ | 64 % | Some post larvae |
| 5-5-85 | obtained | |||||||
| 12 May | M. monoceros | 26.0 | p.m. 11 | a.m. 2.30 | 4.8 x 10⁴ | 2.2 x 10⁴ | 46 % | Up to mysis stage |
P. monodon shrimps were collected as described earlier. Adult size females without developed ovary were used. Each shrimp was placed in a fibre glass aquarium containing 0.5 m3 full strength aerated sea water along with an adult male. Only the females were unilaterally eye-stalk ablated (eye cut with knife and eye-stalk squeezed). The shrimps were fed with a mixture of bivalve (Pinna kraussi) and octopus meat. Wastes from each aquarium were flushed out and three-quarter volume of water was renewed daily. The females were examined against a bright source of light to determine the degree of development of the ovary. Out of fifteen females of P. monodon ablated three spawned between 74 to 86 days after operation (Table 3).
| Carapace | Date | Date of | No.of days | No. of eggs | No. of nauplii | Hatching | Remarks |
|---|---|---|---|---|---|---|---|
| length | ablated | spawning | from ablation | laid | hatched | rate | |
| (mm) | to spawning | (%) | |||||
| 60.0 | 2-4-85 | 15-6-85 | 74 | 9.3 x 10⁴ | 3.9 x 10⁴ | 42 | ) Temperature |
| ) 20 - 21 o C | |||||||
| 59.8 | 2-4-85 | 27-6-85 | 86 | 14 x 104 | 6.5 x 10⁴ | 46 | ) at spawning. ) |
| ) All larvae died | |||||||
| 58.9 | 2-4-85 | 27-6-85 | 86 | 16 x 104 | 8 x 10⁴ | 50 | ) before reaching ) |
| mysis stage |
Larval raring of P. monodon has been described by various authors, principally, Liao et al (1969) and Motoh (1981). A standard seed production can thus be schematically represented as follows:
It is desirable to have a ready supply of phytoplankton species, for example, Skeletonema costatum, Chaetoceros spp. and Tetraselmis spp. together with rotifers (100 to 250 u) to feed the larvae at the zoea and mysis stages. As these organisms are not usually obtainable in large quantities in the wild or in mixed culture situation, a phytoplankton culture room with controlled air temperature, light and aeration facilities is essential for a really successful hatchery production of P. monodon post-larvae.
The present larval rearing trials of P. monodon were carried out without recourse to culture of specific feed organisms as a controlled phytoplankton room was not available during the course of the work. Hence, the authors resorted to the use of 'green water' which included miscellaneous plankton and detritus produced under sunlight in outdoor fertilized brackish water tanks, together with 'Artificial Plankton' (NIPPAI LTD) 1/, which was originally developed for the larval rearing of Penaeus japonicus in Japan.
Larval rearing was carried out indoors in fibre-glass conical tanks of 2 m3 capacity with central aeration. Filtered sea water was used and stocking density varied between 15-20 nauplii per litre of water.
A combination of 'green water' (passed through plankton net of 200 u mesh and artificial plankton (NIPPAI LTD) * was given before metamorphosis from Nauplius to zoea.
Food rations (plankton, shrimp or bivalve meat) were provided in four instalments on a feed upon demand basis, determined by direct observation on the rate of consumption by the larvae.
Though water change is usually not required in larval rearing of penaeid species (Liao and Chao, 1977) it was resorted to here because detritus were observed to accumulate in the rearing tanks.
Out of the eggs obtained from the three spawnings, several larval rearing trials were run. Almost all ended up at the mysis stage. However, only one rearing cycle of a batch of 32,000 eggs spawned on the 5th April 1985, could be carried out to completion, producing for the first time in Mauritius, 400 post larvae. The results of this particular trial are summarised in Table 4.
Development time was approximately the same as described by Motoh 1981, except that the mysis took about seven days instead of 4-5 days to change into the first post-larvae. About 16 days were required to reach P1 post-larvae at a temperature range of 25 to 28.5 C.
| Date | Stage of | Temperature | Salinity | No. | % | Feed provided | Remarks | |
|---|---|---|---|---|---|---|---|---|
| 1985 | larval | (o C) | (%o) | survi- | ||||
| development | 9 am. | 3 pm. | val | |||||
| 5 April | Nauplius | 13,000 | Stocking rate 15 ind/L | |||||
| 6 April | Nauplius | 27.9 | 26.6 | 32 | ||||
| 7 April | Zoea I | 27.1 | 28.0 | 32 | 7,600 | 58.4 | 'Green water' + arti- | 30% water change daily |
| Ficial plankton | ||||||||
| 12 April | Zoea III | 26.5 | 28.3 | 32 | 5,300 | 40.7 | 'Green water' + arti- | 50% water change daily |
| ficial plankton + homo- | ||||||||
| genised shrimp meat | ||||||||
| 13 April | Mysis I | 26.3 | 28.0 | 28 | 3,100 | 23.8 | 'Green water' + arti- | Homogenised shrimp meat |
| ficial plankton + homo- | passed through sieve of | |||||||
| genised shrimp meat | 200 u mesh | |||||||
| 17 April | Mysis III | 27.1 | 28.2 | 28 | 1,800 | 13.8 | 'Green water' + arti- | 70 % water change daily |
| ficial plankton + homo- | ||||||||
| genised shrimp | ||||||||
| 19 April | Mysis III | 25.9 | 27.2 | 27 | 1,200 | 9.2 | 'Green water' + arti- | |
| ficial plankton + homo- | ||||||||
| genised shrimp meat | ||||||||
| 20 April | Post-larva | 26.3 | 27.8 | 27 | 400 | 3.07 | 'Green water' + | 50% water change daily |
| Artemia nauplii | ||||||||
| 22 April | P 3 | 26.0 | 28.0 | 27 | 400 | 3.07 | 'Green water' + | Shrimp and bivalve meat |
| Artemia nauplii | passed through sieve of | |||||||
| shrimp meat | 300 u mesh | |||||||
| 29 April | P 15 | 25.0 | 28.4 | 25 | 400 | 3.07 | Bivalve meat | Shrimp and bivalve meat |
| (Pinna sp.) | passed through sieve of | |||||||
| 300 u mesh | ||||||||
The overall survival was very low. It is the opinion of the authors that nutrition specially at the zoea stage was most inadequate, as planktons present in the green water varied considerably in species. Major improvements will have to be made for provision of the appropriate planktons as from the zoea and mysis stages.
* NIPPON Formula Feed Manufacturing Co., Ltd., 3-9, Moriya-Cho, Yokohama, Japan.
Larval rearing of Metapenaeus monoceros has been described by Liao et al (1969). Eggs spawned from one female on the 4th May 1985 were used. These were stocked at a density of 13 ind./1 in conical tanks and the procedures followed throughout the larval rearing were the same as described under section 3.1. No shrimp meat or artemia nauplii were provided, but feeding rations consisted of 'green water', artificial plankton (NIPPAI LTD) and homogenised mollusc meat (Pinna kraussi).
A complete larval rearing was achieved in one tank only. The results of this particular trial are summarised in Table 5. Larval development usually follows the same pattern as P. monodon, but M. monoceros larvae are markedly smaller (Liao and Huang, 1972). The present work confirms this observation. The first post larvae of M. monoceros measured about 3.5 mm as compared to 5 mm for that of P. monodon.
Development time to the first post-larvae was about 17 days and temperature range during the cycle was between 23 to 28.5 C. Survival was very low and only about one hundred post larvae could be produced.
| Date | Stage of | Temperature | Salinity | No. | % | Feed provided | Remarks | ||
|---|---|---|---|---|---|---|---|---|---|
| larval | c C | % | sur- | ||||||
| development | 7 am. | 3 pm. | vival | ||||||
| 4 May | Nauplius | 27 | 28.5 | 32 | 13,000 | Stocking rate : 13 ind/L | |||
| 7 May | Zoea I | 26.5 | 27.5 | 32 | 8,200 | 63 | 'Green water' + arti- | 30% water changed daily | |
| ficial plankton | |||||||||
| 12 May | Zoea III | 25.6 | 27.0 | 32 | 1,400 | 10.7 | 'Green water' + arti- | 30% water changed daily | |
| ficial plankton | |||||||||
| 13 May | Mysis I | 25.1 | 27.0 | 32 | 1,200 | Mollusc meat | Homogenised and passed | ||
| Pinna kraussi in | through sieve of 200 u | ||||||||
| addition to above | mesh | ||||||||
| 17 May | Mysis III | 26.0 | 26.7 | 30 | 200 | 1.6 | Mollusc meat | " | " |
| Pinna kraussi in | |||||||||
| addition to above | |||||||||
| 19 May | Mysis III | 23.9 | 25.3 | 30 | 180 | 1.3 | Mollusc meat | " | " |
| Pinna kraussi in | |||||||||
| addition to above | |||||||||
| 20 May | Post-larva | 23.0 | 25.0 | 28 | 120 | 0.9 | Mollusc meat | " | " |
| Pinna kraussi in | |||||||||
| addition to above | |||||||||
Culture of marine shrimps, particularly Penaeus monodon is undergoing a rapid expansion because of the increasing world demand, high market price and the success of hatchery techniques (Pullin, 1980). In Taiwan 19,000 tons of Penaeus monodon, a species known for its fastest growth rate among the penaeid shrimps (Liao, 1981), were harvested in 1984 from pond culture. Out of this catch 9,000 tons were exported to Japan.
One of the highest yields recorded so far under intensive culture in Taiwan was 7t/ha/yr. In Indonesia and the Philippines about 2t/ha/yr is normally achieved under semi-intensive situation (Nukiyama, 1980). In general, research is fairly active in most South East Asian countries to achieve better yields from this highly prized species.
In Mauritius, interest in marine shrimp culture is fairly recent. Research work initiated in 1984 is oriented towards providing the basic ground work for the future development of marine shrimp culture. Results obtained so far are encouraging. Among the possible candidate species identified for culture, Penaeus monodon though found to have a very narrow and restricted distribution in Mauritius (Enomoto et al, in preparation) would certainly receive increasing attention.
The initial success obtained in the larval rearing of P. monodon and M. monoceros is a major breakthrough for Mauritius. It serves to demonstrate that with slight improvements such as provision of a facility for pure culture of appropriate plankton species, mass production of post-larvae would be possible on this island.
Although seed of P. latisulcatus and M. monoceros have been found in the wild, post-larvae of P. monodon will have to be produced in the hatchery for the development of shrimp culture. This proposition appears to be a viable one. It would be possible to procure gravid females during summer months not only for spawning in captivity but also to rear a sufficiently large brood stock for induced maturation and breeding. The present work demonstrates the fact that females of P. monodon can be induced to spawn even in the winter months. By careful planning, it would be possible to run larval rearig cycles for extended period during a year.
Such hatchery-based seed production will depend heavily on wild stocks. As there is sufficient evidence to indicate that the population of P. monodon is small and possibly vulnerable to over exploitation (Enomoto et al, in preparation) some form of conservation measures will have to be adopted to protect the species. As it now stands, it is roughly estimated that between 50 to 100 gravid females can be easily obtained during the summer months (October-May). Assuming that each female spawn 300,000 viable eggs, it would be possible to obtain 60,000 post-larvae per female with a survival rate of 20%. Theoretically it would be possible to produce between 3-6 million seed for stocking purposes, assuming again, that all hatchery facilities for larval rearing can be made available.
At the level of production of some 5 million shrimp seed two possibilities of culture will have to be envisaged taking into account the problem of land scarcity on a highly populated island like Mauritius: Intensive and semi-intensive culture. In the first instance, 12.5 ha. of pond area will be required assuming that 2 rearing cycles (4 months each) can be carried out at a stocking density of 20 PL/m2. In the second case 50 ha. of pond area would be necessary assuming again a possibility of carrying out 2 rearing cycles at a stocking density of 5 PL/m2. A yield of 6,000 kg/ha/yr may be expected in the first instance and 1.6 tonnes/ha/yr in the second. Total production would therefore be 75 and 80 tons respectively for the intensive and semi-intensive situation. The high price offered locally for shrimp (Rs. 160/kg) appears to further uphold the economic feasibility of marine shrimp culture.
Land availability close to the sea may not present a serious problem specially for the sizes mentioned earlier. But one of the forseeable constraints that would have to be faced is the low tidal range (50-75 cms) in Mauritius. This would limit the pond area that could be filled in by natural flow (Jehangeer and Chineah, 1983). Water distribution system involving pumps will have to be incorporated in most shrimp farm. Besides, ponds will have to be designed in such a way as to take into account the cyclonic weather in Mauritius. Moreover, it is expected that the cost involved (both capital and operational) will be offset by the attractive price offered both locally and in international markets.
Further research will be needed not only to improve the larval rearing techniques for mass production of marine shrimp seed but also to determine growth, yield and other economic parameters. These data will provide a more realistic assessment of economic feasibility of marine shrimp culture in Mauritius. The next phase of the research programmes of the Ministry of Agriculture, Fisheries and Natural Resources will attempt to meet these problems.
ENOMOTO Y., M.I. JEHANGEER and M. MUNBODH (in preparation). Studies on Culture of Marine Shrimps in Mauritius. I - Notes on Biology and Ecology of local penaeid shrimps
ENOMOTO Y., M.I. JEHANGEER and M. MUNBODH (in preparation). II - Breeding Experiments on Penaeus monodon (Fabricius) and Metapenaeus monoceros (Fabricius).
JEHANGEER, M.I. and V. CHINEAH, 1983. The status of Mariculture in Mauritius. In Proceedings of Seminar on Marine Fisheries Development in Mauritius. 77-94 (Ed. S. BHOOJEDHUR) University of Mauritius. July 18-19 1983.
LIAO, I.C., T.L. HUANG and K. KATSUTANI. 1969. Summary of a preliminary report on artificial propagation of Penaeus monodon (Fabricius). J.C.R.R. Fisheries Series. 8:67-71.
LIAO, I.C., Y.Y. TING and K. KATSUTANI. 1969. A preliminary report on artificial propagation of Metapenaeus monoceros (Fabricius). J.C.R.R. Fisheries Series. 8:72-76.
LIAO, I.C. and T.L. HUANG. 1972. Experiments on the propagation and Culture of prawns in Taiwan. In Coastal Aquaculture in the Indo-Pacific Region. 328-354 (Ed. T.R.V. PILLAY), Fishing News (Books) Ltd., London 497 pp.
LIAO, I.C. and N.H. CHAO. 1977. Problems to be solved for the Culture of Penaeus monodon and Macrobrachium rosenbergii. Harvest Farm Magazine. 27 (23):15-18.
LIAO, I.C. 1981. Status and Problems of grass prawn culture in Taiwan. ROC - Japan Symposium on Mariculture. 1-34.
MOTOH, H. 1981. Studies on the fisheries biology of the giant tiger prawn, Penaeus monodon in the Philippines. Tech. Rep.7. SEAFDEC. 128 pp.
NUKIYAMA, Y. 1980. Report on the grass seed production of Penaeus monodon in the Philippines. JICA Report: 1-85 (in Japanese).
PULLIN, R.S.V. 1980. Aquaculture in Taiwan. ICLARM Newsletter. 3(2):10-12.
PACEK, A.A. 1972. Indo-West Pacific Penaeid prawns of Commercial Importance. In Coastal Aquaculture in the Indo-Pacific Region, 152-172 (Ed. T.V.R. PILLAY). Fishing News (Book) Ltd., London, 497 pp.
by
V. Chineah and V. Chooramun
(ALBION FISHERIES RESEARCH CENTRE, MAURITIUS)
With the successful implantation of the fresh water prawn,* Macrobrachium rosenbergii in Mauritius, in 1972 (Ardill et al, 1973) considerable progress has been made in the development of its aquaculture on a commercial scale. The larval rearing techniques followed have been published (Ardill et al, 1973, Chineah,1980) and are of the semi-open system. However, attempts are being made to refine the existing techniques and design new models.
The present paper describes a closed water circulation system devised and successfully operated for the production of Macrobrachium rosenbergii (de Man) postlarvae. The experiment was conducted at the Camaron Hatchery, Albion Fisheries Research Centre from 15 November 1984 to 25 December 1984.
The closed water circulation system essentially consists of a rearing unit and a biological filter unit. A flow-through diagram of the system is illustrated in Figure 1. The larval rearing unit consisted of one fibreglass cylindrical tank (1m3 capacity) with conical botton (a) a removable P.V.C. pipe (200 mm) provided with three windows (b) made of nylon screen (mesh size 200 u) was connected centrally in the outlet of the tank. Water level was controlled by means of a stand pipe (c).
The biological filter unit (d) was made up of a rectangular plywood box (1 x 0.5 x 0.5 m) internally lined with fibreglass, provided with eight vertical compartments of equal size (e). Except for the two extreme chambers, all were filled with pieces of dried coral (3 cm to 5 cm across). The compartments were constructed in such a way as to allow water to flow through all of them successively before over-flowing through a pipe into the rearing tank as indicated in Fig. 1. An airline was positioned on the floor of each chamber so as to provide aerobic conditions for the nitryfying bacteria to act on the toxic metabolic by-products and to convert them to non-toxic substances. According to Kinne (1976) the area of the filter bed should be equal to or exceed the area of the culture tank and this rule was followed in the present experiment.
A sand filter (g) placed between the two units acts as a mechanical filter, removing suspended matter from the rearing medium. Water was pumped from the collecting chamber of the sand filter to the biological filter by means of an electric pump (k).
Before the system was put into operation the biological filter was activated by seeding with nitrifying bacteria. This was achieved by introducing a solution of ammonium chloride to the filter fifteen days prior to rearing. NH3, concentration was monitored every two days.
Before larvae were stocked, the larval tank, the sand filter and the biological filter were filled with water at a salinity of 12 ppt. Water flow into the rearing tank was adjsted at 40-60 l/minute. Excess flow was routed to the sand filter for recirculation.
When in operation, the pump drew water from the collecting chamber (1) of the sand filter, conveyed it to the biological filter through which it circulated before entering the larval tank. Water in the rearing tank flowed through the filter screen box, entered the overflow pipe, from where it was directed into the sand filter. A nylon bag (h) (mesh size 50u) was attached at the outlet of the rearing tank to hold large size particles. The medium was kept in continuous circulation except when Artemia salina feed was given to prevent Artemia nauplii escaping through the screen and entering the circulation system.
Rearing medium at a salinity of 12 ppt was prepared in a 2m3 cylindrico-conical tank by mixing freshwater drawn from the domestic supply and seawater pumped from the lagoon. Prior to use the medium was strongly agitated for 24 h by bubbling air through it.
The larval rearing tank was stocked with 50,000 one-day old larvae at the rate of 50 individuals/litre of rearing medium.
Two types of feed were given to the larvae:-
When Artemia feed was given the circulation was temporarily stopped for 1 hour thus preventing loss of Artemia through the filter box and allowing maximum number of nauplii accessible to larvae.
Salinity, pH, temperature, ammonia and nitrate were monitored, salinity was measured by means of a portable A/O refractometer [1] and pH by the La Motte pH Meter [2] and pH daily at 9.00 h.
Temperature was taken twice daily at 8.00 h and 15.00 h. Ammonia and nitrate concentrations were determined using a La Motte spectrophotometer every two days.
The larval stage index (L.S.I.), and stomach fullness of larvae were determined daily by examining about 50 larvae under the microscope. Observations were also made on general health of the larvae.
To collect postlarvae from the rearing tank, the pump was stopped, and aeration removed. A centrifugal force was given to the water by hand thereby causing larvae to rise to the surface. Larvae were removed by means of a closed mesh net and postlarvae attached to the surface of the tank were collected by emptying in a collector (fig. 1b).
The average temperature prevailing during the experiment was 28.8 o C (minimum 27 o C and maximum 31.0 o C). The temperature variation over a period of 24 h was 1.0 o C.
The pH varied between 7.7 and 8.0. Due to evaporation the salinity increased from 12 ppt to 15 ppt within 7 days. Freshwater was, therefore added to bring back the salinity to its initial level.
The evolution of nitrate levels is depicted in figure 3. The concentrations varied between 0.004 and 0.04 ppm.
The maximum concentration of ammonia recorded was 1.40 ppm on the 23rd day of rearing. The average concentration was 0.75 ppm. The variation of ammonia levels is shown in figure 4.
The initial stocking density was 50 larvae/litre of rearing medium. The density was observed to decrease gradually to reach 41 larvae/litre on the 23rd day of rearing (figure 5). However, on the 24th day of rearing, due to a technical error, nearly 50% of larvae were lost. In the late afternoon on that day, after switching on the pump to recirculate the medium, the outlet of the larval tank was accidentally kept closed. Water entering the tank from the filter unit, overflowed out, carrying with it larvae. Larvae was lost through death by getting themselves caught under the P.V.C. screen box and mechanical damage caused by the sharp end of that box.
The L.S.I. obtained during the present experiment showed that growth of larvae was normal as illustrated in figure 6. The stomach was found to be 85% full. Some larvae showed broken appendages due to mechanical damages caused by the sharp rim of the filter box.
The larval rearing cycle was completed in 40 days. A total production of 15,430 postlarvae was obtained.
[1] American optical, Scientific Instrument Division, Buffalo N.Y. W215
[2] La Motte chemical, Chestertown Maryland, 21620
Efficiency of the closed water culture system depends chiefly on the production rate of metabolic waste products (ammonia, amino acids, protein) and the conversion rate of these substances to nitrite and nitrate.
Ammonia in a closed system is mainly produced by metabolic by products and decaying organic matter.
Aquacop (1977b) reports that a concentration of 1.7 ppm of ammonia had no specific stress on larvae. In the present experiment, the maximum level recorded was 1.4 ppm on the 30th day of rearing, a figure lower than that obtained by Aquacop.
A maximum concentration of 0.04 ppm nitrite was monitored. Armstrong (1976) experimenting with 14-day old larvae found the Lc 50 for 24 h to be 70 ppm. Hence, the level obtained was far below the sub-lethal dose.
Low temperature (25 o C), high oxygen saturation and pH between 8.1 and 9.4 greatly enhance the nitrifying capability of Nitrobacter (Kinne, 1976). In the experiment, the pH was found to vary between 7.8 and 8.0, being values near the optimum. The medium was continuously aerated by bubbling air through it, thus maintaining high dissolved oxygen level. However, the temperature was high (average 28 o C).
The levels of ammonia and nitrite being below the toxic level, growth was found to progress satisfactorily and larvae were feeding well. The first postlarvae was observed on the 40th day with a total production of 15430 postlarvae. Production would have been better had not 50% of larvae been lost through the technical errors mentioned earlier.
The flat bottom and the sharp rim of the filter box have to be modified to prevent trapping out larvae and injury caused to them.
This preliminary study has demonstrated that Macrobrachium rosenbergii larvae can be successfully reared using the closed water circulation system. Advantages offered by this system over the "green water" or the "clear water" techniques are numerous for example, no water change, no phytoplankton preparation and no use of antibiotics are required. Economy in labour, energy and water is also achieved.
Armstrong, D.A. 1976. Toxicity of nitrite to larvae of the giant prawn Macrobrachium rosenbergii. Aquaculture 9: 39-46.
Aquacop, 1977 b. Macrobrachium rosenbergii (de Man) Culture in Polynesia: water chimodynamism in an intensive larval rearing in clear water. Eight Workshop of World Mariculture Society, Costa Rica 10-13. January, 1977.
Ardill, J.D., R. Jenson, B. Jugnarain and R.K. Thompson, 1973. The introduction of the fresh water prawn, Macrobrachium rosenbergii (de Man), in Mauritius. Revue agricule et sucriere de l'Ile Maurice 52: 6-11.
Chineah, V. 1980. Recent innovations in the larval rearing techniques of Macrobrachium rosenbergii (de Man) in Mauritius. Selected papers presented at 'Giant Prawn 1980'. An international conference on freshwater prawn farming in Bangkok, Thailand, June 15-21, 1980. Developments in Aquaculture and fisheries and science Edi. Michel B. New pp. 123-127.
Kinne, O., 1976 (b). Cultivation of marine organisms. Water quality management and technology. In Marine Ecology, III, edited by O. Kinne, Wiley, London, 19-300.
Figure 1. Flow-through diagram of the closed water circulation system
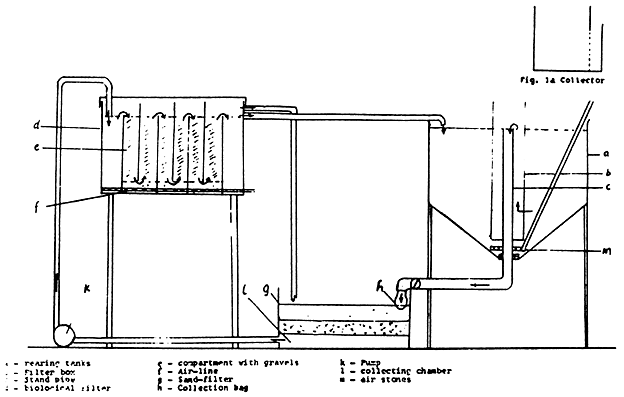
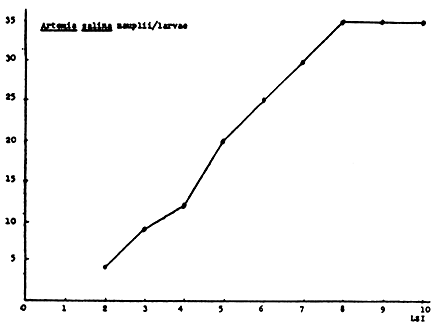
Fig. 2 Artemia salina nauplii distribution/larvae in relation to LSI
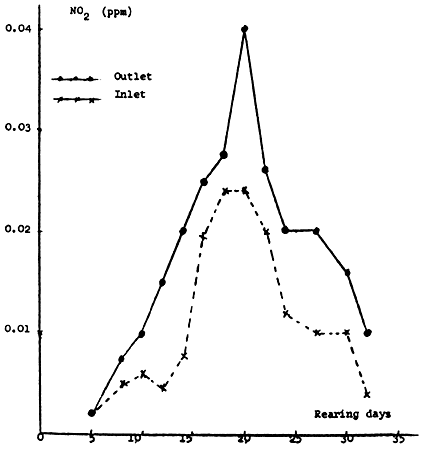
Fig. 3 - Evolution of NO2 levels at the inlet and outlet of the rearing tank.
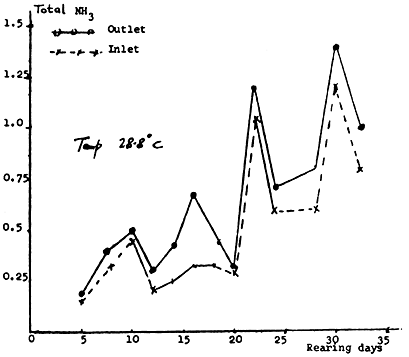
Fig. 4 Evolution of ammonia concentrations at the inlet and outlet of the rearing tank
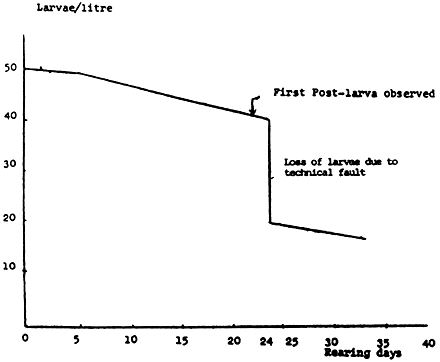
Fig. 5 Larval survival during the experiment
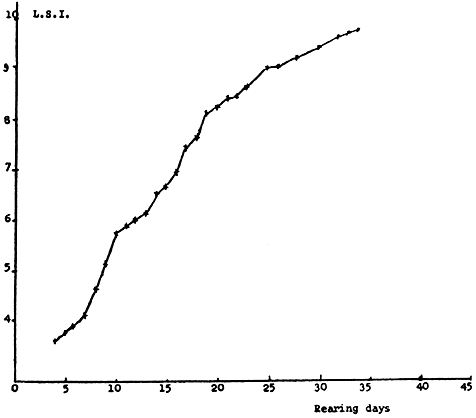
FIGURE 6: Larval stage development during the experiment
by
Chineah, V., Ramcharran, B. and Chooramun, V.
(ALBION FISHERIES RESEARCH CENTRE, MAURITIUS)
The 'clear' and the 'green' water larval rearing techniques were found to be reliable and economically viable for the mass production of Macrobrachium rosenbergii post larvae. Neglecting management and fixed costs, the present experiments show that there was no significant difference in the production cost of post larvae utilizing either technique. Both techniques have operational advantages and disadvantages which are duscussed.
The breakthrough in rearing the larvae of the giant freshwater prawn, Macrobrachium rosenbergii (de Man) through metamorphosis by Ling and Merican (1961) and Ling (1962) generated tremendous interest among aquaculturists in many countries of the world to investigate the aquaculture of this species. Fujimura (1966), and Fujimura and Okamoto (1970) were the fist to accomplish successfully the mass production of post larvae on a commercial scale by using "green water" as the rearing medium. Over a span of fifteen years, hatchery engineering and techniques of larval rearing have undergone remarkable improvements, resulting in high survival rate. Aquacop (1977 a, 1977 b) successfully developed and standardized a new technique of post larval production using "clear water". The "green water" and/or the "clear water" techniques are still prevalent in many hatcheries of the world. The former technique makes use of rectangular tanks of large volumes 3-8 m3 with larvae stocked at low densities (10-40/l of rearing medium) whilst the latter utilizes cylindrico-conical tanks of smaller capacity (max. 2000 l) with larvae stocked at higher densities (100/l of rearing medium). With the successful implantation of the freshwater prawn in Mauritius (Ardill et al. 1973) its aquaculture has rapidy expanded and reached the commercial stage with an annual production of 25 tons (M. Mundbodh, personal communication) of marketable size prawns.
Larval rearing the "green water" technique started in 1972 at the prototype Government-Camaron Hatchery situated at Trou d'Eau Douce. A permanent concrete building was constructed in 1973 (Ardill et al., 1975). The infrastructure and larval rearing techniques were further improved for the mass-production of post larvae (Chineah, 1980). Figure 1 shows the layout of the hatchery after modification. In November 1978 the "clear water" technique was successfully attempted giving encouraging results. Since then, in addition to the conventional "green water" technique larvae are reared by this new technique.
The personnel of the hatchery were composed of a Scientific Officer, two Technical Officers, six Nurserymen and two Watchmen. The scientific and technical staff were responsible for the running of the hatchery. They perform the task of planning, supervision, procurement of materials, administrative and technical work.
Nurserymen being the labour force, executed instructions given to them by the technical staff and were responsible for the daily routine manual work preparation of feed, feeding, preparation and renewal of medium, cleaning of tanks, etc. With the construction of the Albion Fisheries Research Centre in 1982, the hatchery ceased its activities and was permanently transferred to above Research Centre.
Facilities available at the Trou d'Eau Douce Camaron Hatchery had permitted the rearing of larvae by both techniques, thus offering the possibility to undertake a comparative study.
This paper reports on the experiments carried out from December, 1980 to December, 1981 to evaluate the relative merits and economics of the two rearing methods.
Berried females with grey and yellow eggs were seined from the Government-owned broodstock ponds situated at Pamplemousses and Curepipe. They were immediately transported with aeration to the hatchery in 500-l wooden tanks with fibreglass lining. Females with grey eggs were transferred to hatching tank with water at a salinity of 5 ppt, the salinity being gradually increased to 15 ppt within 24 hours. Females with orange eggs were kept in fresh water awaiting maturation prior to being transferred to hatching tanks. In order to stock all tanks for a cycle, 1 million larvae were needed, and being given that one hundred 25 gm females would release 500,000 larvae, 250 gravid females were brought to the hatchery. Larvae hatched out were collected, estimated and stocked in larval rearing tanks.
The Trou d'Eau Douce Camaron Hatchery had a floor space of 200m. The hatchery had five rectangular concrete tanks (3m ) coated with poly-urethane varnish and painted dark green, these being used for the rearing of larvae in "green water". At the end of 1978 with the introduction of the "clear water" technique, two fibreglass cylindrical tanks (500-l capacity each) with conical bottoms were installed, followed by four additional ones (1000-l capacity each) in 1980. To conduct the experiments, two "green water" and two "clear water" tanks were used.
Freshwater phytoplankton culture was produced in outdoor tanks (Fig. 1). Algal bloom was maintained by the addition of Tilapia spp. or by the use of inorganic fertilizers. "Green water" for culture purposes was prepared by pumping part of the algal bloom in an adjacent tank to which was gradually added filtered sea water till a salinity of 15 ppt was obtained in 3 days. The prepared medium was introduced in the rearing system. "Green water" larval tanks were stocked at a density of 33 larvae/litre of medium. The "green water" medium was renewed twice weekly.
Freshwater was pumped from a nearby spring directly into outdoor mixing tanks and filtered aged seawater was added to bring the salinity to 12 ppt. The medium was made homogeneous by vigorous aeration and was introduced in the "clear water" rearing system in the late afternoon of the same day for flushing and filling. "Clear water" larval tanks were stocked at a density of 100 larvae/litre of rearing medium. The rearing medium was changed completely daily. Antibiotics in the form of Bipenicillin-dihydrostreptomycin, chloramphenicol or oxytetracycline were administered to the tanks at a concentration of 2 ppm. on alternate days.
Two types of food were given to the larvae:
(i) Live food - |
Freshly hatched Artemia salina nauplii at the | |
| rate of 5-15 nauplii/ml of rearing medium in | ||
| the "clear water" and 3-7 nauplii/ml in the | ||
| "green water" tanks. | ||
(ii) Inert food - |
Sieved bonito flesh, grated bonito and grated | |
| skinned octopus were used in the "clear water" | ||
| system. Only sieved bonito was used in the | ||
| "green water" tanks. |
Artemia nauplii were fed twice daily at 0800h and 1500h. A feed-on-demand principle was followed for inert food - dependent on the actual food consumption, inert food was adjusted accordingly. When an estimated number (around 10,000) of postlarvae appeared in a tank usually at the end of the fourth week from the first day of stocking, they were separated and counted individually. They were then transferred to post larval tanks where the salinity was dropped to 0 within 48 hours prior to be transferred to grow-out ponds.
Record of physico-chemical parameters:
The following physico-chemical parameters were recorded from all larval rearing tanks -
(*) La Motte Chemical, Chestertown, Maryland 21620, U.S.A.
(**) Yellow Springs Instruments Co., Yellow Spring, Ohio 45387, U.S.A.
The mean temperature variation in either technique over a period of 24 hrs was 2.5oC. However, the temperature recorded in the "clear water" tanks was always higher by 0.5oC. The "green water" tanks with more exposed surface lost temperature faster, and gained temperature at a a slower rate because of the large water volumes.
The "clear water" rearing system shows a decrease in pH over 24 hrs from 8.0 to 7.7 which was due to excessive feeding. The pH in the "green water" tanks, however, increased from 8.0 to 9.3 between two water changes due to consumption of mineralised metabolites (NH3, etc.) by phytoplankton present in the "green water", and thereby conditioning the medium.
During the course of the experiments, the dissolved oxygen varied between 7.5 and 8.1 ppm.
The NH3-N levels determined in the "clear water" tanks showed values higher than those found in the "green water" tanks. Accumulation of ammonia was mainly due to the absence of metabolizing agents in the "clear water" system to absorb it. In the "green water" tanks, phytoplankton metabolised ammonia (Manzi et al., 1976), keeping the ammonia concentration to a low level. Wickins (1876) indicates for M. rosenbergii juveniles a significant decrease of growth, after six weeks, for NH3-N levels above 0.10 ppm. Aquacop (1977b) observed no specific larval stress in "clear water" rearing experiments at NH3-N concentrations from 0.07 to 0.18 ppm. In the present experiments the maximum NH3-N level in the "clear water"tanks was 0.15 ppm, a value lower than that obtained by Aquacop. Figure 2 depicts the comparative levels of NH3-N recorded before water renewal of medium for the two techniques.
"Clear water" - tanks lend themselves to very easy determination of larval density at any time. With their cylindroco-conical configuration and central aeration, larvae are uniformly dispersed. By taking on 1-litre samples at four different locations in the tank, a good estimation of larval density is obtained. Population estimations in "clear water" tanks indicate a gradual decline in larval density from 1st day of stocking to the 20th days when the population stabilized at 65% of the number of larvae initially stocked (fig. 3).
However, after metamorphosis, the survival dropped to 52%. The cause of this discrepancy could be attributed to the cannibalistic nature of the larvae - freshly metapmorphosed post larvae without defence, being preyed upon by non-metamorphosing larvae and by older post larvae.
Aeration in the "green water" rectangular tanks is not uniform and larvae were irregularly dispersed, thus rending estimation of larval density complicated. Although samples could be taken at different regions of the tank, reliable estimation of larvel density could not be obtained. Only by counting the number of post larvae produced at the end of a cycle could the overall survival rate by computed. A mean survival of 42.1% was obtained. Details of the experiments are shown in table 2 and table 3.
Larval development shows similar trends in both techniques. Larvae grew at a rather faster rate in the "clear water" tanks attaining a L.S.I. of 9.3 in 30 days compared to a lower L.S.I. of 9.0 by larvae reared in "green water". One of the factors for the difference in growth rate could be the higher temperatures prevailing in the "clear water" tanks. Figure 4 illustrates the comparative growth rates of larvae reared in the two techniques.
Through the four experiments the two "clear water" tanks (1000-l capacity each) yielded a total of 418,000 post-larvae compared to 330,000 post-larvae obtained from the two "green water" concrete rectangular tanks (3,000-l capacity each). Production rate of post-larvae in the "clear water" technique is decidedly higher - 52 post-larvae/litre compared to 14 post-larvae per litre in the "green water" technique. (Table 2 and Table 3).
Three nurserymen could manage on the same day up to 5 rearing tanks in either technique. The labour would be the same for 0.5 or 2m3 conical tanks and also for 3m3 rectangular tanks. Compared to the "green water" technique the "clear water" technique consumed 20 more man-hours per week. Each experiment was run for a mean of seven weeks. A breakdown of labour used weekly and total labour involved during the four experiments is given in table 4.
The total volumes of water pumped and energy consumed through pumping during the four experiments are shown in table 5. Compared to the "clear water" technique, the "green water" method made use of an additional 80 m 3 of water equivalent to 60 kWh.
Table 6 illustrates the quantity and cost of input (feed, labour and energy) involved in each technique during the four experiments. An additional cost of Rs 7,266 was incurred for the "clear water" technique. However, this technique produced 88,000 post-larvae more.
The cost of production of 100,000 post-larvae by either technique was found to show no significant difference (table 7).
Exclusive of management and fixed costs (depreciation of building and equipment, insurance, etc.) the experiments showed that there was no significant difference in the production cost of a fixed number of post-larvae by both techniques.
In the four rearing cycles, the difference in the cost of feed was Rs 4,000 in favour of the "green water" technique. Feeding in the "green water" technique had the advantage in that octopus, the preparation of which is time-consuming, was not used. An additional advantage was that no antibiotics, an item indispensable for high survival in the "clear water" system, was utilized.
An additional 60 kWh of energy was used in the "green water" system, representing an amount of Rs. 90 a negligible figure (table 5).
In the course of the four experiments, due to the daily renewal of medium, the "clear water" technique consumed 560 man-hours more. The advantage of the "green water" technique is that the medium was changed twice weekly.
Using cylindrico-conical tanks of small volume (lm3) in the "clear water" technique made it easier for tank management. The "clear water" medium allows in situ observation of larval behaviour, control of feeding and feeding activity of larvae, easy detection of any mortality and appropriate remedial action and estimation of larval density possible at any time.
The disadvantage with the use of the "green water" technique was that a phytoplankton culture must be maintained and continuously monitored, though the "green water" medium was renewed twice weekly. During heavy rainfall or high temperatures of about 30oC, control of phytoplankton culture cold not be maintained, thus rendering preparation of "green water" difficult. The "clear water" technique operates without phytoplankton.
The "green water" technique is advantageous in that the level of NH3-N did not attain high values as observed in the "clear water" technique (fig. 2). Failure to renew daily the "clear water" medium would occasion larval stress and mortality due to ammonia toxicity.
The experiments show that the "clear water" and the "green water" techniques are equally feasible for the mass production of post-larvae. Both have their own merits and disadvantages. However, the "clear water" technique is more reliable as it involves working with only one system whereas the "green water" technique involves two systems, one for phytoplankton and one for larvae.
The authors thank Mr. Munbodh, Acting Divisional Scientific Officer for having painstakingly gone through the manuscript and made valuable criticism.
Aquacop, 1977 a. Macrobrachium rosenbergii (de Man) in Polynesia: progress in developing a mass intensive larval rearing in clear waters. Eighth Workshop of World Mariculture Society, Costa Rica, 10-13 January 1977.
Aquacop, 1977 a. Macrobrachium rosenbergii (de Man) Culture in Polynesia; water chemodynamism in an intensive larval rearing in clear water. Eighth Workshop of World Mariculture Society, Costa Rica, 10-13 January, 1977.
Aquacop, 1977 b. Production de masse de post larvae de Macrobrachium rosenbergii (de Man) en milieu tropical: unité pilote. Third meeting of the I.C.E.S. Working group on Mariculture, Brest, France, 10-13 May 1977, Acte de Colloque du CNEXO, 4: 213-232.
Ardill, J.D., and R.K. Thompson 1975. The freshwater prawn, Macrobrachium rosenbergii, IN MAURITIUS. FAO/CIFA Symposium on Aquaculture in Africa, Accra, Ghana, CIFA/75/SE4. 14p.
Chineah, V., 1980. Recent innovations in the larval rearing techniques of Macrobrachium rosenbergii (de Man) in Mauritius. Selected papers presented at "Giant Prawn 1980", an international conference on freshwater prawn farming in Bangkok, Thailand, June 15-21, 1980. Developments in Aquaculture and Fisheries Science, 10 Edited Michel B. New. pp: 123-127.
Fujimura, T. 1966. Note on the development of a practical mass culture technique of the giant prawn, Macrobrachium rosenbergii. Proc. Indo. Pacif. Fish. Coun. Honolulu, 12: 4p.
Fujimura, T. and H. Okamoto, 1970. Notes on progress in developing a mass culture technique for Macrobrachium rosenbergii in Hawaii. I.P.F.C. 14th Session, Bangkok, Thailand 18th-27th November 1970.
Ling, S.W., 1967. General biology of Macrobrachium rosenbergii. Proc. World Scientific Conference on Biology and Culture of Shrimps and Prawns, F.A.O. Fisheries Reports No. 57 Vol. 3, Mexico City 12-21 June 1967.
Ling, S.W. and Merican, A.B.O., 1961. Notes on the life habits of the adults and larval stages of Macrobrachium rosenbergii (de Man). IPFC Proc., 9 (2): 5561.
Manzi, J.J., M.B. Maddox and P.A. Sandifer, 1976. Algal supplement enhancement of Macrobrachium rosenbergii (de Man) larviculture. Proceedings of the 7th Annual Workshop World Mariculture Society.
Wickins, J.F. 1976. The tolerance of warm-water prawns to recirculated water. Aquaculture, 9:19-37.
| t°C at 8 h | t°C at 14 h | ||||||||
|---|---|---|---|---|---|---|---|---|---|
| Experi- | Techniques | Min. | Max. | Mean | Min. | Max. | Mean | Mean | t°C Differ- |
| ment | °C | ence with | |||||||
| no. | over | respect to | |||||||
| 24 h | "green water" | ||||||||
| system | |||||||||
| clear water | 27.0 | 28.2 | 27.6 | 29.5 | 31.0 | 30.2 | 28.9 | ||
1 |
0.3 | ||||||||
| green water | 26.5 | 28.1 | 27.3 | 29.1 | 31.0 | 30.0 | 28.6 | ||
| clear water | 24.5 | 26.3 | 25.4 | 27.6 | 28.7 | 28.2 | 26.8 | ||
4 |
0.5 | ||||||||
| green water | 24.0 | 26.1 | 25.0 | 27.1 | 28.8 | 27.5 | 26.3 | ||
| Date started | 8-12-80 |
27-1-81 |
9-4-81 |
5-10-81 |
| Date terminated | 29-12-81 |
27-3-81 |
15-6-81 |
18-12-81 |
| Experiment no. | 1 |
2 |
3 |
4 |
| Duration of hatching (days) | 12 |
8 |
9 |
12 |
| Average temperature °C | 28.6 |
27.3 |
28.1 |
26.3 |
| No. of tanks and volume | 2 x 3 m3 |
2 x 3 m3 |
2 x 3 m3 |
2 x 3 m3 |
| Stocking density | ||||
| larvae/litre | 30 |
35 |
35 |
33 |
| No. of larvae stocked | 180,000 |
210,000 |
210,00 |
198,000 |
| Density at occurrence of | ||||
| post-larvae | - |
- |
- |
- |
| No. of post-larvae | ||||
| produced/ litre | 12 |
15 |
14 |
14 |
| Survival rate of post- | ||||
| larvae % | 40 |
44.4 |
40 |
42.4 |
| Artemia cyst (kg) | 2.3 |
2.5 |
2.5 |
2.4 |
| Frozen bonito (kg) | 56 |
56.3 |
51.6 |
59.3 |
| Post larval production | 72,000 |
90,000 |
84,000 |
84,000 |
| Post larval production/ | ||||
| Tank | 36,000 |
45,000 |
42,000 |
42,000 |
| Rearing days | 52 |
49 |
58 |
54 |
| Volume of prepared | ||||
| medium (m 3) | 140 |
152 |
152 |
152 |
| Experiment no. | 1 |
2 |
3 |
4 |
| Date started | 8.12.80 |
27.1.81 |
9.4.81 |
5.10.81 |
| Date terminated | 29. 1.81 |
27.3.81 |
15.6.81 |
18.12.81 |
| Duration of hatching | ||||
| (days) | 12 |
8 |
9 |
14 |
| Average temperature °C | 28.9 |
28.0 |
28.8 |
26.8 |
| No. of tanks and | ||||
| volume | 2 x 1 m3 |
2 x 1 m3 |
2 x 1 m3 |
2 x 1 m3 |
| Stocking density | ||||
| larvae/ litre | 100 |
100 |
100 |
100 |
| No. of larvae stocked | 200,000 |
200,000 |
200,000 |
200,000 |
| Density at occurrence | ||||
| of 1st post-larvae | ||||
| (larvae/ litre) | 65 |
68 |
67 |
70 |
| No. of post-larvae | ||||
| produced / litre | 45 |
52 |
48 |
54 |
| Survival rate | 45 |
52 |
48 |
54 |
| Artemia cyst (kg) | 3.2 |
3.2 |
3.4 |
3.5 |
| Frozen bonito (kg) | 15.0 |
17.5 |
15.0 |
18.0 |
| Frozen octopus (kg) | 25.0 |
28.0 |
27.0 |
30.0 |
| Post-larval production | 90,000 |
104,000 |
96,000 |
128,000 |
| Post-larval | ||||
| production/ tank | 45,000 |
52,000 |
48,000 |
54,000 |
| Rearing days | 46 |
48 |
50 |
55 |
| Antibiotics used (g) | 225 |
225 |
230 |
230 |
| Volume of prepared | ||||
| medium (m 3) | 184 |
192 |
220 |
200 |
| Types of operations | "Clear water" (man-hour) |
"Green water" (man-hour) |
|---|---|---|
(man-hour) |
(man-hour) |
|
| Feed preparation and feeding | 21 |
21 |
| Preparation of medium | 14 |
7 |
| Maintenance of phyto-plankton | ||
| culture | - |
10 |
| Siphoning of tanks | - |
7 |
| Water renewal | 42 |
12 |
| Cleaning of tanks | 7 |
7 |
| Other activities | 7 |
7 |
| Total (weekly) | 91 |
71 |
| Total for the four experiments | 2548 |
1988 |
| "Clear water" | "Green water" | |
|---|---|---|
| technique | technique | |
| Volumes of water pumped (m 3) | 796 |
596 |
| Volumes pumped for maintenance | ||
| of phyto-plankton culture | - |
280 |
| Total | 796 |
876 |
| Energy consumed (kWh) | 597 |
657 |
| "Clear water" | "Green water" | |||
|---|---|---|---|---|
| Total post-larvae produced | 418,000 |
Cost |
330,000 |
Cost |
(Rs) |
(Rs) |
|||
| Labour (man-hour) *1 | 2,548 |
15,288 |
1,988 |
11,928 |
| Energy consumed (kWh) *2 | 597 |
895 |
657 |
985 |
| Artemia cysts (kg) *3 | 13.3 |
13,300 |
9.7 |
9,700 |
| Bonito (kg) *4 | 65.5 |
1,310 |
223.2 |
4,464 |
| Octopus (kg) *5 | 110 |
2,640 |
- |
- |
| Antibiotics (g) *6 | 910 |
910 |
- |
- |
-------- |
-------- |
|||
Total |
34,343 |
27,077 |
* 1 Labour at Rs 6/ man-hour
* 2 Energy at Rs 1.50/ kWh
* 3 Artemia cysts at Rs 1000/ kg
* 4 Bonito at Rs 20/ kg
* 5 Octopus at Rs 24/ kg
* 6 Antibiotics at Rs 1000/ kg
| "Clear water" | "Green water" | |
|---|---|---|
| technique | Technique | |
| Post larval production | 418,000 |
330,000 |
| Production cost (Rs) | 34,343 |
27,077 |
| Production cost for | ||
| 100,000 post-larvae (Rs) | 8,216 |
8,205 |
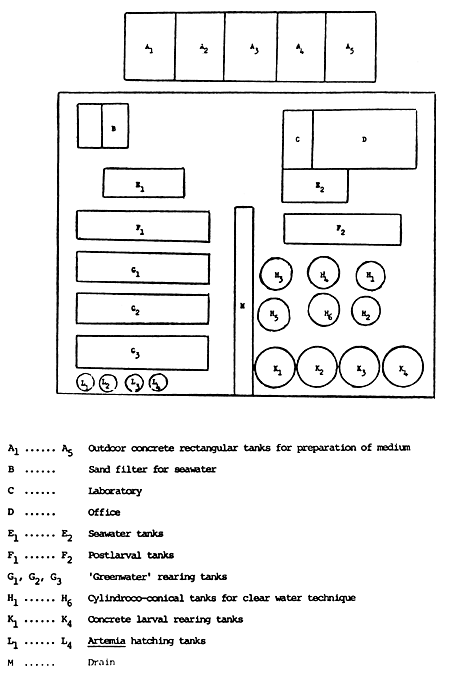
FIGURE 1: LAYOUT OF THE CAMARON HATCHERY, TROU D'EAU DOUCE
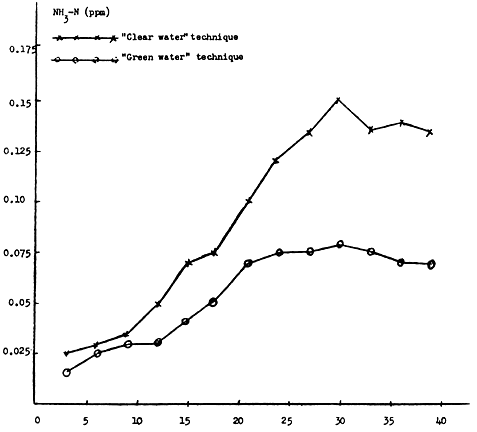
FIGURE 2: BUILT-UP OF NH3 - N IN THE CLEAR WATER TANK H5 AND GREEN WATER TANK Gn DURING EXPERIMENT 1.
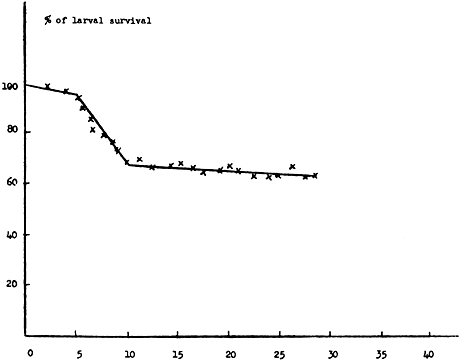
FIGURE 3: SURVIVAL RATE OF LARVAE OBSERVED FOR THE CLEARWATER TECHNIQUE IN TANK H5 DURING EXPERIMENT 1.
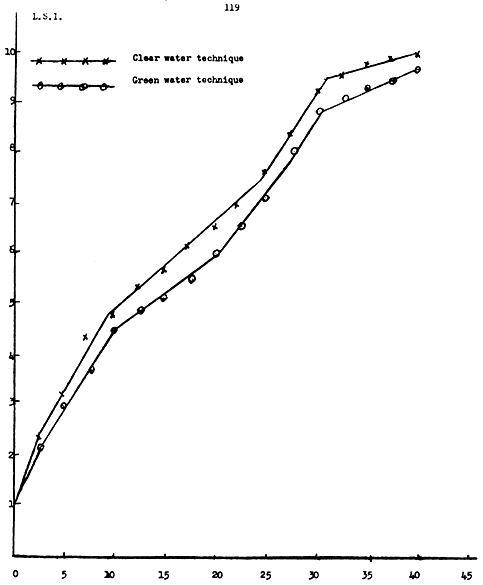
FIGURE 4: COMPARISON OF LARVAL DEVELOPMENT FROM THE CLEARWATER TANK H5 AND GREEN WATER TANK G1 DURING EXPERIMENT 1.
by
R.K. Thompson* and J-M Huron**
Since 1974 the private sector in Mauritius has invested in the development of freshwater prawn, or "camaron" aquaculture. Considerable progress has been achieved towards industrialization, particularly in the last five years.
The central hatchery can produce 4-6 million (M) juveniles per year. Predictable and stable supplies are achieved yearly with production paced to meet the local market demand of 2.3M juveniles per year; over the last nine years nearly 20M juveniles have been produced. Exportation of juveniles to the African region has been successful.
There are approximately 17 hectares of ponds in commercial production in 11 prawn farms located island-wide. All adult prawns are sold on the local market and the total yearly production has steadily increased from 2 to 25 tonnes between 1977-84. Prawn culture can be economically viable in Mauritius, the technology exists, but yields per hectare are directly related to the quality of biological management.
In 1981-82 a local market survey indicated the demand for freshwater prawns to be greater than 100 tonnes per year. Export markets also exists in nearby countries.
Now under construction at Le Vallon on the East coast is a centralized prawn farm of nearly 20 hectares of grow-out ponds. Realization of this project will produce an additional 50-63 tonnes of prawns per year, bringing the island-wide total to approximately 100 tonnes. Utilization of 2.8M juveniles per year by this farm will improve the viability of the prawn industry generally, because the central hatchery will operate at near its maximum efficiency, reducing juvenile unit costs in consequence. Several existing prawn farms are also planning to expand, further contributing to the industrialization of freshwater prawn aquaculture in Mauritius.
The freshwater prawn, Macrobrachium rosenbergii, locally known as "camaron" was first introduced into Mauritius in 1971. Results of this introduction and pilot-project phase in Mauritius have been published (Ardill et al., 1973; Ardill and Thompson, 1975). Since 1974, the private sector has invested in the commercial rearing of freshwater prawns, and the status of this industry was reviewed by Thompson (1979). The commercial hatchery has been described in detail 1 (Thompson, 1980, 1982).
At present, the private sector has a central hatchery, Camarons Hatchery Co. Ltd., 11 commercial prawn farms located island-wide, and a newly formed sister company, Camaron Production Co. Ltd., which is now having a 20 ha centralized farm constructed at Le Vallon on the East coast (Fig. 1). Approximately 16 of the major sugar estates are shareholders in both companies.
(* Camaron Production Co. Ltd., Le Vallon, c/o Ferney S.E., Grand-Port)
(** Camarons Hatchery Co. Ltd., Mon Tresor Mon Desert S.E.,Union Vale)
This paper reviews the progress made in the freshwater prawn industry in Mauritius in the past five years (1980-85) and indicates its present status and future prospects.
The CAMARONS HATCHERY CO. LTD. is situated at Mon Tresor Mon Desert Sugar Estate on the south coast of Mauritius (Fig. 1). Juveniles are produced using the "green-water" (mixed species phytoplankton), semi-static rearing system developed originally in Hawaii (Fujimura, 1974). The methods utilized to rear larvae in the central hatchery have been previously described by Thompson (1980, 1982).
The "green-water" system has proved satisfactory for production of juveniles and the method is tolerant of variations in larval tank management without significantly affecting production levels. Antibiotics are not routinely used, but may be utilized when disease is diagonosed in the larval population. Predictable and repeatable results are routinely achieved, and 4 to 6 million juveniles can be produced annually with the present infrastructure of the hatchery.
Minor changes have been made in the hatchery since 1979. Windows have been placed on the south side of the hatchery to improve the illumination of some tanks so that these can be used for larval rearing during the summer months between November and March. Previously, due to low illumination, these tanks could only be used for holding juveniles and broodstock. The water distribution circuit within the hatchery has been modified to simplify routine operations. Plans exist to install a new freshwater line to ensure optimum quality of water throughout the year; during an extended dry season the present freshwater well becomes saline.
Emphasis has also been placed on establishment of routine sanitation procedures and maintenance of broodstock.
Routine sanitation at all levels of hatchery operation has proved to be essential to assure successful juvenile production. It is very difficult to have complete control over the entire environment since the hatchery is an open system, e.g. open-air phytoplankton culture tanks are on the roof of the hatchery. However, precautions are taken to ensure that cleanliness is maintained within the larval tanks and inside the hatchery. Disinfectant foot-baths have been placed at the hatchery doors to prevent entry of pathogens on footwear. Screens have been placed on all windows to prevent birds from entering. In the past, bird droppings in the larval tanks, and nests in the hatchery were probable sources of disease.
The location of the air inlet pipe for the air blowers has been changed. This pipe, fitted with a fine mesh filter, is now placed above the roof of the building housing the blowers. This minimises entry of dirt and diesel fumes into the air-line system.
The hatchery is also dried out completely for two months during the winter season, when repairs and building maintenance are done. A thorough disinfection of the building and all equipment, including of the interiors of plastic pipes (PVC) used for water and air distribution, is done before the beginning of each rearing season.
The number of eggs carried by females is directly related to their weight/size. Females greater than 15 cm in body length (eye orbit to tip of telson) may carry more than 120,000 eggs (Goorah and Parameswaran, 1983). We have noted that larger females tend to hatch more vigorous larvae whose larval cysle is shorter and who have better survival rate to the juvenile stage.
For efficient operation of the hatchery it is important to have adequate numbers of berried females of the same egg stage to stock larval tanks at the optimum density, and to have simultaneous hatching within 2 to 3 days. The larger the females the easier it is to coordinate the stocking of tanks with larvae, and fewer numbers of broodstock need to be handled.
Previously, berried females varying in length from 8 to 15 cm (average 10-12 cm) were collected during commercial harvests on prawn farms around the island. The hatchery often experienced delays in restocking larval tanks because sufficient berried females were not available. However, for the last two years special broodstock holding ponds have been used to supply adequate numbers of large berried females (greater than 15 cm in length) to the hatchery throughout the larval rearing season, which extends from August to May.
The two broodstock ponds are harvested once every month during the rearing season. Berried females are collected, brought to the hatchery for hatching, and returned to the ponds afterwards. At the end of each rearing season large prawns are collected from commercial ponds as replacements for broodstock pond losses, to ensure that enough large prawns are available at the beginning of the next rearing season.
The yearly production of juveniles from 1977 to date, plus predicted production for 1985 are shown in Figure 2. Juvenile production reached nearly 4 million (M) in 1979. After 1979, production was paced to meet the local market demand of only 2.1 M juveniles per year, excluding exports which first began in 1980. Every year there is an excess of at least 0.2M unsold juveniles. These are given as extras to farmers, and some are lost while being held in the hatchery during unavoidable delays between the time of metamorphosis and delivery.
For 1985 the predicted production is 3M, and thereafter nearly 6M per year. The increased market demand is due to the expansion of grow-out pond acreage on existing prawn farms and on the new centralized farm at Le Vallon.
In 1983 deteriorating freshwater quality due to drought, and the occurrence of "mid-cycle" disease, caused a considerable decrease in production; only about 1.5M juveniles were produced (Fig. 2).
The severe drought which occurred during the first part of 1983 was responsible for the decreased quality of the freshwater from the hatchery well. The borehole, connected to the neighbouring sea and being placed in an unstable aquifer, yielded water whose salinity increased from 0 to 14% with an ionic composition unsuitable for larval rearing. Thus, freshwater had to be carried by tankers to the hatchery. This reduced the production capacity dramatically and juvenile demand could not be satisfied in 1983.
Histological examination of larvae from Camarons Hatchery Co. Ltd. showed that infected larvae had the same systemic bacterial infection as was observed in larvae in Hawaiian hatcheries (Brock, personal communication). In Mauritius, the disease was controlled successfully with antibiotic (oxytetracycline) treatment of infected tanks, while antibiotics proved to be ineffective in Hawaii (Brock, 1984). The source of the pathogenic bacteria and Koch's postulates were not able to be satisfied because of lack of laboratory facilities. The disease occurred, despite routine sanitation procedures, and it is presumed that larvae were stressed by the unbalanced ionic composition of the freshwater during the drought, and hence, were more susceptible to disease. No disease problems have re-occurred since February 1983.
The average production of juveniles per month was deliberately reduced from 384,000 in 1979 to between 195,000 and 245,000 juveniles for the years 1980-83, to satisfy orders averaging about 225,000 per month. Monthly production in 1984 increased to 357,000 juveniles in an effort to satisfy outstanding 1983 orders. The average length of the rearing cycle has decreased from 42 to 40 days. It is to be noted that a record 1,168,532 juveniles were produced in December 1984.
A high speed opto-electronic juvenile counter has been installed and is in operation since September 1984; this counter is unique and is the first one designed to count macroscopic prawn juveniles. The counter design and operational installation in the hatchery has been described by West and Thompson (1983 and 1985).
This new electronic method of counting juveniles is much quicker, more accurate and labour efficient than the previous hand-counting system. The counter is able to count at least 150,000 juveniles per hour with an accuracy of 99%. There is significantly less stress put on the juveniles, as the number of operations involved in collection from tanks and the counting procedure have been considerably reduced, and the total time involved in operation has been reduced from 5 to 2 hours. The counting procedure is less labour intensive, as only 3 men are needed to count juveniles against 7 previously.
Juveniles are now carried in 60 l dustbins aerated with a mobile air compressor connected to the battery of a van, instead of being placed in sealed plastic bags containing oxygen. This new system has the following advantages:
a) there is less stress placed on the counted juveniles as only 1 operation is involved from the counter to the dustbins, taking only about 15 minutes compared to 3 operations lasting more than 40 minutes previously;
b) it is less labour intensive as only 2 men are needed to prepare the consignment for delivery as against 4 previously;
c) the mortality rate at delivery, especially with large juveniles (above 1.2 cm in length) and for delivery times over 1 hour has diminished considerably.
Exportation of juveniles began on a trial basis in 1978 and 1980. Small shipments of 500 were sent to South Africa, France and La Reunion. About 900,000 juveniles were sold to South Africa in 1981 and 1982 and 180,000 to Malawi and La Reunion in 1984 and the first quarter of 1985.
The juveniles are counted in batches of 2,000 about 36 hours before shipment and subsequently starved. Each batch is then packed in polystyrene-insulated cardboard cartons; a maximum of 150,000 juveniles is packed and sent in one shipment. Juveniles packed thus can survive for 36 to 48 hours provided the water in their containers remains between 20 - 28 C. Before and after air transportation, the boxes must be shielded from direct sunshine or rain.
Exports are thus favoured to nearby regions which have direct links by air to Mauritius and which assure that the total time for the consignment to arrive at its destination does not exceed 36 hours. Flights which involve transhipments are avoided, as the consignment may be mishandled or held in an unfavourable environment, leading to high mortality of juveniles.
The island-wide location of prawn farms in Mauritius belonging to the private sector are shown in Figure 1. At present there are 11 farms operating at a commercial level, which is defined as having a minimum of one acre (0.4 hectare) of wetted area in production. There are approximately four other small farms, including non-shareholders, which buy juveniles from the central hatchery; their contribution to total production is minor.
The 62 commercial ponds total 17.7 hectares (44 acres) of wetted area, with individual ponds varying from 0.2 ha (0.5 acre) to 0.4 ha (1 acre) in area. The average farm size is 1.2 ha (3 acres), the largest farm consisting of 16 ponds totalling 3.2 ha (8 acres).
Expansion: The new centralized prawn farm at Le Vallon on the east coast at Ferney S.E., belonging to Camaron Production Co. Ltd., is now under construction at an intital investment of Rupees 18 million (US$1.2M). When it is completed in 1986 a total of 33 ponds plus nurseries, with nearly 19 ha of wetted area, will be in production, increasing the island-wide total to 36.5 ha, approximately 97 ponds. Several existing prawn farms also have programs for expansion in the near future.
The production of marketable prawns in grow-out ponds in the private sector for the years 1977 to date are shown in Figure 3. Production increased dramatically from 2 metric tonnes (T) to 25 T between 1977 and 1982, stabilizing between 23 and 25 T per year. Production for the first 6 months of 1985 was 8 T with a total of 27 T predicted by the end of the year. Targets for island-wide production 1986 and 1987 are 61 T and 95 T, respectively and include both existing ponds and those now under construction. The farm at Le Vallon should produce between 50-63 T per year once it attains its maximum production.
The increase in production is the result of improvements in pond management, the consistent availability of juveniles, the use of nursery ponds, and the development of locally manufactured water-stable pelleted prawn feeds. The limiting factor is not grown-out technology but the application of technical, scientific management principles.
The yield per hectare of market size prawns is highly variable depending on the environmental location and on the quality of management of individual ponds. Survival of stocked juveniles to harvest size averages 44% with a range from 30% to 75%. If the survival rate can be increased to 50% in all ponds currently in production, then 43 T per year could be produced instead of only 25 T.
One prawn farmer has recently achieved 2470 kg/ha/year and another one 2381 kg/ha/year (51% survival); these values are slightly higher than the average production level (2240 kg/ha/year) now obtained in Hawaii (Shang, 1981).
Experiments in alternative management systems were done in 1980-82 at Riche en Eau S.E. prawn farm and it was shown that production levels are greatly inluenced by management practices. It was concluded that prawn rearing can be profitable in Mauritius and this served as the rationale for planning the centralized 20 ha farm (Thompson, 1982; 1985).
Even so, the majority of existing prawn farms are currently operating with limited or no profit margins because of their small size (range 0.2 to 3.2 ha of ponds) and hence, excessive costs per pond for infrastructure (fencing, electricity, watchman, etc.) and management, and the present high cost of juveniles and pelleted feeds (Thompson, 1979).
One objective of expanding the grow-out area in Mauritius is to enable the central hatchery to operate at maximum capacity so as to lower the cost of juveniles for all producers. Thus, the viability of the grow-out phase should improve for prawn farms. In Hawaii small farms (8 ha) are profitable only when operated as a family venture and often in conjunction with other agricultural activities (Shang, 1981).
Placing pond management on a more scientific basis by introduction of daily monitoring of temperature, pH, phytoplankton density (using Secchi disc for visibility index), feed consumption and water flow, plus periodic checks of dissolved oxygen and prawn populations have helped to augment production island-wide.
To train all the prawn farmers, periodic courses in pond management were given. An extension service was also provided from 1976 to 1984, with an intensification of the training given between 1980 and 1983. This service was discontinued in 1984 because of economic constraints and the fact that farmers felt they no longer needed such a service.
Nursery ponds are an intermediate step between the hatchery tank and the rearing pond and when properly managed give increased survival of juveniles. Several types and designs of nurseries have been tried island-wide with most farmers using either concrete tanks or small earthen ponds. Greater control over predators (birds, fish, eels, etc.) can be exercised and feeding more carefully regulated. The major limiting factors may be excessive algae and waterweed growth which interferes with transfer of young juveniles into larger grow-out ponds, and the logistical problems in the transfer methodology itself.
Experiments with earthen nurseries have yielded an average of 68% survival (range 37-92%). Knowing the estimated biomass and survival of young prawns at the end of the nursery growth phase (6-8 weeks) helps the farmer to regulate feeding and stocking densities in the grow-out ponds. Nurseries provide a system of accountability and help in program planning.
Supplemental feed (25% protein pellets) is given to prawns in intensive pond culture. The rate of application varies from 3-5% of the estimated prawn biomass per day, with final amount determined by the 'feed-on-demand' system. In nurseries the feeding is more intense, 10-15% of the total biomass per day with utilization of high protein (38%) crumbles.
Reasonable feed conversions have been obtained in the last several years, since the design and fabrication of a locally produced (Livestock Feed Ltd., Guibies) water-stable prawn pellets and juveniles crumbles (Thmposon, 1978). Prawn feeds first appeared on the local market in 1981, after nearly three years of research and development. Pellets are stable for 2-4 hours when immersed in water and maintain their integrity for up to 12 hours without disintegrating completely.
Feed conversion ratios (FCR, defined as the number of kg of dry feed needed to produce one kg of prawn wet weight), which are now obtained in ponds, are reasonable, ranging from 2.8:1 to 4:1 (island-wide average 3.4:1), and represent a great improvement over the > 6:1 FRC achieved previously with powdered chicken feed. It was estimated that nearly 60% of the powdered chicken feed was lost through dissolution and only served to fertilize the pond, being unavailable to the prawns for consumption. Even though prawn pellets are no longer imported from South Africa but are manufactured locally, the cost remains high because most of the feedstuff ingredients are imported.
In Mauritius, farmers have had no problems selling freshwater prawns on the local market. On the contrary, they cannot fulfill the high demand which is partially created by the diminishing fishery of the endemic river species of freshwater prawn (Macrobrachium lar) which has been a highly sought after food item amongst the people of Mauritius.
Most prawn farmers sell fresh dead prawns at the pond site directly to customers, to hotels and restaurants, and sometimes to a middleman or 'revendeur'. The farmer does not process or deliver and hence, has minimal control over the final quality of the product. Occassionally complaints have been heard from customers who have eaten 'camaron rosenbergii' in restaurants. However, fresh prawns never exhibit bad qualities such as: dry, mushy, old or off flavour; most of these problems can be shown to be due to bad handling or incorrect preservation. Thus, as part of the extension service in the past few years, detailed recommendations have been made for proper handling and transporting of prawns from the pond site to the consumer. Prawn farmers are advised not to sell large quantities to any buyer not transporting the prawns on ice or in a refrigerated container or truck.
Plans exist for establishment of a processing facility (freezing, packaging, etc.) at Le Vallon centralized farm which will process for both local and export markets. The facility can also be used by neighbouring prawn farmers or foodstuff producers in the south and serve as a centre for exportation.
In 1981-82 a preliminary local market survey was conducted by postal questionnaire. From this survey the local market demand for freshwater prawns was estimated to be 62 T per year with an additional amount of 52 T to 104 T which one importer/exporter indicated he could utilize. Importation of crustaceans and molluscs in 1979 was 186 T at a CIF value of Rs 5.4 M. The potential demand for freshwater prawns can be estimated to be at least 100 T/year with an increase predicted as the population and tourist industry expands and imports are perhaps restricted.
Thus, an assured local market exists for the present island-wide production (23-34 T/year) as well as for the production from the 20 ha centralized prawn farm (50-63 T/year) which is now under construction.
Crustaceans are considered a luxury food item and as such are suitable for exportation and to obtain foreign currency.
A thorough survey of foreign markets has not been done. The preliminary information received from Europe, particularly Germany and Belgium, indicate that these markets demand a frozen product, tails only, at graduated size and price categories. A preference is indicated for "large" tail pieces (8 to 12 count per 0.45 kg) which cannot be easily satisfied by our prawn farms. The additional time and feed needed to grow larger size prawns would not result in economic viability.
Inclusion of processing, packaging and air freight could make our prices for cultured prawns non-competitive with natural fisheries products. The only area where we could perhaps be competitive is in the area of processing and packaging as European importers often complain that frozen prawns from natural fisheries in developing countries arrive in such poor condition that they cannot be sold.
Markets in neighbouring countries such as La Reunion, Seychelles, and South Africa, may prove more profitable than Europe as freight would be cheaper and short direct flights would allow exploitation of the fresh produce market. In 1983-84 fresh-dead/iced prawns were successfully exported to La Reunion to test their market acceptability. The potential demand is estimated to be greater than 50-70 tonnes per year. The export market potential should be analyzed before expanding the prawn industry beyond the saturation level of the local market.
The Camarons Hatchery Co. Ltd. can provide juveniles for all the existing prawns farms and the new centralized farm, up to 6 M per year, with no major modifications or expansion of the present hatchery. Further increase of grow-out pond area may necessitate such an expansion at a later date.
The hatchery was built in 1975-76, before the advent of clear-water conical tank methodology, which uses no phytoplankton but which demands a particular type of tank management, and daily, complete water change. If expansion becomes necessary, a cost-benefit analysis and choice between "green-water" and "clear-water" technology would have to be made. Both systems can produce juveniles adequately, and the choice of a rearing system is partly dependent on the educational level of the labour availability and on the investment capabilities of the industry for its infrastructure, e.g. space and water requirements, costs for concrete Vs fibreglass tanks, etc. The use of clear-water, recirculating filter systems in rectangular and elliptical tanks will be seriously considered as a means for expansion of the central hatchery. This system is currently being developed for commercial production in Hawaii and Tahiti.
By the end of 1986 the hatchery will be producing 6 M juveniles per year and this should enable the unit price of juveniles to decrease. This in turn will benefit all prawn farmers and perhaps prevent further increase in the cost of production of market-size prawns. If excess juveniles are produced, after meeting the requirements of the local industry, export markets will continue to be sought and to be supplied, keeping in mind that these are only short-term markets. Once a pilot project proves to be successful the investors may find it beneficial to build a hatchery on site in their own country.
Since the last review of the freshwater prawn industry in Mauritius (Thompson, 1979) many of the outstanding problems listed for the grow-out phase (II) of prawn aquaculture have been resolved, or are in progress:-
a) The survival of juveniles has increased island-wide with the use of nursery ponds and better preparation of ponds before direct stocking.
b) Experiments have proved that, under conditions of optimum "biological/scientific" management of ponds, prawn culture is economically viable; yields per hectare in Mauritius are equivalent to or exceed those obtained in Hawaii.
c) Water-stable pelleted prawn feeds and juvenile crumbles have been designed, tested and are now locally manufactured by Livestock Feed Ltd.
d) The feasibility study and plans for a 20 ha centralized prawn farm have been completed. The farm, Camaron Production Co. Ltd. is now under construction at Le Vallon and the expected production date is early in 1987.
e) A stable and predictable supply of grass and carp fingerlings used for control of vegetation in prawn ponds and for polyculture with prawns has been achieved with the successful development of an induced breeding technology at Riche en Eau S.E.
As in any new or expanding venture, there is still ample opportunity for improvement and research and development. At the centralized farm, Camaron Production Co. Ltd., plans exist for further development in the following areas:-
a) use of pneumatic blowers to mechanize feeding of prawns in all ponds;
b) further testing of nursery ponds and alternate pond management strategies to increase yields per hectare and to minimize the cost of production;
c) further experimentation on polyculture of prawns and fish and on the use of grass carps for vegetation control in ponds;
d) set-up integrated farming trials by introducing foodcrops, 'palmiste' and ducks, and the use of either sheep or deer to control pond bank vegetation;
e) further experimentation on alternate feedstuffs and encouragement of natural pond productivity to increase yields;
f) re-design the supplemental pelleted feeds to be more cost-effective;
g) to do an in-depth survey, for both local and near-by export markets, and to establish a central processing and freezing unit and cold store;
h) introduction of a mini-computer for management and establishment of a scientific data base for the farm.
Freshwater prawn aquaculture is still considered to be a high risk capital intensive investment, and the success or failure of the centralised farm will directly affect the entire industry in Mauritius. It is important also that Government policies be designed to support the industry, particularly from the point of view of restricting importation of other crustacean products which could compete directly, depressing the local sale of freshwater prawns. Even though much progress has been realized within the past five years in the development of the freshwater prawn industry, considerable work remains to be done to bring about successful completion of the current phase of expansion, and the long term stability and profitability of prawn farming in Mauritius.
Ardill, J.D., R. Jenson, B. Jugnarain and R.K. Tompson, 1973. The introduction of the freshwater prawn Macrobrachium rosenbergii (de Man) into Mauritius. Revue Agricole et Sucrière de l'Ile Maurice, 52:6-11.
Ardill, J.D. and Rogene K. Thompson, 1975. The freshwater prawn, Macrobrachium rosenbergii in Mauritius. FAO/CIFA Symposium on Aquaculture in Africa, Accra, Ghana, 30 Sept. 6 Oct. 19985, CIFA/75/SE 4, 14 pp.
Brock, J.A., 1984. Diseases (infectious and non-infectious) mentazoan parasites, predators, and public health considerations in Macrobrachium culture and fisheries. In: CRC Handbook of Mariculture, Vol. 1 Crustacean Aquaculture, ed. J.P. McVey, p. 329-370.
Fujimura, T., 1974. Development of prawn culture industry in Hawaii. NOA/NMFS Job Completion Report. Dept. of Land and Natural Resources, State of Hawaii, 21 pp.
Goorah, D. and S. Parameswaran, 1983. Maturation and fecundity of the giant camaron, Macrobrachium rosenbergii (de Man) in ponds in Mauritius. Revue Agricole et Sucrière de l'Ile Maurice, 62(2): 84-90.
Shang, Y.C., 1981. Freshwater prawn (Macrobrachium rosenbergii) production in Hawaii: practices and economics. Sea Grant Misc. Report UNITHI-SEAGRANT-MR-81-07, 36 pp.
Thompson, R.K., 1978. Macrobrachium rosenbergii. Requirements for supplemental ration, 19 pp., (unpublished).
Thompson, Rogene K., 1979. Aquaculture of freshwater prawn, Macrobrachium rosenbergii in Mauritius, its status and potential. Proceedings of National Agricultural Production conference, University of Mauritius, Reduit, 10-15 Dec. 1979, pp. 435-459.
Thompson, Rogene K., 1980. Aquaculture of Macrobrachium rosenbergii in Mauritius: commercial scale production of juveniles. Presented at "Giant Prawn 1980 Conference", Bangkok, Thailand, 15-21 June 1980. IFS Provisional Report No. 9, pp. 748-769. -- 1982. In: M.B. New (ed) Giant Prawn Farming. Elsevier Scientific Publishing Co., Oxford, pp. 417-436.
Thompson, R.K., 1982. Preliminary feasibility study for freshwater prawn production, Mauritius, 50 pp., (unpublished).
Thompson, R.K., 1985. Feasibility study for freshwater prawn production at Ferney S.E., Mauritius 39 pp., (unpublished).
West, D.C. and Rogene K. Thompson, 1983. Opto-electronic counters for post-larvae and juveniles of Macrobrachium rosenbergii (de Man), design and tests of Type B counter. Aquacultural Engineering, 2(3): 213-232.
West, D.C. and Rogene K. Thompson, 1985. Opto-electronic counters for juveniles of Macrobrachium rosenbergii (de Man): supporting equipment and use of Counter B under commercial hatchery conditions. Aquacultural Engineering, 4: (in press).
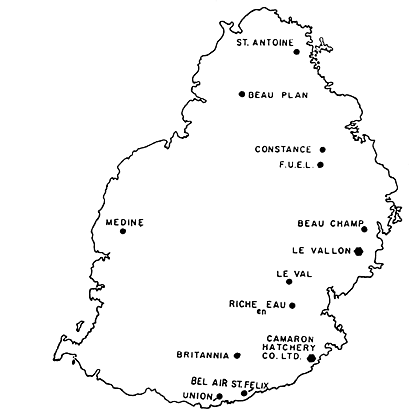
FIGURE 1: Map of Mauritius showing location of commercial prawn farms and the central hatchery in the private sector.
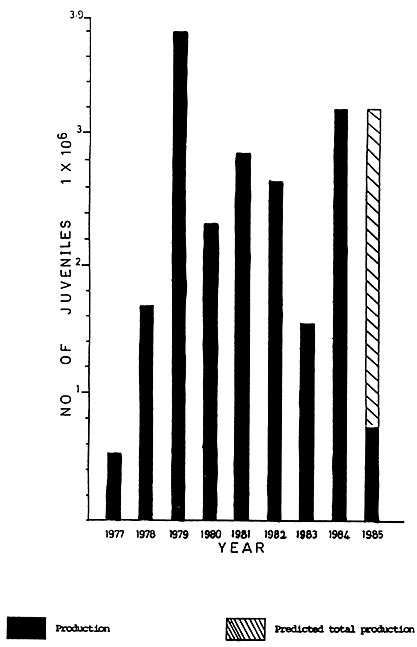
FIGURE 2: Production of freshwater prawn juveniles by Camarons Hatchery Co. Ltd. from 1977 to 1985.
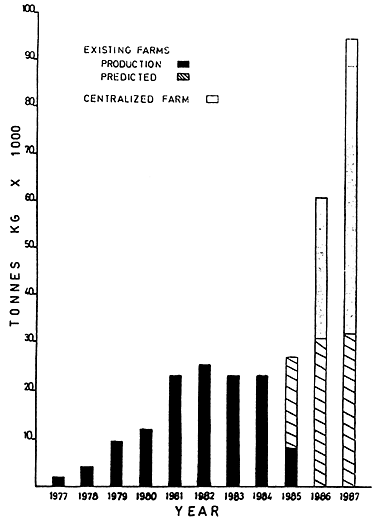
FIGURE 3: Approximate island-wide production of market size freshwater prawns from 1977 to1985 with predictions for total tonnes in 1985-1987, including production from centralized prawn farm, Camaron Production Co. Ltd.
by
B. Thiga
(DEPARTMENT OF FISHERIES, KENYA)
Crustacean landings are the most profitable fisheries product in Kenya as they command a higher price compared to the others. The major groups landed include spiny lobsters (Palinuridae), Shrimps (Penaeids) and Crabs which are caught along the coast while the crayfish (Procambarous Clarkii) is freshwater and landed in Lake Naivasha.
Due to their high demand in tourist hotels and restaurants they may be prone to over-exploitation if their fishery is not properly managed. However, their high demand and inadequate supply may promote their chance of aquaculture.
As apart of management strategies, traders in Crustaceans in Kenya are required to be licenced by the government at a fee. The following sub-sections briefly describe the various Crustacea resources which are common in Kenyan waters.
For many years shrimps have been exploited along Kenya's Coast. Penaeid shrimps are the most commercially exploited. The main species landed in large quantities are Penaeus indicus and Penaeus monodon, those landed in smaller quantities are Metapenaeus monoceros and Penaeus semisulcatus. Of these P. indicus constitute the bulk of the shrimp landing.
Fishing is mainly done by artisanal fishermen using gear like stake traps, cast nets, beach seine nets, among others. Trawling is also common but done by a few private companies only.
On the average Kenya's continental shelf area is narrow with large section of rough bottom topography due to coral formation. This restricts the areas which are trawlable. However, there are some sizeable areas which are smooth and suitable for trawling.
These areas are located in the Ungwana Bay Complex (lat. 2°45. 0' Lo. 40° 25.0'E) and the North Kenya Banks region which lies off-shore of the Lamu archipelago (See Fig. 1). This together with the high expenses involved in trawling leave the traditional methods to dominate in Shrimp Fishing.
This is another group of Crustacea which has a high market value. The chief commercial lobsters found in Kenya belong to the genus panulirus and the common important species are Panulirus ornatus, P. daspus, P. longipes, P. Homarus, P. verisicolor and P. Penicillatus. Of these P. ornatus is the most common. Like shrimps most lobster fishing is artisanal. The bulk of lobsters is landed by divers. Fishermen operating from dugout canoes, outriggers and other small craft, skin-dive and capture the lobsters alive. Handnets consisting of fine pursed netting sewn onto a wire loop or gloved hands are used. Presently goggles and other diving equipment are being used though not very common. This method of fishing would limit the depth and hence, only shallow waters are constantly fished and thus overfishing is common.
Experimental lobstering (FAO) have been done using nets of various types in Kenya. Tangle nets and trammed nets have been tried. The fisheries are still not used to these nets. Trammel nets have been demonstrated and proved useful in Kenya though the fishermen are still to adopt it perhaps due to inadequate funds.
High demand for lobsters in hotels and restaurants sometimes increases fishing pressure which occassionally leads to harvesting of immature individuals. Landing details are presented in Table 1.
This fishery is less important in comparison to shrimps or lobsters. This is partly due to their relatively lower demand than the later two. Consequently its fishing has also not been exploited in a large scale.
Although crab species in existence are many, only a small number are used as human food on a considerable scale. In Kenya the mud crab scylla serrata and portunus pelagicus are the most exploited.
Crabs are mainly found in muddy estuaries, river mouths and shallow bays.
The most common methods of fishing include traps of various types, tangle nets and trawls. In some cases crabs are caught by curved stick which is driven into a crab hole to fish it out.
It is felt that crab fishery needs more improvement especially in the following areas - fishing gear, studies of its population dynamics, and marketing, as it is felt that its potential could still be high.
Freshwater crustacea fisheries in Kenya is dominated by the cray-fish species Procembarous clarkii. It is almost entirely found commercially only in Lake Naivasha where it was introduced from North America. Today it is among the most important commercial fishery in the Lake. It is mainly landed by local fishermen using baited traps.
It is not a popular food among the locals perhaps due to its exotic nature. The chief market outlets for this fishery is mainly tourist hotels but the bulk of the landing is exported.
The importance of Crustacean fishery in developing countries cannot be over emphasised. Therefore its management requires considerable attention. To improve efficiency especially with the artisanal fishermen, upgrading of fishing methods is required. Fishermen should be educated periodically on all aspects of management of this fishery and this may be achieved through Fishermen Cooperatives. Loan systems through the cooperative may assist to mechanise boats and improve post harvest handling for better quality and high prices. Field staff should be trained in work shops on various aspects, like data collection and other relevant information regarding crustacea population.
Finally if it is economically feasible aquaculture of crustacean species should be encouraged.
| Crustacea group | 1982 |
1983 |
1984 |
|---|---|---|---|
(kgs) |
(kgs) |
(kgs) |
|
| Lobsters | 60,503 |
55,731 |
55,046 |
| Prawns = (Shrimps) | 314,388 |
300,357 |
405,643 |
| Crabs | 51,148 |
56,259 |
64,064 |
________ |
________ |
________ |
|
Total |
426,039 |
412,347 |
524,753 |
| No. of trawlers | 11 |
11 |
7 |
FIGURE 1: The chief lobster landing stations of the Kenya Coast
by
Razafindralambo N.Y.
(CENTRE NATIONAL DE RECHERCHES OCEANOGRAPHIQUES, MADAGASCAR)
Industrial fishing of prawn resources on the Malagasy continental shelf started in 1967 and was followed by research staff of the Office de Recherche Scientifique et Technique d'Outre-Mer (ORSTOM), based in Nosy-Be up to 1975 and of the Centre National de Recherche Oceanographiques (CNRO) which took over the work of ORSTOM in 1978.
Various publications on the biology of the shrimp fishery are thus available and a recent economic study has completed these studies with an objective of modifying the management of the of the industry which produced low yields as of late 1979 after thirteen years of anarchic exploitation.
This paper is a bio-economic summary of work undertaken up to now by scientists of CNRO.
Four companies have been involved in this fishery from 1967 to 1979.
- The "Pêcherie de Nosy-Bé" (P.N.B.) started operations in 1970 and is based at Nosy-Bé;
- The "Société Malgache de Pêcherie" (SOMAPECHE) started in 1967 and is based at Mahajanga;
- The "Fanjonoana Malagasy Koweitiana" (FAMAKO; ex-G.P.O.) was created in 1974;
- The "Societe Industrielle de Pêche à Madagascar" (SIPMAD) existed between 1967 and 1985.
The FAMAKO company has now changed management and is named Société de Boina (SOPEBO) and another company the REFRIGEPECHE based in Tamatave on the east coast entered the industry in 1981.
The first fishing enterprises exploited resources on the North-West and West Coasts between Cap. St. Sebastien in the north and Cap. St. Vincent on the South using two types of trawlers:
- freezer trawlers having an autonomy of 20-30 days at sea and freezer or ice trawlers having a limited hold capacity or keeping time for the catch, limiting the stay at sea from 3 to 5 days.
The trawlers used Florida-type twin-beam rig which use two other trawls simultaneously.
Trawl hauls vary from 1 to 5 hours, fishing at depths of 5m to 30m.
Other than one company which still uses a try-net, high frequency echo-sounders are used for locating suitable grounds and shrimp concentrations.
Processing is generally done in plants ashore and is divided in several sections where activities are controlled and organised by one responsible person: reception and logging of shrimps, quality inspection, sorting, calibration, packing, weighing, freezing, packing in "master-cartons" (containing six boxes of 2 kgs), binding and stocking.
The species fished in order of importance are:
| - | Penaeus indicus or "white" which constitute about 95% of the catch. | ||||||
| - | Metapenaeus monoceros or "Pink" or "Calendre" | ) | |||||
| ) | |||||||
| - | Penaeus semisulcatus | ) | ) | ) | |||
| - | Penaeus japonicus | ) | or "Flower | ) | or "Tiger" | ) | or "Brown" |
| - | Penaeus monodon | ) | ) | ||||
Penaeus indicus is fished mostly along the North-West Coast from Cap. St. Sebastien to Kimby near the city of Morondava.
The table below gives the annual landing of whole shrimp and the corresponding effort in fishing hours of a "standard boat" which is a trawler carrying ice of 15m LOA, powered by a 150 Hp main engine. The number of boats as of the 31st December for each year is also given.
| Year | Catch | Effort | Boats as of 31/12 |
|---|---|---|---|
| (t) | (hours) | ||
1967 |
775 |
11.360 |
7 |
1968 |
1.340 |
17.211 |
7 |
1969 |
1.635 |
14.334 |
6 |
1970 |
2.910 |
42.389 |
19 |
1971 |
4.080 |
78.640 |
32 |
1972 |
4.690 |
140.250 |
38 |
1973 |
4.800 |
144.420 |
40 |
1974 |
4.450 |
175.050 |
45 |
1975 |
4.630 |
126.850 |
36 |
1976 |
4.540 |
111.150 |
35 |
1977 |
5.125 |
106.690 |
35 |
1978 |
4.950 |
117.419 |
40 |
1979 |
4.330 |
115.668 |
40 |
1980 |
4.910 |
128.247 |
42 |
1981 |
- |
- |
41 |
1982 |
5.265 |
- |
45 |
Source: Centre National de Recherches Oceanographiques. - Data not available
With an estimated potential yield of 6,000t catches of companies have not to date exceeded 5,000 t except in 1977 with 5,125 t and in 1982 with 5,265 t. 90% of shrimps (whole and headed) are exported to Japan, North-America and to a lesser extent, Europe. The 10% remaining are consumed locally.
From a census made in late 1979, the company has a total investment of 2,322,000 million Fmg of which 460 million for infrastructure on land and 1.6000 million in fleet value (depreciation not included).
As opposed to the organisation prevailing in a number of countries such as Sénégal and Morocco, the activity on land and that at sea are vertically integrated within the companies in Madagascar.
The fishing enterprises employ 1,460 people including 650 at sea and 810 workers on land and in administration. Temporary workers are recruited during the peak season. It is estimated that the total wage package in 1979 was 1,105,000 million Fmg.
The major investments in the fleet, imply particular attention being paid to maintenance of trawlers and other vessels, a sine-qua-non condition for the profitability of the industry. However, bad management (by certain companies of the fleet) resulted in poor financial returns having a negative impact on the total balance, on its solvency and led to a deficit of about 1.5 thousand million Fmg at the end of 1979. This situation was aggravated by successive increases in fuel prices on which the industry is largely dependent, by the seasonal nature of the fishery and the instability of exchange rates. The economic returns are also affected by a diminishing value added to the detriment benefits to the national economy.
There is too large a discrepancy between the operational costs and the returns. This not only increases in proportion with the fishing effort but also with inflation. A reorganisation and reorientation of the industry that is management, is thus urgently required.
The potential yield (maximum sustainable yield) - MSY for each zone was calculated from statistical data from 1967 to 1980. The results obtained are slightly different from those obtained previously based on catch data collected from 1967 to 1977 but are more reliable than the latter on statistical grounds.
| ZONE | MSY (t) |
Optimum | Optimum Yield | |
|---|---|---|---|---|
| Effort (h) | (kg/h) | |||
I |
(Baie d'Ambaro) | 1.600 |
70.000 |
22,8 |
II |
(Baie de Narindra) | 720 |
13.000 |
55,4 |
III |
(Baie de Mahajamba) | 300 |
4.000 |
75,8 |
IV |
(Nord Mahajamba) | 310 |
6.000 |
42,3 |
V |
(Sud Mahajamba) | 910 |
50.000 |
18,2 |
VI |
(Cap. St. Andr,) | 1.370 |
80.000 |
17,1 |
| VIII to X (South of Cap. St. André) 1.000 according to present knowledge | ||||
The application of a fishing effort below the MSY leads to lower landings-biological under-exploitation - whilst effort above the MSY leads to over fishing. The latter leads to the disappearance of exploited stocks over time.
It should be noted that there is no correspondence between the MSY of the different fishing areas and the corresponding fishing effort required to attain them because of variations in abundance (or density) of shrimps from one zone to the other: for example the Baie d'Ambaro zone which is the richest in potential tonnage of catch (1600 t/year) does not provide the best hourly yields (22.8 kg/h) and fishing all of the potential catch will in fact need very high efforts due to the high dispersion of shrimps in this zone.
Recent studies have shown that for zones I to IV which account for about 80% of the fishing effort to date there are three economic levels of exploitation. These are detailed in the following table, adjusting hourly costs using 1979 as reference 100 (see fig. 1 & fig. 2).
Levels |
Catch (t) | Balance |
Effort (h) |
|---|---|---|---|
(106 mill. Fmg) |
|||
| Maximum returns (Rm) | 4.313 |
54 | 125.000 |
| Break-even (Ob) | 4.312 |
0 | 123.000 |
| Maximum profit (Bm) | 3.140 |
+1.240 | 50.000 |
It should be noted that there is very little difference between the values for Rm and Ob.
In other words, in so far as the aim of industrial shrimp fishing in Madagascar is to attain maximum profit (and not revenue) in hard currency for the national economy, it is advisable to reduce the fishing effort to 50,000 hours for Zones I to IV.
The working hypothesis has been to accept that there is little influence on revenue from fluctuations in catch composition in relation to the fishing effort. (Troadec 1982).
The reduction of the fishing effort to 50,000 hours which would produce about 314 t/year of whole shrimp and gives a profit of 1.24 thousand million Fmg should pass through two management phases: short term and long term.
Short term management measures should aim to reduce exploitation costs (suppression of trawler charters, reorientation towards alternative grounds or other products, readjustment in policies of business of management, of investments and search for more renumerative markets.
Long term management measures are meant to lead to a balance development and a harmonous growth in the fishery sector (industrial and artisanal fisheries) as well as in other economic sectors. The local ship building yards must be renovated so as to diminish import of boats, support industries should be created (fish meal factories, coldstores), the application of regulations should be more closely controlled by the State, personnel working in the fishery sector should be better trained.
As with all models, the one used here for economic purposes contain bias due to insufficiency in quantity and quality of accountancy data which are difficult to check; corrections and improvements in this sense will be done to bring to light two definite concepts:-
- Optimisation of foreign currency earnings contributing to the balance of payments.
- The study of the economic returns from each type of boat.
Meanwhile, the proposed management measures remain valid despite the effects of inflation.
However, their implementation is rendered difficult by factors such as vested interests of the multinational companies involved or the limiting means be eliminated by a larger participation of the state in this industry.
If the short term measures help to improve rapidly the financial situation of companies, the long term ones aim to create full employment and the maximum availability of protein for the population.
The return to a certain liberalism of the Malagasy economic life which started in 1982, characterised by an increase in external exchange, has boosted the fisheries exploitation, which was nearly moribund by the end of 1979.
To this effect, progress has been noted, as evidenced by two essential facts:
- An increase in the number of companies from three to four since 1981;
- An increase in capital investment to the rise in the number of companies and to an extension in their activities, helped by the liberalisation of importations (purchase of new tralwers to replace obsolete vessels or in supplement of existing ones, purchase or more appropriate vehicles of spare parts).
Companies |
P.N.B. | SOMAPECHE | ex-G.P.O. | SIPMAD | Total |
|---|---|---|---|---|---|
| FAMAKO | |||||
Year |
|||||
1974-1975 |
240 |
200 |
375 |
595 |
1.410 |
1976-1978 |
240 |
200 |
375 |
- |
815 |
1979 |
240 |
200 |
900 |
- |
1.340 |
REFRIGE- |
|||||
PECHE |
|||||
1981-1984 |
480 (1) |
200 |
900 (2) |
120 |
1.700 |
(1) Participation of S.F.I. of 10.4%
(2) FAMAKO becomes SOPEBO with Japanese and Malagasy (51%) capital.
With the increase in capital investment, catch has also increased since 1980.
1980 : 4910 tonnes of whole shrimps 1982 : 5265t
1981 : 5075 tonnes of whole shrimps 1983 : 5503t
1984 : 5800 tonnes of whole shrimps 1984 : 5800t
As no data are available for many years on fishing effort, it is difficult to determine the relationship between catch and effort, but it seems the increased investment in this sector have given positive results to the fishing companies. Two of the four companies have realised profits of the 255,000 million Fmg in 1983.
Raveloson (1985) reported on the fish by-catch of the shrimp industry in Madagascar.
The fish by-catch of the shrimp industry is classified in three categories: table fish, fish suitable for fishmeal production, and trash species and debris.
The first category is characterised by a size relatively larger such as the Mullidae (red mullets) and the Nemipteridae (cahome), which are marketable. Other families, like the Clupeidae, the Engraulidae and the Bothidae have commercial importance, for example in Europe, but are consumed by the fishermen community in Madagascar.
The second class is characterised by small-size fish, having many bones, are not edible and have no commercial value, known as fishmeal trash-fish, they are generally juveniles of table fish and are divided into two sub-categories: 'false' and 'real' trash fish (Ledognathidae...).
The third category is made up of the non-marketable and non-consumable fish and consists of box-fish (Ostracionidae) or venomous and toxic fishes (Scorinidae, Lagocephalidae).
The reason for the simultaneous capture of shrimps and fishes is that both have similar feeding habits.
The hourly yields for each zone are given below:
(a) Zones I, II and III were studied and together show the following mean yields per hour:
P = 100,19 kg/h during peak shrimp fishing season
P = 99,44 kg/h during the low fishing season
P = 96,68 kg/h during the whole year.
The main yield does not seem to vary significantly in relation with the shrimp seasons.
(b) The percentage of fish by-catch in the fish: shrimp mix is never nil even during the low season. The minimum value P% is 33% and the maximum can go up to 100% in the low season. For all zones, mean P% = 82.96% and it is higher (88.31%) during the low season than the peak season (71.36%)
FAO (1983) has estimated that the ratio shrimp/fish for Madagascar is from 1/1 to 1/5 depending on the zones and the seasons.
(c) The proportions of table fish (PT) and fish for fish-meal (PF) in the total by-catch calculated for the three zones considered, show that PF is very much higher than PT. On the average PT = 28.49% and PF = 71.5% for all zones, and during the whole year, the rejected component is negligeable.
At this time it may be said that the fish suffer from over-exploitation which can result in disturbance of the biological equilibrium. In 1983 it was estimated that each trawler of one company was landing about 3t of fish (by-catch) per month.
The fish by-catch can be utilised in three ways: for human consumption, for animal food (cattle, poultry) and for fertilizers.
The future aim of exploiting these fishes being to supplement the protein intake of the population, the priority use of the by-catch is for human consumption. This can be through three forms: as fresh fish, as fish meal or oil and as solubles or concentrates. These two latter products would require processing plants which as yet do not exist in Madagascar.
Concentrates, the product being called Nuoc-mam (name of vietnamese origin), contain 60g to 115g/L (Rivonjaka, R., 1984) of protein and can be made from edible fish of small sizes which cannot be sold and from shrimp heads. The concentrate is beneficial to babies, elderly and under-nourished persons.
Fish meal is specially meant to be used as feed for cattle and poultry (egg layers) cf.v.1 and is a very good source of nitrogen. However, the protein concentration has to be reduced as it imparts a bad smell and gives a taste which can repel the animals.
Finally, the transformation of the non-consumable fish into fertilizer is one means of enriching the soil, vegetable gardens for example.
Being given the high proportion of fish which can be converted into fishmeal in the by-catch and which is mostly thrown over board in the shrimp fisheries thus, leading to a large waste of resources, it is envisaged to build fish meal plant. This is being studied at the CNRO in Nosy-Be.
RALISON A., 1978 - Caractéristiques et tendances de l'exploitations crevettière malgache de 1967 à 1977. Doc. Sci. Centre Nat. Rech. Océanogr., Nosy-Bé No. 1, 37p.
RALISON A., et RAZAFINDRALAMBO N.Y., 1984 - Bilan des connaissances sur la pêche crevettière malgache et propositions d'aménagement. Doc. Sci. Centre Nat. Rech. Océanogr., Nosy-Be No. 7.
RAZAFINDRALAMBO N.Y., 1983 - analyse économique de l'industrie crevettière à Madagascar. doc. Sci. Centre Nat. Rech. Océanogr., Nosy-Bé No. 4.
RAVELOSON H.N., 1985 - Les poissons d'accompagnement des stocks crevettiers. Mémoire de fin d'études à l'Etablissement d'Enseignement Superieur des Sciences Agronomiques d'Antananarivo, Madagascar.
TROADEC J.P., 1982 - Introduction à l'aménagement des pêcheries. Document FAO - ROME.
RIVONJAKA RANDRIAMANAMISA, 1984 - Concentre protéique d'origine marine - accélération de la macération. Article Sci. Centre Nat. Rech. Océanogr., Nosy-Bé (COLOCEAN-I)
FIGURE 1: ADJUSTMENT OF HOURLY COSTS IN RELATION TO TIME (t)
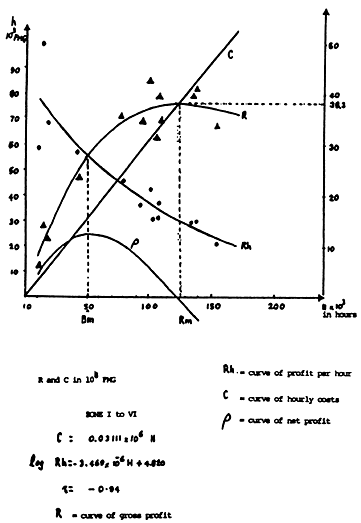
FIGURE 2: PROFITS AND COSTS FOR ZONES I TO VI COMBINED
By
M. Munbodh
(ALBION FISHERIES RESEARCH CENTRE, MAURITIUS)
Exploitable fisheries resources are found in the lagoon and off-lagoon areas of Mauritius and Rodrigues, on the banks north of Mauritius and in the Western Indian Ocean near the equator. The catch of the lagoon and off-lagoon areas and the banks comprises of tunas. There are no major crustacean fisheries in our waters but small amounts of lobsters, crabs and shrimps are caught in coastal waters.
Spiny lobsters which live on the outer reef flat and outer reef slope are fished by artisanal trap fishermen, the species being Panulirus longipes and P. pennicillatus. Traps used are usually sixty cm by ninety cm and thirty cm in height and are made of galvanised wire. It is estimated that around 300 trap fishermen in Mauritius use some of their traps to catch lobsters especially during the summer season. With the availability of freezing facilities on St. Brandon, a small lobster fishery has started around the islands since 1983. Table 1 gives the annual catch of lobsters in Mauritius, Rodrigues and St. Brandon since 1977.
| Year | Total | Mauritius | Rodrigues | St. Brandon |
|---|---|---|---|---|
1977 |
23.8 |
12.5 |
11.3 |
|
1978 |
17.6 |
8.8 |
8.8 |
|
1979 |
46.9 |
23.2 |
23.7 |
|
1980 |
27.3 |
14.9 |
12.4 |
|
1981 |
21.8 |
8.4 |
13.4 |
|
1982 |
13.5 |
5.3 |
8.2 |
|
1983 |
38.9 |
22.1 |
30.6 |
6.2 |
1984 |
55.6 |
24.2 |
28.3 |
3.1 |
Crabs are normally found in estuaries and along the coast of the island. The main species which are caught by fishermen include Scylla serrata (crabe carlet) and Thalamita spp. (crab batard). Crabs are usually caught by means of traps made of metallic wire or bamboo. No statistics is available on the crab fishery and it does not involve a significant catch being most probably around ten tonnes annually.
Shrimp stocks appear to be very small in Mauritius. Although many persons have permits to fish for shrimps only about forty of them are actually active shrimp fishermen, the others only fishing on an amateur basis. It is estimated that only a few tonnes are caught annually the main species being Penaeus latisulcatus, P. canaliculatus, P. monodon and Metapenaeus monoceros. The fishing gear used is a small mosquito net mounted on two poles and not exceeding 2m sq. Fishing operations are carried out at night by individual fishermen who use artificial light and fish in knee-deep water.
Freshwater crustacean aquaculture was initiated in 1972 with the introduction of the giant freshwater prawn Macrobrachium rosenbergii for intensive culture purposes in ponds. Since then the hatchery techniques for post-larvae have been well developed and production capacity is in excess of present demand.
Two hatcheries, one belonging to the private sector. The Camaron Hatchery Co. Ltd. and one run by the Fisheries Division of the Ministry of Agriculture, Fisheries and Natural Resources are operational at present. Management techniques of grow-out ponds have gradually improved with the result that 25 t of prawn were produced from about 17 ha of ponds under culture in 1984. The construction of a 20-ha pond complex for freshwater prawn production is in progress and this prawn farm is expected to produce an additional 70t prawn when fully operational.
Marine crustacean aquaculture has been traditionally carried out in a few barachois (dry stone wall enclosures of small bays along the coast) together with finfish and involve mainly the crab Scylla serrata. Young crabs caught from wild populations are stocked in the barachois for fattening purposes. Production from these systems is reported to be about 1.5t per year.
In view of developing intensive marine aquaculture, research is at the moment directed at culture of marine shrimps. Surveys have been carried out to make an inventory of species locally available and to select species which could be cultured. The four species Penaeus monodon, P. latisulcatus, P. canaliculatus and Metapenaeus monoceros have potential for aquaculture in Mauritius. Hatchery post-larvae production of P. monodon and M. monoceros has been successful on a experimental basis. Efforts should now be directed at mass production of such post-larvae and out-door pilot scale fattening trials of the shrimps.
Crustacean stocks in waters around Mauritius are relatively small and are heavily fished by artisanal fishermen. However, aquaculture of crustaceans, specially shrimps, can be further developed as crustaceans are highly-prized on the market. Efforts will also be made to exploit under-utilized deep-sea shrimp resources found at depths of 600-1100m around the island using traps.
By
Cristina Silva and Lizette Sousa
(INSTITUTO INVESTIGACAO PESQUEIRA, MAPUTO)
The crustacean resources along the coast of Mozambique are: shallow-water shrimp, deep-water shrimp, spiny lobster, crayfish/slipper lobster and deep-water and mangrove crab.
As the shallow-water shrimp fishery is the most important and the most developed fishery, a more detailed desciption will be presented in the next section.
The deep-water shrimp is exploited by different trawlers. Most of the trawlings are carried out at depths between 450 and 600 meters south of 24° 30' S. The total annual catch in 1984 was 1,500 tonnes.
The spiny lobster seems to be distributed along the Mozambican coast from about 17° S to the southern border. The main concentrations however, occur south of 22° S and fishing is usually carried out between 200 and 400 meters. The fishing is performed both with trawls and with traps. In 1984 the annual catch was about 200 tonnes, mainly caught by traps.
The crayfish/slipper lobster stock is believed to be of the order of a few hundred tonnes. No specific fishing is carried out on this stock. The catches are mainly a by-catch of the deep-water shrimp fishery.
The deep-water crab is found in patches along the continental slope between 250 and 850 meters. The main fishery areas are off Bazaruto and off Inhaca Island. The fishing is carried out with traps and the total annual catch in 1984 was around 1000 tonnes.
The mangrove crab is a typical litoral resource. The mangroves along the coast of Mozambique cover an area of 1700 km sq. The most productive parts of the coast are probably the coast between Beira and Save River and between Zambezi River and Moma.
The shallow-water shrimp occurs almost along all the coast of Mozambique. Its distribution is closely related with the presence of mangroves, places where shrimp grow on the first months of its life. The adult population lives in the bays and in the sea in shallow-waters.
The catch and species composition of the artisanal fishery are not well known. An underestimate of 4000 tonnes was obtained for Sofala Bank in 1980. The shrimp is caught mainly by beach seiners.
The highest catches are obtained by the industrial and semi-industrial fleets in Sofala Bank, Maputo Bay and Beira Bay.
In Sofala Bank the main fishing concentrations occur in waters shallower than 25 meters, between Angoche and Machese and between Beira and Chiloane; however, the highest fishing effort is concentrated in small areas between Pebane and the delta of the Zambezi river. The vessels are trawlers of 25 and 30 meters total length equipped with double rig systems and with cold storage and quick freezers. The total catch have been decreasing from 10000-12000 tons in 1974 to 8000 tons in 1984.
In Maputo Bay and Beira Bay the fleet is constituted by small stern trawlers of about 12 meters long working with ice with a reported annual catch of 200 tons each. Although there is fishing all over the bays in waters deeper than 5 meters the highest fishing effort is concentrated in small areas.
The most abundant and valuable species belong to the family Penaeidae although caridean shrimp occur in the catches. The most important species are: Penaeus indicus (with shrimp), Metapenaeus monoceros (brown shrimp), Penaeus monodon (tiger shrimp), Penaeus semisulcatus (tiger shrimp) and Penaeus japonicus (flower shrimp). The various shallow-water species undergo fluctuations in abundance, within the year and from year to year. However, the catches of Penaeus indicus and Metapenaeus monoceros form 90% (in Sofala Bank) and 80% (in Maputo Bay) of the total annual shrimp catch.
Total catches (reported or estimated) for the years 1968-1983 are shown in Fig. 2. However, information until 1976 is not totally reliable.
Fig. 3 shows catch rates and fishing effort for the period 1974-1984. The annual catch dropped from 10-12 thousand tonnes, in 1974-1976 and to 8 thousand tonnes in 1982. This is related with the decrease in catch rates observed during the last years 1976-1978 but has since declined and reached its lowest value in 1983.
Last assessment (Ulltang, Brinca and Sousa, 1985) indicates that fishing mortality reached the level of 0.2 monthly in 1983. According to this analysis, this level of F corresponds to a level of fishing effort near the optimum level from yield per recruitment considerations.
Taking into account the uncertainties of the yield per recruit studies (values of growth parameters and natural mortality) and the low recruitment of P. indicus during last years, it was recommended not to increase the fishing mortality, but try to keep F at the level estimated for 1982 (0.16).
Fishing mortality can be controlled by directly limiting fishing effort (in number of fishing vessels) or by setting catch quotas.
Concerning the first method, there can be problems in controlling the effective fishing effort, if a new vessel is substituting an old one, for example. Their effectiveness (and also their fishing power) can be different.
The main difficulty with the second alternative is that the catch corresponding to a certain level of fishing mortality is dependent on recruitment. So, it can be applied if catch quotas for a year were only decided after some indications of the recruitment were available.
But, how can be get an index of recruitment? As it can be observed in Fig. 4 the fluctuations in total c.p.u.e. are mainly caused by fluctuations of the species P. indicus.
Catch per hour of P. indicus seems to be very dependent on recruitment during the first three months of the year. A relationship between catch per hour during January - March and the whole year was found, showing that the abundance during the first three months is a good indicator of the abundance for the year as a whole (Fig. 5).
An index of recruitment was calculated for each year dividing the total annual yield by the yield per recruit values for P. indicus corresponding to the fishing mortality estimated for this year. The values obtained were plotted against mean catch per hour in January - March of the same year (Fig. 6). There is a good correlation, again indicating that the abundance of shrimp during the first three months of the year is a good indicator of the total recruitment in that year.
The estimated regression lines can be used to estimate total annual catch. An index of recruitment can be calculated with the mean catch per hour during January - March. The total catch of this year can be predicted by multiplying this index by yield per recruit value of P. indicus for the F - level decided.
Yield per recruit curves are not available for other species than P. indicus. This fact introduces an extra uncertainty into the assessment. However, as this species contributes in a large extent to the catches, it was found justifiable to apply the conclusions based on Y/R for this species to the whole population of shallow water prawns at Sofala Bank.
The total catch estimated for the year as described before must be distributed by the vessels.
As there are different fleets varying from 100 to 1000 tons of gross tonnage the fishing power is different.
Assuming that the fishing time for each vessel (expressed in hours of trawling) do not vary, and as the recommendation is not to exceed the fishing effort estimated for 1982, if the composition of the different fleets for 1982 is not altered, then the fishing effort will be maintained in the level recommended.
The mean effort per vessel in standard units for each type of fleet was estimated by the total effort for each type of fleet by the number of vessels present in each type (Fig. 8).
Knowing the mean effort per vessel, it is possible to make alterations, in the composition of the fleets without varying too much the total effort established. However, it is important to have in mind that there are certain limitations. For example, if a new vessel is changed the fishing power certainly will not be the same as an old vessel of the same type.
Brinca, L. and L. Sousa, 1984 - A Lagosta de profundidate Palinurus delagoae da costa de Mocambique. Rev. Inv. Pesq. (9): 39-44
Brinca, L. and L. Sousa, 1984 - O recurso de camarao de aguas pouco profundas. Rev. Inv. Pesq. (9): 63-74.
Dietrich, B., 1984 - Informacao geral sobre o manancial de camarao de profundidade e a sua exploracao nas aguas de Republica Popular de Mocambique. Rev. Inv. Pesq. (9): 63-74.
Freitas, A. J. and J.M. Araujo, 1973 - Status of penaeid shrimp stocks of Mocambique ICSEAF 73/S.F. No. 14.
Ulltang, O., 1980 - Stock assessment study of the resources of shrimp and lobster off Mozambique. Report to FAO from a consultant stay in Mozambique.
Ulltang, O., L. Brinca and C. Silva, 1980 - A preliminary assessment of the shallow water prawn stocks off Mocambique, North of Beira. Rev. Inv. Pesq. (1) 69 pp.
Ulltang, O., L. Brinca and L. Sousa, 1985 - State of the stocks of shallow water prawns at Sofala Bank. Rev. Inv. Pesq. (13): 97-126.
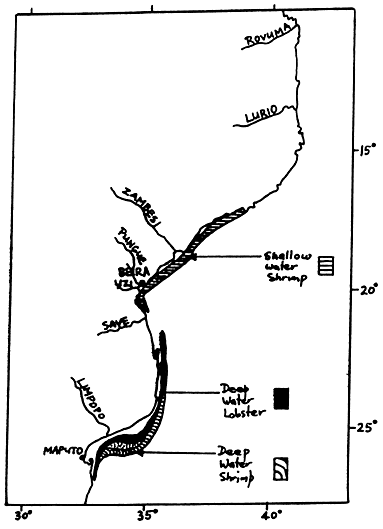
FIGURE 1: Areas of distribution of crustacean fisheries.
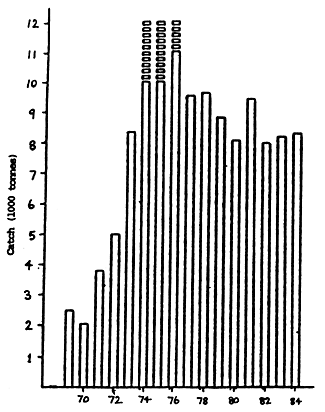
FIGURE 2: TOTAL ANNUAL CATCHES FOR THE PERIOD 1968 - 1984
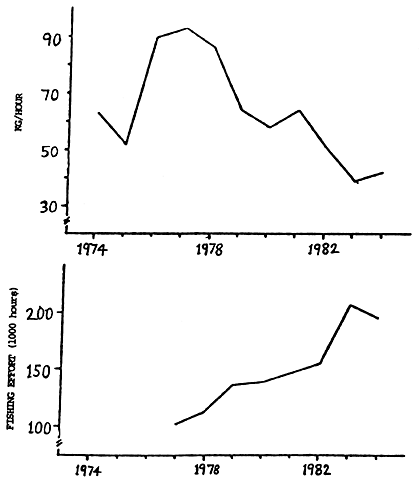
FIGURE 3: CATCH PER HOUR AND FISHING EFFORT DURING 1974 - 1984
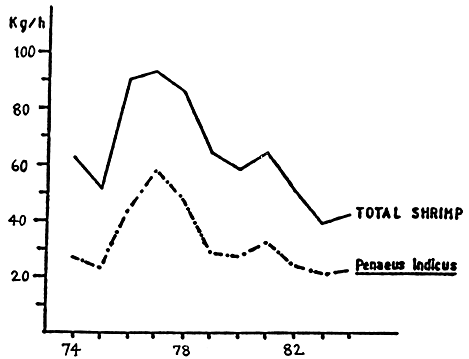
FIGURE 4: COMPARISON BETWEEN MEAN ANNUAL CATCH PER HOUR OF TRAWLING OF TOTAL SHRIMP AND Penaeus indicus
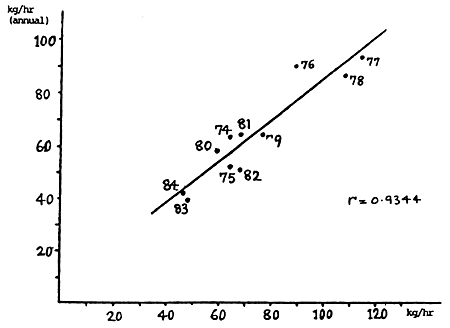
FIGURE 5: MEAN CATCH PER HOUR DURING THE WHOLE YEAR PLOTTED AGAINST MEAN CATCH PER HOUR DURING JANUARY - MARCH

FIGURE 6: INDEX OF RECRUITMENT (R) PLOTTED AGAINST MEAN CATCH PER HOUR DURING JANUARY - MARCH
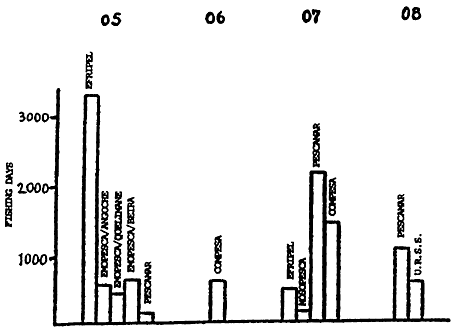
FIGURE 7: TOTAL EFFORT BY ENTERPRISE IN CLASSES OF GROSS TONNAGE
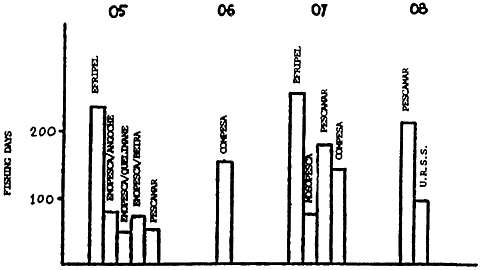
FIGURE 8: MEAN EFFORT PER VESSEL IN CLASSES OF GROSS TONNAGE
by
A.H. Noor
(MINISTRY OF FISHERIES AND MARINE RESOURCES, SOMALIA)
The known stocks of commercially valuable crustacea occuring in Somalia waters include both shallow water Shrimp and Lobster, which appear to be available in any quantity. The following represents a summary of all the available information relating to these stocks, based largely on past fishing operations:-
(a) Penaeus species and metapenaeiosis species shrimp occur in shallow waters along the Gulf of Aden and Indian ocean coasts but only small quantities have been caught and the stocks appear to be highly localised.
(b) Stocks of deep water shrimp, Heterocarpus tricarinatus which have been caught with lobster trawling gear at depths of 500m on the Indian Ocean shelf, appear to be similarly limited.
Lobster resources are comprised of spiny and sand lobster species:-
Local small-scale fisheries for spiny lobster (Panulirus ornatus, P. versicolor, P. penicillatus, P. dasypus and P. iaponicus are fished at various locations along the Somali Indian Ocean Coast. The Lobsters are caught exclusively in the near shore shallow waters by diving (withoug use of a boat or air hose). The main fishing seasons are from February to May and October to December.
Sand Lobster is mainly fished by industrial fishing fleets and is offshore (out to the 100m depth contour). The Sand Lobster (Thenus orientalis) has constituted a very small by-catch from commercial trawling activities in the relatively recently established deep water lobster fishery (Somalfish trawlers and licensed trawls). The main catch components are white lobsters Puerulus seweli and P. angulatus. Deep water trawlers (Somalfish) using freezer trawlers, operating at depths between 200-400m on the continental sloe (off the Indian Ocean coast) comprising two narrow belts lying between Mogadishu and R/Kiyamboni and a similar belt extending between Eil & Obbai have shown mean catch rates 0.4 - 0.7mt/vessel/day.
Show decline from North to South whilst those of P. angulatus show an increase.
Overall, the data are wholly inadequate for resource assessment purpose and as the coastal waters of Somalia have not yet been systematically surveyed to establish the stock size, local evidence, past syrveys estimates the Somalia Crustacea as follows:-
1. Lobster
(a) Spiny - 500mt
(b) Sandy - (deep sea) 1500-1800mt
2. Shrimp - 500 tons
1985 catches
1. Lobster
(a) Spiny - 120 tons
(b) Sand lobster - 1500 tons
2. Shrimp - 50 tons
Closed lobster fishing season are set for industrial fishing (offshore fisheries). It commences on 16th March up to 15th August each year. For artisanal fishermen, it is totally prohibited to catch female lobsters carrying eggs. Also, it is a violation of our fisheries regulations if at all, fishermen catch, sell or process spiny lobsters weighing 460 gms or lobsters with stretched length from eye to tail and measuring 23 cm or less.
Although commercial lobster fishing is pursued by licensed vessels which process and freeze their products on board, Somali Marine Products (A Ministry of Fisheries owned company) buys spiny lobsters from Fisheries Cooperatives South of Kismayo to the Kenya border. Lobsters are brought iced to Kismayo from a distance about 100 nautical miles to the processing factory. Lobsters after catching are iced in a chilled container on board of collector vessels which goes with the fishermen to the lobster fishing grounds. At the arrival of lobsters to the processing factory they are immediately processed into tails and are deep frozen. Packing of the deep frozen products is as follows:-
- Graded from 4/6oz per tail through 20/24 per tail, 5 kgs inner boxes with polythene liners packed into 20kg master cartons. Individual tails deveined and flesh covered with polythene and secured by rubber band.
1. Saudi Arabia
2. Italy
3. Singapore
In the areas, mainly North of Mogadishu where there is no processing facilities lobsters are pre-cooked and stored in reefer trucks and air freighted from Mogadishu to Djibouti and Italy.
by
A.A. Ameir
(ZANZIBAR FISHERIES CORPORATION)
1.1. Zanzibar and Pemba are autonomous islands with their combined area of about 2,450 sq miles. The population was 475,655 in 1978 census, about 180 people per sq km. The growing and exporting of clove and clove products of which the Islands supply a major proportion to the world market, is the base of the Island's economy and provides export earnings. Competition for the clove market arising from supplying nation, plant disease and crop failure have caused the government to give high priority to the question of economic diversification. The government also has realised the need to supply alternative and growing occupational opportunities to the younger generation, fisheries sector has been earmarked to provide diversification of the Zanzibar economy.
1.2. Geographically Zanzibar and Pemba lie between 5° and 6° South and 29° and 40° West in the Indian Ocean within the coastline of East Africa. They are climatically affected by two monsoons from the South East between March and June and from North West between October and February. Both are affected by a notherly flowing current which by the nature of the channels can reach 3 to 4 knots. The geographical location hides the Islands from natural up wellings and the fisheries biomass is restricted to the coralline zones around them or to such pelagic species that may be found in the Zanzibar and Pemba channels.
2.1. Fish is one of the most valuable sources of high grade protein available to the people in Zanzibar. The fact that the fish protein contains the essential amino acids which are necessary to human diet for the maintenance of good health makes fish a good nourishment to the people. Fish provides the correct proportions of these amino acids, this is very important because the staple food of the people of Zanzibar and Pemba is rice, cassava and sweet potatoes all having high percentage of starch thus, fish provides a good combination of amino acids which highly suits the local population with nutritional requirements.
3.1. Crustacean fisheries in Zanzibar is entirely in the order of small scale level. Spiny lobster is the only crustacean commercially exploited in Zanzibar waters. There are some other species of crustaceans such as Crabs and Prawns but their occurance is seasonal. Prawns are found during rainy seasons when the salinity of the sea is lowered by rain water along the coast.
3.2. Commercial fishing for spiny lobster is believed to have been started as long ago as in 1958, along the coral reefs surrounding the two islands. Observations on the commercial lobster catches indicated the same species of the Genus Panulirus namely P. Ornatus, P. versicolor, P. longipes, P. dsypus and P. penicillatus. Their commercial importance is that P. ornatus comprises over 80% of the total catch.
3.3 Spiny lobsters are mostly found in coral reefs and small Islands around the main Isands of Zanzibar and Pemba. The quantity varies from one locality to the other. It has been observed by lobstermen that coral reefs areas with some muddy have good concentration of different species of lobsters. The reefs area in Pemba Island is 818 km sq and that of Zanzibar 715 km sq (FI: DP/URT/75/090 of 1982). It is believed that Pemba Island has better potential of lobster resources compared to the Zanzibar Island from the fact that the coral reefs areas is much wider in the former than in the latter Island.
4.1. Lobster fishing in Zanzibar is basically done by skin diving and harpooning, that is by active hunting rather than trapping. Lobsters here do not readily enter traps. Only a few enter the local "Dema" traps set for fish. For this reason fishing is done mostly when diving conditions are good, the sea is relatively calm and underwater visibility reasonably good. When the current is powerful under the sea surface and the wind strong as during the Southern monsoon, sand and mud get mixed up in the water body making it murky and visibility bad. Thus, fishing is limited during times of strong winds and rough seas. During the Muslim Holy Month of Ramadhani fishermen also stop operations.
4.2. The diving activity is carried out in groups of two to six men each. Each group uses one boat and is under a leader. The number of divers per boat is not constant for all days worked and considerable portion of diving time is taken up by harpooning fish.
4.3. The areas where lobsters are caught on the reefs are practically the same all the time. When the diver comes to the lobster's shelter and does not find any, he returns later to the same place with a reasonable amount of certainty that there will be one. This shows that there is a stock probably from deeper water which is not fished directly. (FIGURE 1 shows Main lobster landing areas and species distribution of Zanzibar Island).
5.1. Lobstermen catch all sizes of lobsters regardless of whether the lobsters are in the moulting or breeding condition. The capture of juveniles is due to uncontrolled fishing activities. According to Bwathondi, (size and composition of spiny lobsters) the data for maturity stages of lobsters have shown that first spawning takes place at 65mm carapace length. For management purposes it would seem proper to allow lobsters at least an increase of a minimum carapace length from 65mm to 70mm. This increase in the legal size from 65mm to 70mm would increase the potential of lobster resources because many females will get a chance to breed at least once before they are caught. Futhermore, the government is trying hard to discourage this method of catching and introduce fixed traps instead.
The African Journal of Tropical Hydrobiology and Fisheries.
EAMFRO - Annual Report 1973:
Spiny Lobster investigations by W.B. Mutagyera.
+Technical considerations of fishing development in Zanzibar (FI:/DP/URT/75/090) by A. NAKANISHI

FIGURE 1: Main Lobster landing areas and species distribution of Zanzibar.
by
W.V Haule
(KUNDUCHI MARINE FISHERIES AND RESEARCH TRAINING INSTITUTE, TANZANIA)
Information regarding the prawn fishery in the Tanzanian coastal waters is limited (Sankarankutty et al 1974). However, Sankarankutty et al (1974) pointed out that, publication of Hall (1964), Kerr (1966) and the report of SAGAMI MARU (mimeo 1969) were the only studies which provided a basis for further investigation on prawns along the Tanzanian coast. With regard to the fishery potential for prawns along the coast, the investigations of Shomura et al, Prasad et al (1970), Longhurst (1970) and Gulland (1979), are worth mentioning. However, the latest study on some prawns along the Tanzanian coast has been that by Haule (1981).
Among the crustaceans, prawns rank first in terms of production, accounting for over 85% of the total crustacean landing of mainland Tanzania. Sankarankutty et al (1974) reported that, along the Tanzanian coast, all the prawns of commercial value belong to the penaeids, and that only four species of the penaeids had been established through taxonomic studies in commercial quantities. These were Penaes indicus, P. monodon, P. semisulcatus and Metapenaeus monoceros.
Gulland (1979) stated that, the annual yield of prawns in Tanzaina (based on analysis in Rufiji and Bagamoyo areas only) is about 1830 metric tonnes. Reports given by the Fisheries Division on the Tazanian Ministry of Lands, Natural REsources and Tourism, show that the annual yield of prawns in Tanzania between 1965 and 1972 is far below 500 metric tonnes. However, Gulland's (1979) report on the prawn yield, within the same period (1968-1972) gives higher figures (average 500 metric tons).
Sankarankutty et al (1974) gave an account of trawling for prawns along the Tanzanian coast. However, they were unable to estimate the potential yield of prawns caught by the New Mwananchi Ocean Products Limited for the period 1968-1971, because the data obtained were not sufficient. Bugge (1978) while working on the possibility of a viable shellfish industry in Tanzania, concluded that 480 metric tonnes of prawns were harvested annually by local fishermen in Rufiji river delta alone. (The larger proportion of prawn fishery in Tanzania is contributed mainly by artisanal fishermen).
The low potential of prawns from the Tanzanian coastal waters may be attributed to the fact that, the ideal habitat required by the prawns during their different stages of life history is not extensive along the coast. This is due to such factors as the narrow continental shelf, extensive coral outgrowth, (which hampers trawling) absence of large river systems, (except Rufiji and Ruvuma) and conspicuous expanses of estuarine medium. Insufficient mechanical vessels, coupled with inefficient fishing methods and the consequent low level of fishing effort, result in the under exploitation of the prawns.
An exploratory shrimp trawling by SAGAMI MARU (Anonymous 1969) had surveyed the prawn grounds of Tanzania coast. The grounds are located in the estuaries of all the major rivers. These include Rufiji, Pangani, Ruvu and Wami. (River Ruvuma, forming the southern border of Tanzania, was not included in the survey). The deltaic area of Rufiji is the most important prawn ground. In Rufiji, better grounds are located at the northern parts of the delta in Kisiju area. The area near the mouth of river Ruvu, offers the next prawn ground. The importance of these grounds is established by the fact that, commercial trawlers concentrate their maximum effort in these areas. The commercial trawlers have observed an increasing volume of catch with decreasing distance to the coast.
In summary, the prawn grounds along the Tanzanian coast are scattered and highly localised patches, extending from Moa, north of Tanga (northern part of the Tanzanian coastal line), through Sadani, Ruvu to south, Rufiji down to Kilwa Kivinje (in the southern part of Tanzania).
There are a number of traditional methods being employed for catching prawns in the Tanzanian waters.
Stake traps account for a sizeable quantity of the prawns being landed in Tanzania. These are semi-permanent "V" shaped traps, set out on the foreshores. The design, material and size of the gear varies according to local conditions. In the deltaic region of Rufuji, this is one of the most widely used gear for filtering prawns. The prawns during their shore-ward movement get collected in the trap along with fin-fishes. The catches are usually emptied twice a day.
Seasonal operation of cast nets is prevalent in many areas in mainland and Zanzibar, particularly at river mouths, bays and creeks. The nets are either operated from shore or from boat. The catch is mainly comprised of juveniles of penaeid prawns.
To a limited extent, beach seines are used for catching prawns in the estuarine areas.
These are operated in certain parts of Pemba. The operator while holding one end of the sticks, uses the other end to stir the bottom. The gear is lifted up while the disturbed prawns jump out of the burrows.
These nets are used to catch both penaeid and non-penaeid prawns from the mangrove and creek areas during low waters.
Some fishermen use rectangular pieces of coarse cloth for fishing out caredean prawns and juveniles of penaeids. The operation is confined to knee-deep waters and the tide pools.
Trawling is the widely used and modern method of fishing for prawns. Commercial trawling did not become a reality in Tanzania until the late 1960's. Exploratory trawling was initiated by the defunct East African Marine Fisheries Research Organization as early as 1959. Subsequent prawn trawling has also been carried out by a Japanese vessel - SAGAMI MARU (from 1968-1972). This was followed by the formation of a joint stock fishing company, the New Mwananchi Ocean Products Limited, with Tanzanian and Japanese participation. The training vessels of Kunduchi Fisheries Institute (in Tanzania mainland side) also carried out sporadic trial trawling in the prawn grounds from 1971-1973.
The only modern vessels now engaged in commercial fishing along the Tanzanian coast are those of the Tanzania Fisheries Corporation (TAFICO) formed in 1974. Trawling operations so far have been carried out by medium and fairly large vessels, imposing a restriction in shallow waters trawling.
Anonymous (1969) The Report of the survey on the prawn fishing grounds along the coast of Tanzania. Kanagawa Prefectural Government, Japan 120p.
Bugge R. (1978) Report on the investigation for proposed shellfish industry in Tanzania. MARCOTRADE, Dar-es-salaam.
Gulland J.A. (1979) Report on the FAO/IPTP Workshop on fishery resources of the West Indian Ocean south of the Equator.
DEV. REP. Indian Ocean Programme (45) 102p.
Hall D.N.F. (1964) Penaeidae of the east coast of Africa. C.S.A. Specialist meeting on Crustacea, Zanzibar, pp 86-97.
Haule W.V. (1981) Some biological aspects of penaeid prawns of Kunduchi mangrove creek. M.Sc. thesis, University of Dar-es-Salaam.
Kerr A.A. (1966) The fisheries of East Africa and their development aspects. A preliminary survey FAO Fish. Circ. 103: 130p.
Longhurst A.R. (1970) Crustacean resources. In the Fish resources of the ocean. FAO Technical paper No. 97 pp. 252-306. Edited by J.A. Gulland.
Prasad R.R., S.K. Banerji and P.V. Ramachandran Nair (1970) A quantitative assessment of the potential fishery resources of the Indian Ocean and adjoining seas. Indian J. Anim Sc. 40: 73-98
Sankarankutty C. and S. Subramaniam (1974) An account on the trawling for prawns along the Tanzanian Coast. (Mimeo)
Shomura R.S., Menasvata D. Suda and Talbot F. (1970) The present status of fisheries and assessment of potential resources of the Indian Ocean and adjacent seas. FAO FISH. REP. 54: 1-32.
Lobster fishery has been carried out in Tanzania by native fishermen since time immemorial. However, only recently has trade of lobsters with neighbouring countries and abroad started (Bwathondi 1973). Before then, all of the lobster caught were consumed locally.
Five species of the genus Panulirus are found in the Tanzanian coastal waters. These are, in order of their abundance; P. ornatus, P. longipes, P. homarus, P. versicolor and P. penicillatus (Bwathondi 1973). However, Bwathondi (1973) reported that although Postal (1964) had included P. dysypus in the Tanzanian Coastal Waters, this species is now recognized as a synonymous of P. homarus.
In Tanzania, there are four methods used in lobster fishing : by a hand net and an octopus; by nets; by spear gun and lastly by traps. Of the four methods, hand net and an octopus is the most popular.
This method is not encouraged in large scale fishing, because the lobsters die soon after being caught. It is mostly used as a sport.
This method is the most effective and popular, though it depends on the visibility of the water. Before the operation, fishermen must look for a live octopus which will be tied at the end of a long stick. Fresh octopus is used everyday.
When one diver locates lobsters at a certain area, he will call his colleague who will then join him with a hand net and an octopus. One diver will hold a hand net and the other will hold an octopus. The two divers will then swim to the lobster's hiding place and the one with an octopus will flush the lobster or lobsters off the crevice while his colleague will hold the hand net at the entrance of the crevice.
When the lobster sees the octopus, it tries to escape through the opening of the crevice and eventually finds itself in the hand net. Sometimes two or three or more lobsters can enter into the hand net at the same time. The lobsters thus caught are taken back to an out-rigger canoe and kept either in special baskets or at the deck which always contains some water purposely left there to keep lobsters. Occassionally, one diver can carry out lobster fishing using a hand net and an octopus, all by himself.
Three types of nets are used: gill nets, shark nets and seine nets. Bottom set shark nets are often abandoned by fishermen because the rocks where the nets were cast, tear most of the nets. Use of nets in Tanzania is not very productive (Bwathondi 1973) although it is the most effective method employed in Mafia Island.
Many unsuccessful attempts have been made to catch Tanzanian lobsters in traps. Several unsuccessful attempts have been made using several pots in a wide range depth.
Two types of traps are used, namely a basket trap and a fixed trap.
A basket trap is made of reeds and/or sliced pieces of bamboo stems sown together by a string or the barks of some plants. Basket traps are placed in a coralline habitat where the fishermen are sure of abundance of lobsters. The trap is anchored by a heavy rock to prevent it from being drifted away by current and wave actions. Holathuria sp is used as a bait.
Fixed traps are made of small to medium wooden poles, a string and a wire net. The trap is fenced at the bottom by either a barbed wire or pieces of bamboo stems and reeds sown together. There is only one inlet which is on the land ward side. As it approaches the seaward side the trap narrows and has a blind ending.
Lobsters enter the trap from the landward side during high tides. As the tides recede, water filling the traps disappears and the lobsters, together with fish are collected by hand.
Bwathondi (1973) observed that more than 79% of the total catch came from diving using a hand net and an octopus. This was followed by nets and then by spear gun and lastly by traps.
Bwathondi P.O.J. (1973) The biology and fishery potential of palinurid lobsters in Tanzania. M.Sc. thesis, University of Dar-es-Salaam.
by
A.B.C. Killango
(TANZANIA FISHERIES CORPORATION)
Tanzania has a Coastline extending from latitudes 4° 38's to 10° and covering a total distance of 800 km. Her territorial sea space, taking into account the 200 mile EEZ limit, which is yet to be declared, is approximately 100,000 sq. km. This enormous marine water mass represented more than 50% of the country's available fishing water mass. The vastness of the area suggests a promising potential source of marine resources, particularly fishery resources.
Tanzania marine fisheries is yet to be fully developed. Current exploitation is concentrated in the inshore waters with very little being done in the near off-shore waters. In general then most of the fishery resources is still untapped. At the moment the artisanal fishermen, numbering about 8,500 utilising less efficient fishing methods and gear, contribute about 85% of total annual marine catches. Despite having the largest fishing water mass, marine fisheries only accounts for 18% of total annual national fishery catches. Failure to tap the marine fisheries particularly the off-shore ones has been attributed to lack of the necessary technological and financial resources.
There has not been adequate stock assessment surveys to determine the resource potential of Tanzania marine fishery, except for two separate studies done by two research vessels namely R/V Professor Mesyatsev and R/V Dr. Fridtjof Nansen.
Conservative estimates have indicated that the area has a total standing stock of about 300,000 metric tonnes with a Maximum Sustainable Yield of 100,000 to 200,000 metric tonnes per annum. Crustacea resources have been estimated to be about 5,000 metric tonnes with a Maximum Sustainable Yield of 1,000 metric tonnes per annum, this information was obtained from MFV. MAMA TAFICO, our commercial shrimp trawler.
Present fishing efforts over the area yield about 40,000 metric tonnes of fishery resources. The most common species landed include sardines, sharks, yellow fin tuna, rays, snappers, groupers, king fish and crustacea. Crustacea forms about 1.5% of total fishery production, but contributes to over 80% of total fishery exports, hence their importance.
Summary of annual marine production performance is as shown in Table 1.
| Year | 1974 |
1975 |
1976 |
1977 |
1978 |
1979 |
1980 |
1981 |
1982 |
1983 |
|---|---|---|---|---|---|---|---|---|---|---|
| Fish | 22,128 |
31,193 |
48,491 |
46,026 |
45,717 |
33,816 |
39,374 |
39,577 |
23,669 |
35,558 |
| *Crustacea | 180 |
216 |
354 |
457 |
363 |
408 |
463 |
441 |
415 |
457 |
| Trepangs | 24 |
14 |
6 |
36 |
49 |
40 |
71 |
26 |
50 |
29 |
| Sea Weeds | 204 |
50 |
- |
- |
- |
- |
- |
- |
- |
- |
| Sea Shells | 268 |
557 |
6 |
169 |
137 |
199 |
297 |
224 |
94 |
79 |
| Total Prod- | ||||||||||
| uction | 25,894 |
32,030 |
48,857 |
46,688 |
46,266 |
34,463 |
40,205 |
40,268 |
24,228 |
36,083 |
NB : Source : Fisheries Division Annual Report
Like in many parts of the world, shrimp fishery in Tanzania forms the major part of the crustacea fishery. Tanzania has various natural shrimp breeding and feeding grounds, these include the numerous river deltas, river mouths of Rufiji, Pangani, Wami, Ruvu and Ruvuma.
It has been established that Shallow Water prawn resources, exist in large commercial quantities in Sadani (Wami river delta), Bagamoyo (Ruvu river delta), the Rufiji delta and the Mafia channel. Substantial amount of deep sea shrimp resources are also known to exist. But no adequate surveys of the resources have been conducted yet. Present shallow water prawn fishing grounds are estimated to cover a total area of 340 sq. km., as presently established by our trawlers. Map 1 shows the present major fishing grounds for TAFICO trawlers. However, this should increase upon further exploratory studies particularly in the Kilwa/Lindi area and the Ruvuma river delta.
Potential biomass of the shallow water prawns has been estimated to be 7,000 metric tonnes with the Rufiji delta and the adjoining Mafia channel claiming 80% (Atkins Land and Water Management 1981). The Maximum Sustainable Yield calculated from various stock assessment surveys have been considered to be 1,000 metric tonnes per annum. Of recent estimates based on prawn catches, between 1982 and 1984, by TAFICO's mother-ship cum trawler "MAMA TAFICO" have indicated that the Maximum Sustainable Yield from the two prawn fishing grounds namely Bagamoyo and Kisiju is about 500 tonnes per year. (Map 1) It is therefore believed that the MSY if well determined from the whole Coastline could be more than 1,000 metric tonnes.
Tanzania prawn fishery consists of about thirty species. However, only five species are of commercial importance. These, with their respective common English names and estimated distribution in percentage, include:
Penaeus indicus (white) 60%; Penaeus monodon (Jumbo/Tiger) 15%; Metapenaeus monoceros (Brown) 20%; Penaeus semisulcatus) Tiger) 4% and Penaeus japonicus (Flower) 1%. Prawn resource exploitation is not fully developed. Presently the artisanal fishermen using simple fishing methods and gear such as drag scoop nets, cast nets, stake trap (uzio) still account for 75% of total prawn catches.
There are limited shrimp trawling efforts in the area. These include mainly those of Tanzania Fisheries Corporation (TAFICO). Non introduction of more efficient fishing methods particularly trawling to exploit the prawn fishery has been attributed to firstly occurence of coral reefs and secondly limited capabilities particularly the artisanal fishermen to acquire the necessary gear and equipment. There are narrow and limited fishing grounds and the country lacks foreign currency which is necessary for introduction of modern trawling business.
Existing exploitation by the artisanal fishermen is concentrated in the more shallow estuarine waters and mangroves which act as nursery grounds of prawns. Thus there is a danger of over fishing such nursery grounds.
A summary of total prawn catches over the past ten years is shown in table 2.
| YEAR | NATIONAL PRODUCTION * | TAFICO'S CONTRIBUTION | |
|---|---|---|---|
| WEIGHT | AS % | ||
| (headless) | |||
1974 |
101 |
- |
0 |
1975 |
166 |
9 |
5 |
1976 |
273 |
25 |
9 |
1977 |
387 |
20 |
5 |
1978 |
293 |
12 |
4 |
1979 |
338 |
44 |
13 |
1980 |
393 |
23 |
5 |
1981 |
371 |
5 |
1 |
1982 |
345 |
28 |
8 |
1983 |
387 |
115 |
29 |
* Determined from TAFICO's contribution of head-less shrimp, combined with head-on shrimp from all other sources.
The size composition of Tanzania Shrimp fishery vary from one fishing ground to another also from species to species as indicated in paragraph 2.2.
The size grading of exportable prawns in Tanzania are in units per kg or lb headless prawns. The general grading is large, kings, medium, queens, jacks and cocktails, the grade diminishing with size.
The general commercial size composition grading for Tanzania prawns and their percentage is as follows:-
| SIZE/UNITS/LB | GENERAL GRADE | PERCENTAGE |
|---|---|---|
0/5 |
Large |
25% |
6/10 |
" |
" |
11/15 |
" |
" |
16/20 |
Kings |
" |
21/25 |
Medium |
" |
26/30 |
Queens |
75% |
31/40 |
" |
" |
41/50 |
" |
" |
51/60 |
Jacks |
" |
61/70 |
" |
" |
91/90 |
" |
" |
91/100 |
Cocktails |
" |
Above 100 |
To date commercial shrimp trawl fishery is largely carried out by the Tanzania Fisheries Corporation. Commercial trawling for shrimps started in Tanzania from 1975. This started after the exploratory research by the then East African Marine Fisheries Research Organization (EAMFRO), which had confirmed the existence of commercial valuable stocks in 1959 and the subsequent successful survey operation by a Japanese firm using trawlers in the early 1970's.
Tanzania Fisheries Corporation was established in 1974 with the primary objective of developing commercial fishing. The Corporation started with 2 stern shrimp trawlers. By 1984 the corporation had acquired a total of sixteen stern shrimp trawlers with a total installed capacity of landing 500 tonnes of prawns per annum. However, at present only six are operational with a shrimp trawling capacity of 280 tonnes per year. Considering the available shrimp resources of about 1,000 tonnes/year, there is room to improve and increase on the catches.
Current exploitation efforts by TAFICO is as shown in Table 2. From this it can be seen that TAFICO's contribution to total national production has generally been increasing despite her diminishing available capacity. This phenomena can be viewed as increase in TAFICO's production due to the deployment of the "MAMA TAFICO" a modern and capable trawler.
Major obstacles facing the prawn/shrimp fishery in Tanzania are as follows:-
(i) Limited trawlable grounds; the trawlable grounds especially in the chief prawn grounds are limited by the occurence of coral reefs and mangroves. Thus there is a tendency of employing less efficient fishing methods.
(ii) Lack of technological capabilities and financial resources. This is an obstacle to the shrimp fishery in the sense that it is limiting efforts to exploit existing stocks through failure to invest in trawlers, and use these trawlers effectively.
(iii) Lack of shore back-up facilities especially for docking, drydocking, and repair work are not available. This limits the introduction and efficient operation of modern shrimp trawlers.
(iv) Lack of fishing gear for the artisanal fishermen. Most of the artisanal fishermen use outdated methods for collecting the prawns. There is therefore, need to provide fishermen with ideal fishnets for shrimp fishery.
In future the primary objective would be to increase exploitation of the shrimp resources. This would be achieved in two ways. One is to solve and remove the present obstacles hindering the development of the fishery. The other way is to increase prawn exploitation capacity.
As outlined in 3 the obstacles will be removed through:
(a) Conducting more surveys to determine more trawlable grounds thus, enable the use of modern and efficient fishing methods.
(b) Establish the necessary back up facilities particularly for dry docking, repairs and storage.
(c) Initiation of prawn/shrimp farming. Possibilities of establishing shrimp/prawn farms are under consideration, especially in our river deltas and estuaries. This will supplement our present prawn/shrimp trawling catches for export products.
For increasing exploitation capacity it is planned additional shrimp trawlers will be purchased. Secondly the artisanal fishermen will be given support, in the form of netting materials, boats and engines.

MAP 1: PRESENT MAJOR SHRIMP/PRAWN TRAWLING GROUNDS
 700
700