

by
B.R.R. Bautil
Fishery Biologist
FAO Fisheries Project (RAF/87/008)
P.O. Box 487, VICTORIA, Mahé, Seychelles
REGIONAL PROJECT FOR THE DEVELOPMENT & MANAGEMENT OF FISHERIES IN THE SOUTHWEST INDIAN OCEAN
PROJET REGIONAL POUR LE DEVELOPPEMENT ET L'AMENAGEMENT DES PECHES DANS L'OCEAN INDIEN SUD-OCCIDENTAL
c/o UNITY HOUSE, P.O. BOX 487, VICTORIA, MAHE, SEYCHELLES
TELEPHONE: 23773
TELEX: 2254 SWIOP SZ
FOOD AND AGRICULTURE ORGANIZATION OF THE UNITED NATIONS UNITED NATIONS DEVELOPMENT PROGRAMME
ABSTRACT
The data available on catch weights, fishing efforts, species compositions and fish price were used to show the short term effect from the installation of an echo-sounder and fishing reels to the schooner "Chantal". It was shown, during the eight high season months, that this equipment in combination increased "Chantal's" fishing power by 25 to 30 percent and the value of its catch by about 40 percent. It was not possible to demonstrate any benefit from the installation of the echo-sounder alone.
Distribution:
Member States of SWIOP,
UNDP (Offices in Region),
FAO (Offices in the Region),
SWIOP Mailing List
Bibliographic Entry:
Bautil, B.R.R., (1988), Handline Fishing from schooners in the Seychelles. An Analysis of the increases in catch rates and values from outfitting the schooner "Chantal" with an echo-sounder and electrically powered reels. FAO/UNDP: RAF/87/008/WP/43/E: 22 p.
This electronic document has been scanned using optical character recognition (OCR) software and careful manual recorrection. Even if the quality of digitalisation is high, the FAO declines all responsibility for any discrepancies that may exist between the present document and its original printed version.
3. THE EFFECTS FROM ECHO-SOUNDERS AND REELS BASED ON A COMPARISON OF CATCH RATES FOR BOURGEOIS
4. THE EFFECTS FROM ECHO-SOUNDER AND REELS BASED ON A COMPARISON OF CATCH VALUES FOR ALL SPECIES
The larger artisanal fishing vessels in the Seychelles, known as schooners, are wooden planked vessels, 10 to 13 m in length, equipped mainly with 27 and 37 Hp diesel inboard engines. A few of the schooners are larger, with engines of up to 120 Hp.
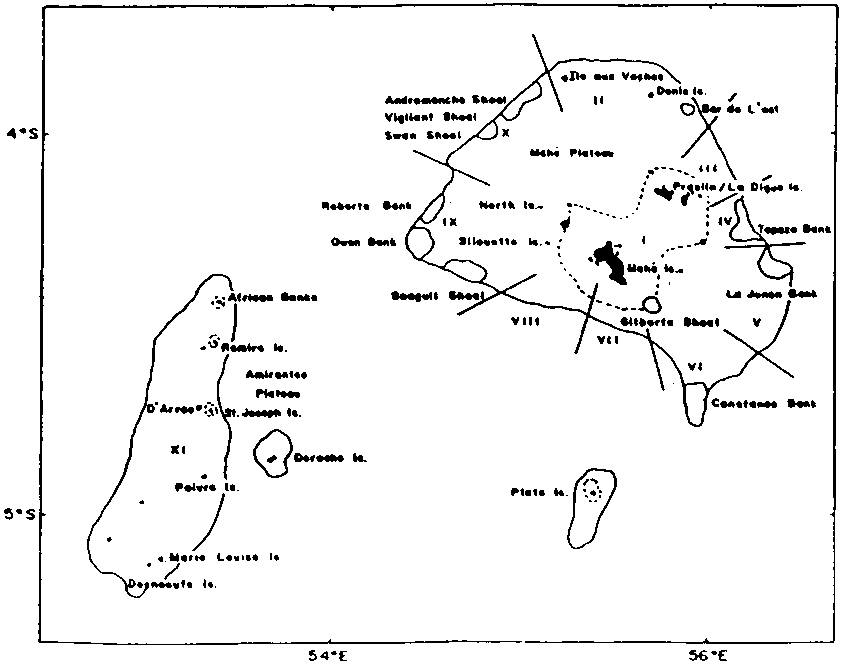
These vessels are decked and have a small cabin and an ice box with a capacity to store approximately 2 tonnes of ice and fish. Fishing is carried out with handlines, most often while the vessels are drifting. The fishing grounds are the banks at the edge of the Mahé Plateau and of the more distant Amirantes Plateau (Figure 1).
At present, the schooner fishery is largely involved in exploiting the stocks of the banks along the outer edge of the Mahé Plateau. This is in part due to their proximity, but also because these banks are the most productive for the preferred Lutjanus sebae. The estimates of potential yield of handline species range from 1,000 to 1,400 tonnes for these grounds (Lablache et al, 1988), while the catch in 1986 is given as 441 tonnes, one third of the potential.
In the past four years, the number of schooners engaged has declined from 38 (1983) to 23 (1987). Furthermore, the fishery was recently described as having poor earnings, run down vessels and chronic defaults in repayment of Development Bank loans by boat owners (Parker, 1988).
In an attempt to improve the economic performance of the schooners, the Seychelles Fishing Authority (SFA), has been promoting the introduction of echo-sounders and electrically powered fishing reels. The schooner "Chantal" was equipped with an echo-sounder in June 1985 and with four reels in September 1986. Until very recently (mid-1988), it remained the only vessel fitted with this equipment.
This report describes analyses undertaken to determine whether equipping the "Chantal" with an echo-sounder and reels had been beneficial in providing increased catch rates and/or catch values. The data available for this purpose were the catch weights, fishing effort and species composition from the records held by the SFA, and fish prices as determined by the Seychelles Marketing Board (SMB).
2.1. Data and Method
The basic data used in this analysis were the mean catch weights (all species) per fishing day for each month (Annex 1). These were available separately for the "Chantal" and the standard fleet.
The standard fleet includes all the vessels in the fleet other than "Chantal" and the few vessels having engines of more than 37 Hp. Roughly twenty boats were represented in each month.
The mean catch weights per fishing day (w/d) were used to estimate the relative fishing power (RFP) of the "Chantal" in each month with reference to the following equation:
where the superscript a refers to the mean catch weights per fishing day including all species and the subscripts c and f refer to the "Chantal" and the standard fleet respectively.
The RFP values were then grouped for the periods when the "Chantal" was without an echo-sounder or reels (P1), with an echo-sounder only (P2), and when equipped with both an echo-sounder and reels (P3). A mean RFP was estimated for like months within each group. These were further grouped into those for the high season months and those for the low season months1 (Table 1).
1 The high season months (September to April) correspond to the northwest monsoon and inter-monsoon periods when the sea is generally calm. At this time, the vessels can be operated on the offshore banks at the edge of the Mahé Plateau, and the catches contain a relatively high proportion of the more valuable snappers (Lutjanidae) and groupers (Serranidae). During the low season, from May to August, the prevailing wind is the southeast monsoon. The sea is generally rough and fishing is largely confined to the sheltered waters adjacent to the main islands (Mahé, Praslin and La Digue) and the more distant Amirantes Plateau. The catches contain a higher proportion of the lower value emperors (Lethrinidae) at this time.
An analysis of variance (one-way classification) and Student's "t" tests were then undertaken to determine whether the mean RFPs between periods for the same season were significantly different.
This was assisted by using the relevant routines within the MICROSTAT library of statistical programmes for micro-computers.
Table 1: Mean RFP values for like months in each period and season (All Species).
|
SEASON |
MONTH |
PERIOD P1 |
PERIOD P2 |
PERIOD P3 |
|
High Season |
September |
1.34 |
1.83 |
1.30 |
|
October |
1.06 |
1.67 |
1.95 |
|
|
November |
1.55 |
2.04 |
1.79 |
|
|
December |
1.25 |
0.72 |
1.53 |
|
|
January |
2.45 |
1.46 |
1.89 |
|
|
February |
1.42 |
1.70 |
2.08 |
|
|
March |
1.74 |
1.28 |
2.61 |
|
|
April |
1.94 |
1.21 |
2.58 |
|
|
|
---- |
---- |
---- |
|
|
Mean |
1.59 |
1.49 |
1.97 |
|
|
Low Season |
May |
1.82 |
0.53 |
2.46 |
|
June |
0.43 |
1.20 |
1.72 |
|
|
July |
2.39 |
1.62 |
1.97 |
|
|
August |
3.09 |
1.25 |
1.42 |
|
|
|
---- |
---- |
---- |
|
|
Mean |
1.93 |
1.15 |
1.89 |
Note: The basic data from which these values were determined are shown in Annex 1.
2.2. Results and Discussion
The results from the statistical analyses are shown in Table 2 for the high and low season months respectively.
Table 2: Results from the ANOVA 1 and Student's "t" tests applied to the mean RFPs for the high season months and low season months separately (All Species).
|
ITEM |
PERIOD |
HIGH SEASON |
LOW SEASON |
|
RFP
|
P1 |
1.59 |
1.93 |
|
P2 |
1.49 |
1.15 |
|
|
P3 |
1.97 |
1.89 |
|
|
RFP difference in %
|
P1 & P2 |
-6.6 |
-40.4 |
|
P2 & P3 |
32.0 |
64.3 |
|
|
P1 & P3 |
23.3 |
-2.1 |
|
|
ANOVA 1 |
|
|
|
|
Probability RHO (%) |
Global |
90.2* |
66.1 |
|
Student's "t" |
|
|
|
|
Probability RHO (%)
|
P1 & P2 |
67.2 |
n.a. |
|
P2 & P3 |
96.6 * |
n.a. |
|
|
P1 & P3 |
96.4 * |
n.a. |
Note: * = Significant; n.a. = not applicable
2.2.1. High Season Months
The results from the ANOVA 1 indicated that the differences between the mean RFPs were significant2. The Student's "t" tests in turn showed that the difference between the means for the periods P1 and P2 was not significant, but that the differences between the means for P2 and P3 and P1 and P3 were significant.
2 The convention used here is that a probability of 90 percent is significant and a difference of 99 percent is highly significant.
In other words, it could not be established that the fitting of an echo-sounder to the "Chantal" had led to any increase in fishing power. The combination of echo-sounder and reels, however, provided significant increases of 32 percent when compared with the "Chantal" fitted with an echo-sounder, and 23 percent when compared with the "Chantal" having neither echo-sounder nor reels.
2.2.2. Low Season Months
The ANOVA 1 results indicated that the means were not significantly different in the low season months, and hence it was decided not to proceed with the Student's "t" tests.
3.1. Data and Method
The analysis was then repeated using the mean catch weights per fishing day for a single species, Lutjanus sebae, locally called "Bourgeois" (Annex 2). This species has a high market value and represents 20 to 30 percent of the annual catches of the schooners.
As before, the mean catches per fishing day (w/d) were used to estimate the relative fishing power of the "Chantal" in each month. The operative equation was:

where the superscript b refers to the mean catch per fishing day including only the "Bourgeois" and the subscripts c and f refer to the "Chantal" and standard fleet respectively.
A mean RFP was estimated for each like month and grouped as previously by period (P1, P2 and P3) and season. These RFP values (shown in Table 3) were used with the ANOVA 1 and Student's "t" tests to determine whether the mean RFPs between periods within each season were significantly different.
Table 3: Mean RFP values for like month in each period and season (Bourgeois).
|
SEASON |
MONTH |
PERIOD P1 |
PERIOD P2 |
PERIOD P3 |
|
High Season
|
September |
0.75 |
0.00 |
2.44 |
|
October |
0.79 |
1.92 |
1.01 |
|
|
November |
1.37 |
2.39 |
1.81 |
|
|
December |
2.52 |
1.17 |
2.50 |
|
|
January |
1.29 |
3.94 |
2.82 |
|
|
February |
1.86 |
1.41 |
3.92 |
|
|
March |
1.55 |
1.19 |
3.83 |
|
|
April |
1.99 |
2.12 |
3.62 |
|
|
Mean |
1.62 |
2.02 |
2.79 |
|
|
Low Season
|
May |
1.55 |
0.00 |
3.72 |
|
June |
1.80 |
0.98 |
0.66 |
|
|
July |
0.00 |
0.00 |
0.00 |
|
|
August |
0.00 |
0.11 |
3.69 |
|
|
Mean |
0.84 |
0.27 |
2.02 |
Note: The basic data from which these values were determined are shown in Annex 2. The September values for the high season months were excluded when estimating the means. This decision was taken due to the absence of "Bourgeois" in the catches for the Period P2 when unusual weather conditions prevailed.
3.2. Results and Discussion
The results of the statistical analyses are shown in Table 4 for the high and low season months respectively.
Table 4: Results from the ANOVA 1 and Student's "t" tests applied to the mean RFPs for the high season and low season months respectively (Bourgeois).
|
ITEM |
PERIOD |
HIGH SEASON |
LOW SEASON |
|
RFP
|
P1 |
1.62 |
0.84 |
|
P2 |
2.02 |
0.27 |
|
|
P3 |
2.79 |
2.02 |
|
|
RFP difference in %
|
P1 & P2 |
24.4 |
-67.9 |
|
P2 & P3 |
37.9 |
648.1 |
|
|
P1 & P3 |
71.6 |
140.5 |
|
|
ANOVA 1 |
|
|
|
|
Probability RHO (%) |
Global |
92.4* |
79.3 |
|
Student's "t" |
|
|
|
|
Probability RHO (%)
|
P1 & P2 |
77.1 |
n.a. |
|
P2 & P3 |
87.3 |
n.a. |
|
|
P1 & P3 |
99.2** |
n.a. |
Note: * = Significant; ** = Highly Significant; n.a. = not applicable
3.2.1. High Season Months
The results of the ANOVA 1 indicated that the differences between the mean RFPs were significant. The Student's "t" tests showed that the difference between the means for the periods P1 and P3 was highly significant, while the difference between the means for the periods P2 and P3 was slightly less than significant. The difference between the means for the periods P1 and P2 was not found to be significant.
Here again, it was not possible to establish that the fitting of an echo-sounder to the "Chantal" had led to any increase in fishing power, while the combination of echo-sounder and reels did produce a highly significant or near significant increase in fishing power. The observed increases were 37.9 percent when compared with the vessel fitted with an echo-sounder only, and 71.6 percent compared with the vessel fitted with neither an echo-sounder nor reels.
These results are very similar to those of the previous section, with the extent of advantage to the "Chantal" from being equipped with both echo-sounder and reels being greater.
3.2.2. Low Season Months
The ANOVA 1 results showed the means not to be significantly different. It was decided not to proceed with undertaking the Student's "t" tests.
4.1. Data and Method
The basic data used in this analysis were the estimates of the mean catch values (all species combined) per fishing day in each month3. As before, these were available for both the "Chantal" and the standard fleet.
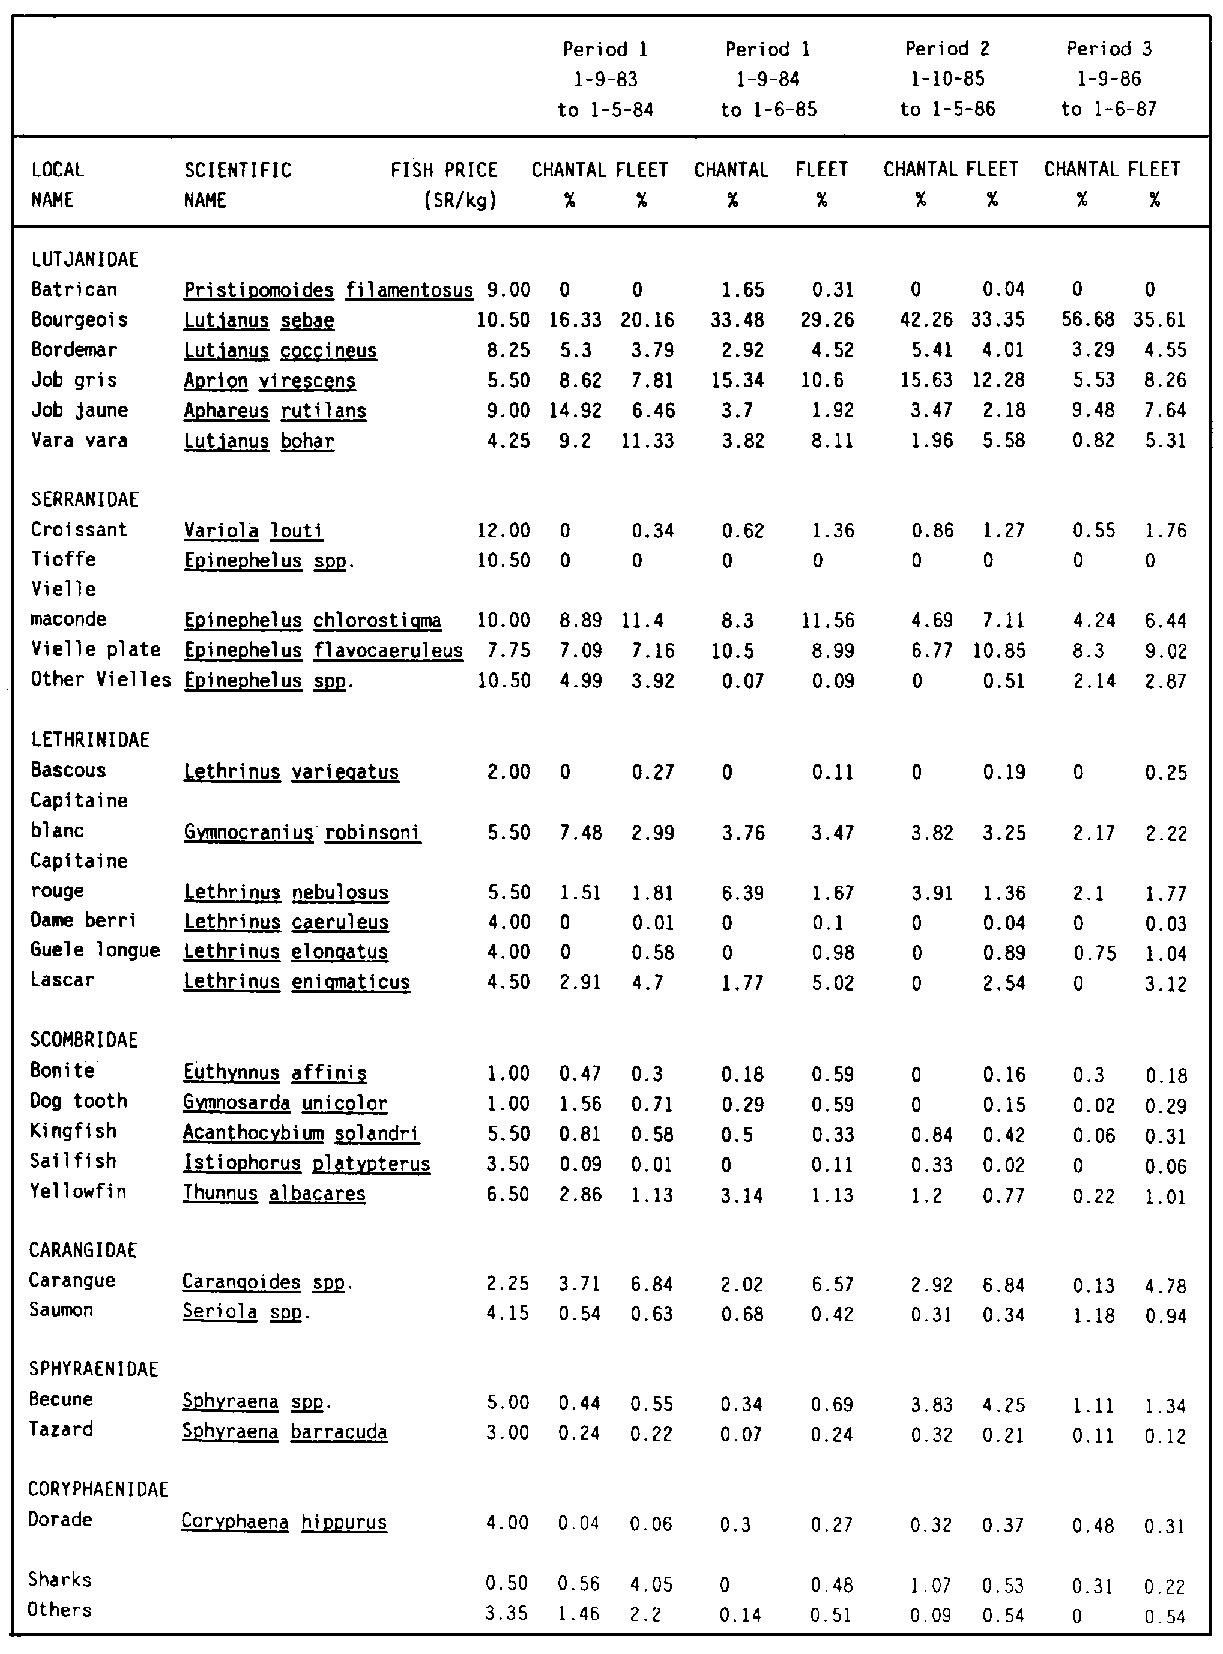
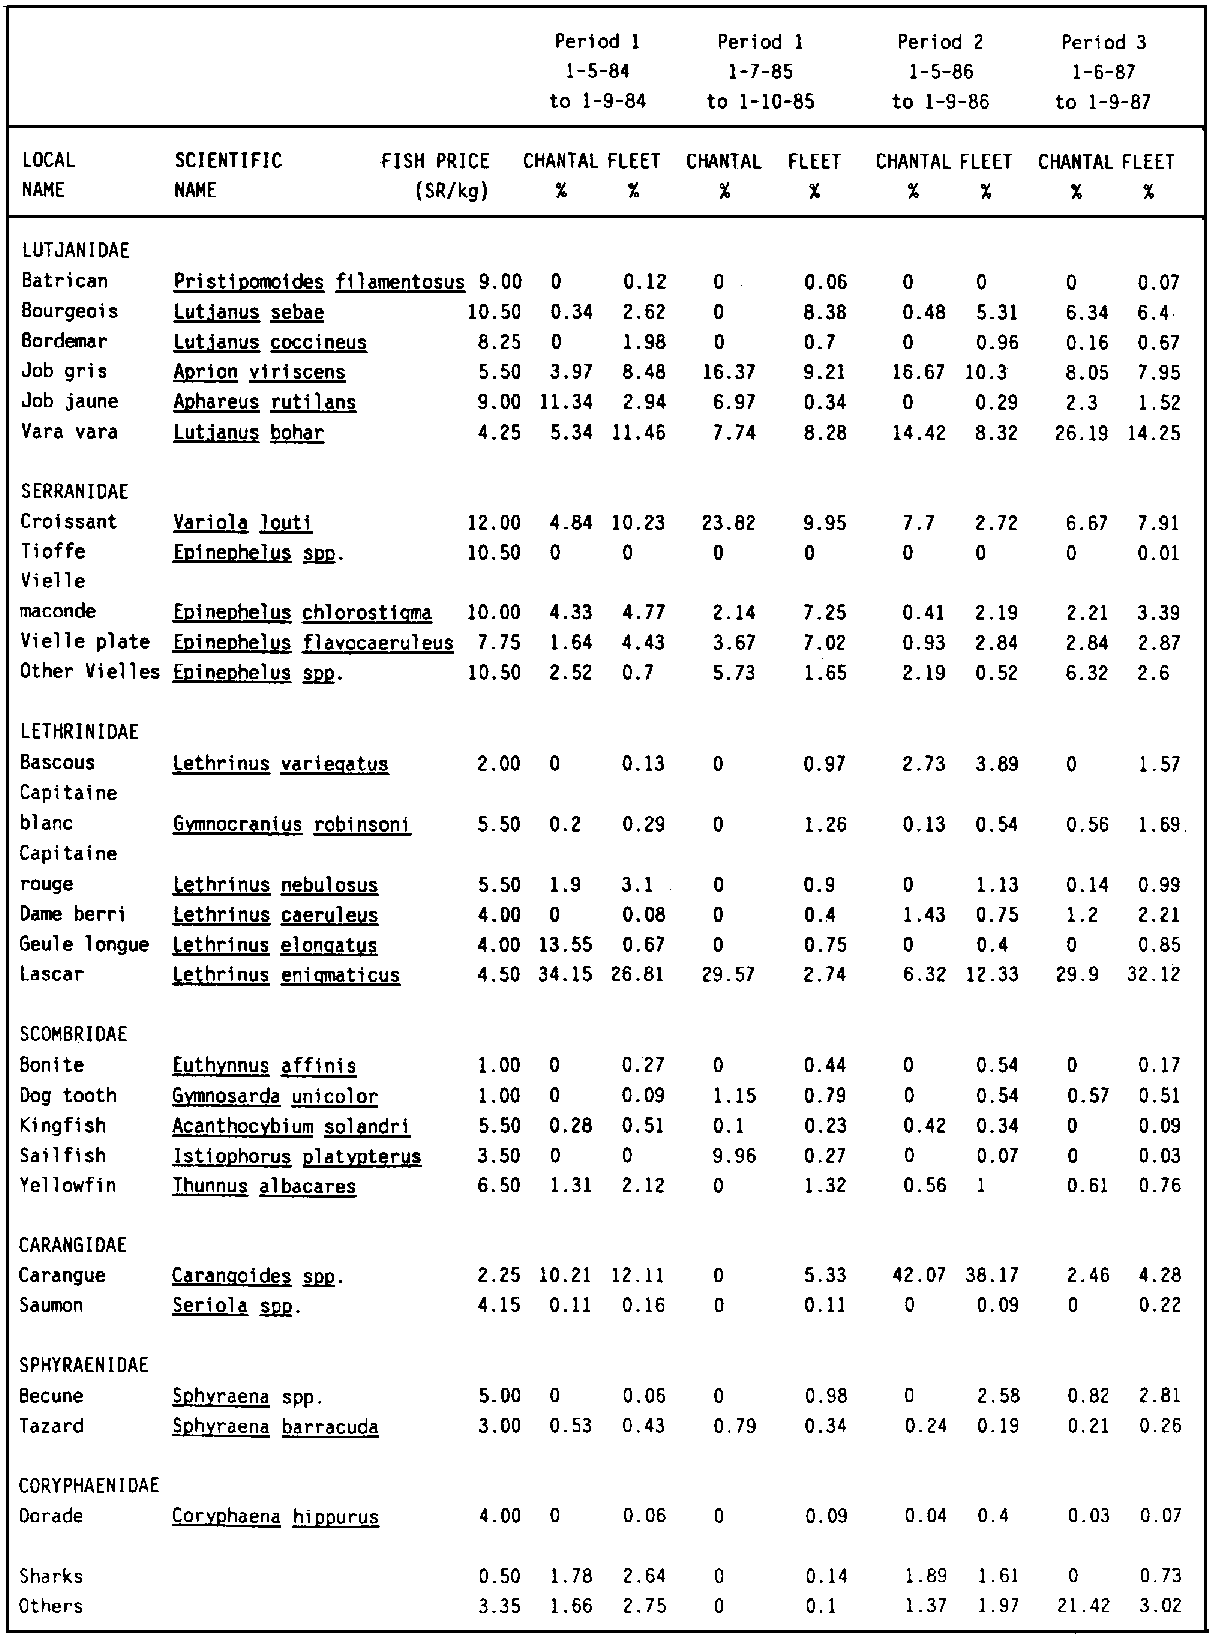
3 Annexes 3 and 4 indicate the species compositions in the catches of the "Chantal" and the standard fleet for each period and season. Also included are the prices of the SMB during 1987 for each species. The differences in the species compositions are reflected by differences in the estimated mean prices per kilogram (all species) shown in Annex 5. These latter prices were used with the data shown in Annex 1 to estimate the mean catch values per fishing day shown in Annex 6.
In an analogy with the method described in the previous sections, the mean catch values per fishing day (v/d) were used to estimate the relative revenue power (RRP) of the "Chantal" in each month. This was done with reference to the following equation:

where the superscript and subscripts have the same meaning as in the earlier sections.
Again, a mean RRP was estimated for each like month and grouped according to season and time period (Table 5). These were used in the ANOVA 1 and Student's "t" tests as before to determine whether there were significant differences between the mean RRPs for each period and season.
Table 5: Mean RRP values for like months in each period and season (all species).
|
SEASON |
MONTH |
PERIOD P1 |
PERIOD P2 |
PERIOD P3 |
|
High Season
|
September |
1.34* |
1.95 |
1.48* |
|
October |
1.06* |
1.78 |
2.22* |
|
|
November |
1.55* |
2.16 |
2.04* |
|
|
December |
1.25* |
0.77 |
1.74* |
|
|
January |
2.47* |
1.55 |
2.15 |
|
|
February |
1.43* |
1.80 |
2.37 |
|
|
March |
1.75* |
1.36 |
2.97 |
|
|
April |
1.95* |
1.28 |
2.93 |
|
|
Mean |
1.60 |
1.58 |
2.24 |
|
|
Low Season
|
May |
1.74* |
0.58 |
2.52 |
|
June |
0.41 |
1.30* |
1.77 |
|
|
July |
2.29 |
1.59* |
2.02 |
|
|
August |
2.96 |
1.37* |
1.46 |
|
|
Mean |
1.85 |
1.21 |
1.94 |
Note: The basic data from which these values were determined are shown in Annex 6. The values marked * are the means of two like months within the same period.
4.2. Results and Discussion
The results from the statistical analysis are shown in Table 6 for the high and low season months respectively.
Table 6: Results from the ANOVA 1 and Student's "t" tests applied to the mean RRPs for the high season and low season months respectively.
|
ITEM |
PERIOD |
HIGH SEASON |
LOW SEASON |
|
RRP
|
P1 |
1.60 |
1.85 |
|
P2 |
1.58 |
1.21 |
|
|
P3 |
2.24 |
1.94 |
|
|
RRP difference in %
|
P1 & P2 |
-1.2 |
-34.6 |
|
P2 & P3 |
41.5 |
60.3 |
|
|
P1 & P3 |
39.8 |
4.9 |
|
|
ANOVA 1 |
|
|
|
|
Probability RHO (%) |
Global |
98.3* |
66.1 |
|
Student's "t" |
|
|
|
|
Probability RHO (%)
|
P1 & P2 |
53.0 |
n.a. |
|
P2 & P3 |
97.9* |
n.a. |
|
|
P1 & P3 |
99.4** |
n.a. |
Note: * = Significant; ** = Highly Significant; n.a. = not applicable
4.2.1. High Season Months
The results from applying the ANOVA 1 indicated that the differences between the mean RRPs were significant. The Student's "t" tests showed that the difference between the means for the periods P1 and P3 and for the periods P2 and P3 were significant or highly significant. As before, it was not possible to show a significant difference between the means for the periods P1 and P2.
As such, it could not be established that outfitting the "Chantal" with an echo-sounder was beneficial. The combination of echo-sounder and reels, on the other hand, produced a significant or highly significant increase in RRP compared both with the vessel fitted with an echo-sounder only and when fitted with neither an echo-sounder nor reels. The observed increases in mean RRPs were 41.5 percent and 39.8 percent respectively.
4.2.2. Low Season Months
The ANOVA 1 results showed that the means were not significantly different, from which it was decided not to proceed with undertaking the Student's "t" tests.
5.1. Data and Method
The observed mean catch weights (all species) per vessel in the standard fleet for each month were used to estimate a mean value of the catch per standard vessel for each month. This was done by multiplying the catch weights per vessel by the relevant prices given in Annex 5.
A set of hypothetical catch values per standard vessel in each month was determined on the basis of the vessel having been fitted with an echo-sounder and reels at the beginning of September 1983. This was done by increasing the catch values per vessel by 39.8 percent for each month of the high season only. This value is the percentage difference in RRPs for the periods P1 and P3 in the high season months (Table 6).
5.2. Results and Discussion
The results from these calculations are shown in Table 7. The annual increase in gross revenues which could be attributed to fitting a standard vessel with an echo-sounder and reels were 31 percent (September 1983 to August 1984), 30.2 percent (September 1984 to August 1985), 28.8 percent (September 1985 to August 1986) and 31.5 percent (September 1986 to August 1987).
Table 7: Hypothetical catch values before and after equipping the standard vessel with echo-sounder and reels.
|
Month |
Catch of standard vessel (kg) |
Fish price (SR/kg) |
A |
RRP index |
B |
A-B |
|
Sep 83 |
822 |
7.46 |
6,132 |
1.398 |
8,572 |
2,440 |
|
Oct 83 |
2,154 |
7.46 |
16,069 |
1.398 |
22,464 |
6,395 |
|
Nov 83 |
1,882 |
7.46 |
14,040 |
1.398 |
19,627 |
5,587 |
|
Dec 83 |
1,689 |
7.46 |
12,600 |
1.398 |
17,614 |
5,014 |
|
Jan 84 |
1,181 |
7.46 |
8,810 |
1.398 |
12,316 |
3,506 |
|
Feb 84 |
1,115 |
7.46 |
8,318 |
1.398 |
11,628 |
3,310 |
|
Mar 84 |
1,603 |
7.46 |
11,958 |
1.398 |
16,717 |
4,759 |
|
Apr 84 |
1,221 |
7.46 |
9,109 |
1.398 |
12,733 |
3,625 |
|
Sub-total |
11,667 |
|
87,036 |
|
121,676 |
34,640 |
|
May 84 |
1,366 |
5.69 |
7,773 |
1.000 |
7,772 |
0 |
|
Jun 84 |
1,036 |
5.69 |
5,895 |
1.000 |
5,894 |
0 |
|
Jul 84 |
831 |
5.69 |
4,728 |
1.000 |
4,728 |
0 |
|
Aug 84 |
1,127 |
5.69 |
6,413 |
1.000 |
6,412 |
0 |
|
Sub-total |
4,360 |
|
24,808 |
|
24,808 |
0 |
|
Total |
16,027 |
|
111,844 |
|
146,484 |
34,640 |
|
Sep 84 |
1,174 |
7.46 |
8,763 |
1.398 |
12,250 |
3,488 |
|
Oct 84 |
1,588 |
7.46 |
11,848 |
1.398 |
16,563 |
4,715 |
|
Nov 84 |
1,274 |
7.46 |
9,506 |
1.398 |
13,290 |
3,784 |
|
Dec 84 |
1,182 |
7.46 |
8,820 |
1.398 |
12,330 |
3,510 |
|
Jan 85 |
2,009 |
7.46 |
14,989 |
1.398 |
20,954 |
5,966 |
|
Feb 85 |
716 |
7.46 |
5,339 |
1.398 |
7,464 |
2,125 |
|
Mar 85 |
1,818 |
7.46 |
13,565 |
1.398 |
18,964 |
5,399 |
|
Apr 85 |
1,663 |
7.46 |
12,404 |
1.398 |
17,341 |
4,937 |
|
Sub-total |
11,425 |
|
85,233 |
|
119,155 |
33,923 |
|
May 85 |
1,565 |
5.69 |
8,904 |
1.000 |
8,904 |
0 |
|
Jun 85 |
865 |
5.36 |
4,635 |
1.000 |
4,635 |
0 |
|
Jul 85 |
1,527 |
5.36 |
8,186 |
1.000 |
8,186 |
0 |
|
Aug 85 |
967 |
5.36 |
5,182 |
1.000 |
5,182 |
0 |
|
Sub-total |
4,924 |
|
26,906 |
|
26,906 |
0 |
|
Total |
16,349 |
|
112,139 |
|
146,062 |
33,923 |
|
Sep 85 |
1,491 |
7.57 |
11,290 |
1.398 |
15,783 |
4,493 |
|
Oct 85 |
1,154 |
7.57 |
8,737 |
1.398 |
12,214 |
3,477 |
|
Nov 85 |
812 |
7.57 |
6,148 |
1.398 |
8,595 |
2,447 |
|
Dec 85 |
0 |
7.57 |
0 |
1.398 |
0 |
0 |
|
Jan 86 |
1,804 |
7.57 |
13,663 |
1.398 |
19,100 |
5,438 |
|
Feb 86 |
1,039 |
7.57 |
7,871 |
1.398 |
11,004 |
3,133 |
|
Mar 86 |
2,256 |
7.57 |
17,085 |
1.398 |
23,885 |
6,800 |
|
Apr 86 |
2,194 |
7.57 |
16,612 |
1.398 |
23,223 |
6,612 |
|
Sub-total |
10,753 |
|
81,405 |
|
113,804 |
32,399 |
|
May 86 |
1,632 |
5.36 |
8,749 |
1.000 |
8,749 |
0 |
|
Jun 86 |
1,013 |
5.36 |
5,433 |
1.000 |
5,432 |
0 |
|
Jul 86 |
2,139 |
5.36 |
11,466 |
1.000 |
11,466 |
0 |
|
Aug 86 |
976 |
5.36 |
5,236 |
1.000 |
5,236 |
0 |
|
Sub-total |
5,761 |
|
30,884 |
|
30,884 |
0 |
|
Total |
16,515 |
|
112,289 |
|
144,689 |
32,399 |
|
Sep 86 |
2,333 |
8.04 |
18,758 |
1.398 |
26,223 |
7,466 |
|
Oct 86 |
2,823 |
8.04 |
22,694 |
1.398 |
31,726 |
9,032 |
|
Nov 86 |
3,022 |
8.04 |
24,298 |
1.398 |
33,968 |
9,670 |
|
Dec 86 |
1,642 |
8.04 |
13,205 |
1.398 |
18,461 |
5,256 |
|
Jan 87 |
1,756 |
8.04 |
14,117 |
1.398 |
19,735 |
5,618 |
|
Feb 87 |
2,507 |
8.04 |
20,153 |
1.398 |
28,173 |
8,021 |
|
Mar 87 |
1,983 |
8.04 |
15,940 |
1.398 |
22,284 |
6,344 |
|
Apr 87 |
1,864 |
8.04 |
14,988 |
1.398 |
20,953 |
5,965 |
|
Sub-total |
17,929 |
|
144,151 |
|
201,523 |
57,372 |
|
May 87 |
1,935 |
5.77 |
11,166 |
1.000 |
11,166 |
0 |
|
Jun 87 |
1,652 |
5.77 |
9,533 |
1.000 |
9,533 |
0 |
|
Jul 87 |
1,547 |
5.77 |
8,924 |
1.000 |
8,924 |
0 |
|
Aug 87 |
1,413 |
5.77 |
8,154 |
1.000 |
8,154 |
0 |
|
Sub-total |
6,547 |
|
37,777 |
|
37,777 |
0 |
|
Total |
24,476 |
|
181,928 |
|
239,300 |
57,372 |
The major conclusions from the analyses are that outfitting the "Chantal" with the combination of an echo-sounder and reels was associated with:
(i) an increase in fishing power (all species) during the high season months of roughly 25 to 30 percent (Table 2);(ii) an increase in gross revenue earning power (all species) during the high season months of about 40 percent (Table 6); and
(iii) an increase in annual gross revenue earning power (all species) of about 30 percent (Section 5.2).
The failure of the analyses to show significant benefit from the fitting of "Chantal" with an echo-sounder only was somewhat surprising. It had been expected that the use of an echo-sounder would have led to increased catch rates, particularly in respect to the higher value demersal species, as the consequence of the fishermen being more able to efficiently locate their vessels on the productive fishing grounds.
There are several possible explanations for the latter result. It may have been, for example, that the echo-sounder alone was beneficial, but that this could not be proven due to the masking effect of errors in the data. Another possibility is that during period P2 the crew of the "Chantal" was learning how to use the echo-sounder, and hence not taking full benefit of its potential to increase catch rates. The fact that most of the fishing is done while the boat is drifting may also tend to lessen the usefulness of an echo-sounder.
The analyses reported here do not allow any conclusion about the relative importance of the echo-sounder and reels in respect to their contributions to the increased fishing power and revenue earning power. For this, it would have been necessary to have data for a time period during which the "Chantal" was fitted with the reels only. There was no such occasion.
Whatever the importance of the reels, they should normally enable the gear to be more quickly retrieved from the seabed. This attribute is presumably most beneficial (in leading to increased catch rates) when there are many retrievals per fishing day. They also allow the use of a heavier sinker, so that the lines fish more vertically.
A more direct way to investigate this matter would be to measure the time taken for each fishing operation (e.g. retrieving the gear, removing the fish, baiting, returning the gear to the seabed, etc.) and the number of retrievals per day, before and after the installation of the reels. Such data were not collected.
A complicating factor which has not been previously mentioned is the use of round-shanked hooks (tuna-circle hooks) on the "Chantal" in combination with the reels. In respect to both the standard fleet and the "Chantal" prior to its outfitting with reels, the normal straight-shanked hooks were used.
It is generally accepted that in the process of being caught, fish have greater difficulties in dislodging the round-shanked hooks. If this is correct in respect to the fishing with the "Chantal", then presumably some of the observed increase in fishing power (from fitting an echo-sounder and reels) could be attributed to the use of these hooks. The available data does not allow the extent of the possible contribution to be measured.
The increase in gross revenue earning power of the "Chantal" (from fitting an echo-sounder and reels) during the high season months is some 10 to 15 percent greater than the increase in fishing power (all species). This can readily be explained as a consequence of the change of species composition in the catches towards a greater proportion of higher value species. The estimated increase in relative price per kilogramme is in fact roughly 13 percent (=(((9.16/8.04)/(7.51/7.46)) - 1)100; Annex 5) between periods P1 and P3.
The increased fishing power during the high season months (from fitting the "Chantal" with an echo sounder and reels) is also greater for the high value "Bourgeois". An additional implication from this result is that, for some species, there was relatively little or no increase in fishing power attributable to the installation of echo-sounder and reels. Presumably, pelagic species would be included in these categories.
Most of the comments so far have concerned the effects during the high season months. In respect to the low season months, it was not possible to establish any increase in fishing power (or gross revenue earnings) from installing the echo-sounder, either alone or in combination with the reels. The author was advised that, in fact, the skipper of the "Chantal" chose not to use the reels during the low season months, in which case the results obtained here are not surprising.
The costs to the skipper of the "Chantal" from installing the four electric reels (including batteries, dynamo, rheostat and installation) was reported as SR 26,320, plus SR 4,000 for the purchase and installation of the echo-sounder. Assuming the hypothetical situation portrayed in Section 5, these costs would have been recouped (in respect to the standard vessel) in about seven high season months (or less) from the increased gross revenue earnings. This very superficial treatment however, ignores the ongoing costs (e.g. fuel, maintenance and depreciation) which would need to be included in any proper consideration of the economic benefits of outfitting vessels with echo-sounders and reels.
Finally, it is necessary to comment that, while the installation of the echo-sounder and reels increased the fishing power (and gross revenue earning power) of the "Chantal" compared to the other schooners, this short-term effect does not necessarily lead to the conclusion that all (or most) of the vessels should be fitted with these gears. In the event of the fish stocks already being fully exploited, for example, there would be little or no potential to increase the overall catches. In such a case the long-term effect of outfitting the total fleet with these items would merely increase the fishery costs (and reduce the economic yield).
In fact as indicated at the beginning of this paper, the preliminary findings from resource assessments is that the present catch of handline species is about one third of the potential yield. When considering just the "Bourgeois", the mean fleet catch for the years between 1981 and 1986 was 197 tonnes compared to the estimated potential yield for that species of around 380 tonnes (Lablache et al, 1988). This has relevance in the context that fitting an echo-sounder and reels improved "Chantal's" fishing power in respect to this species. In view of the potential to improve yields, it would seem reasonable to expect benefit to the schooner fleet as a whole from equipping more of the boats with echo-sounder and reels.
Johnsen, T. (1985)., Simulations of the profit potential for different boat types introduced as a supplement to or replacement for the schooner fleet of Seychelles. FAO/UNDP: RAF/79/065/WP/25/85/E: 24 p.
Lablache, G. and G. Carrara (1984)., Schooner handlining in Seychelles. FAO/UNDP: RAF/79/065/WP/14/84/E: 41 p.
Lablache, G. and G. Carrara (1988), Population Dynamics of Emperor Red Snapper (Lutjanus sebae), with Notes on the Demersal Fishery on the Mahé Plateau, Seychelles, In. Contributions to Tropical Fisheries Biology., FAO Fisheries Report No. 389, FIRM/R389: 171-192 p.
Lablache, G., G. de Moussac and N. Jivan Shah (1988)., Summary description of the artisanal fisheries and resources for the Seychelles. In. Proceedings of the Workshop on the Assessment of Fishery Resources in the Southwest Indian Ocean. FAO/UNDP: RAF/79/065/WP/41/88/E: 147-180 p.
Parker, D. (1988)., The Future of the Schooner Fishery: Problems of Financial Viability and Recruitment of Fishermen. FAO/UNDP: RAF/87/008/WP/45/88/E: 23 p.
ANNEX 1 - Mean Catch Weights per Fishing Day and Relative Fishing Powers for each month (All Species)
|
Month
|
|
Catch Weights per Fishing Day (kg/d) |
RFP
|
|
|
Fleet |
Chantal |
|||
|
Period P1
|
September '83 |
104.9 |
184.8 |
1.76 |
|
October |
200.1 |
288.4 |
1.44 |
|
|
November |
167.7 |
315.4 |
1.88 |
|
|
December |
186.9 |
232.7 |
1.25 |
|
|
January '84 |
190.8 |
467.8 |
2.45 |
|
|
February |
192.8 |
247.6 |
1.28 |
|
|
March |
191.3 |
187.4 |
0.98 |
|
|
April |
159.3 |
313.2 |
1.97 |
|
|
May |
157.1 |
307.9 |
1.96 |
|
|
June |
141.8 |
60.7 |
0.43 |
|
|
July |
70.6 |
168.7 |
2.39 |
|
|
August |
125.9 |
388.8 |
3.09 |
|
|
September |
147.3 |
133.7 |
0.91 |
|
|
October |
147.2 |
99.9 |
0.68 |
|
|
November |
213.3 |
259.3 |
1.22 |
|
|
December |
396.9 |
no fishing |
|
|
|
January '85 |
198.6 |
no fishing |
|
|
|
February |
127.2 |
198.2 |
1.56 |
|
|
March |
201.4 |
502.4 |
2.49 |
|
|
April |
188.7 |
362.6 |
1.92 |
|
|
May |
161.5 |
271.2 |
1.68 |
|
|
Period P2
|
June |
200.9 |
243.7 |
1.21 |
|
July |
111.1 |
222.2 |
2 |
|
|
August |
111.4 |
127.1 |
1.14 |
|
|
September |
126.3 |
231.6 |
1.83 |
|
|
October |
128.1 |
214.1 |
1.67 |
|
|
November |
129.8 |
264.5 |
2.04 |
|
|
December |
152.6 |
110.5 |
0.72 |
|
|
January '86 |
263.3 |
384 |
1.46 |
|
|
February |
265.4 |
450 |
1.7 |
|
|
March |
216.4 |
277.7 |
1.28 |
|
|
April |
252.7 |
305.6 |
1.21 |
|
|
May |
321.4 |
171.9 |
0.53 |
|
|
June |
186.4 |
222.8 |
1.2 |
|
|
July |
233.1 |
286.9 |
1.23 |
|
|
August |
155.8 |
212.2 |
1.36 |
|
|
Period P3
|
September |
237.4 |
271.4 |
1.14 |
|
October |
211.4 |
332 |
1.57 |
|
|
November |
268.8 |
469.8 |
1.75 |
|
|
December |
213.8 |
397.1 |
1.86 |
|
|
January '87 |
179.9 |
340.3 |
1.89 |
|
|
February |
234.4 |
486.8 |
2.08 |
|
|
March |
254.4 |
663.7 |
2.61 |
|
|
April |
227.4 |
585.5 |
2.58 |
|
|
May |
224.8 |
552.1 |
2.46 |
|
|
June |
189.7 |
326.6 |
1.72 |
|
|
July |
200.9 |
395.3 |
1.97 |
|
|
August |
180.2 |
256 |
1.42 |
|
|
September |
151.9 |
222.3 |
1.46 |
|
|
October |
208.3 |
485.5 |
2.33 |
|
|
November |
176.3 |
324.4 |
1.84 |
|
|
December |
215.1 |
259.2 |
1.2 |
|
ANNEX 2 - Mean Catch Weights per Fishing Day and Relative Fishing Powers for each month (Bourgeois)
|
Month |
|
Catch Weights per Fishing Day (kg/d) |
RFP
|
|
|
Fleet |
Chantal |
|||
|
Period P1
|
September '83 |
33.7 |
34.9 |
1.04 |
|
October |
33.2 |
28.9 |
0.87 |
|
|
November |
23.5 |
11.8 |
0.5 |
|
|
December |
18.3 |
46.1 |
2.52 |
|
|
January '84 |
27.9 |
36.1 |
1.29 |
|
|
February |
35.9 |
39.3 |
1.09 |
|
|
March |
68.7 |
51.0 |
0.74 |
|
|
April |
36.8 |
82.4 |
2.24 |
|
|
May |
2.8 |
1.8 |
0.64 |
|
|
June |
5.0 |
1.8 |
0.36 |
|
|
July |
2.4 |
0 |
0 |
|
|
August |
25.7 |
0 |
0 |
|
|
September |
64.1 |
30.4 |
0.47 |
|
|
October |
57.7 |
41.0 |
0.71 |
|
|
November |
48.3 |
108.0 |
2.24 |
|
|
December |
35.1 |
no fishing |
|
|
|
January '85 |
38.9 |
no fishing |
|
|
|
February |
23.9 |
62.9 |
2.63 |
|
|
March |
79.3 |
186.9 |
2.36 |
|
|
April |
70.6 |
122.5 |
1.74 |
|
|
May |
24.3 |
59.6 |
2.45 |
|
|
Period P2
|
June |
26.1 |
50.9 |
1.95 |
|
July |
7.1 |
0 |
0 |
|
|
August |
4.2 |
0 |
0 |
|
|
September |
17.3 |
0 |
0 |
|
|
October |
50.6 |
97.2 |
1.92 |
|
|
November |
50.2 |
120.0 |
2.39 |
|
|
December |
16.1 |
18.9 |
1.17 |
|
|
January '86 |
30.9 |
121.8 |
3.94 |
|
|
February |
89.0 |
125.7 |
1.41 |
|
|
March |
83.7 |
99.2 |
1.19 |
|
|
April |
95.7 |
202.5 |
2.12 |
|
|
May |
27.7 |
0 |
0 |
|
|
June |
8.7 |
0 |
0 |
|
|
July |
2.5 |
0 |
0 |
|
|
August |
10.9 |
2.4 |
0.22 |
|
|
Period P3
|
September |
57.4 |
143.0 |
2.49 |
|
October |
79.5 |
156.0 |
1.96 |
|
|
November |
92.5 |
249.0 |
2.69 |
|
|
December |
90.4 |
260.0 |
2.88 |
|
|
January '87 |
61.5 |
173.7 |
2.82 |
|
|
February |
86.2 |
337.7 |
3.92 |
|
|
March |
92.1 |
356.6 |
3.83 |
|
|
April |
95.9 |
346.9 |
3.62 |
|
|
May |
76.4 |
284.0 |
3.72 |
|
|
June |
3.5 |
2.3 |
0.66 |
|
|
July |
13.4 |
0 |
0 |
|
|
August |
20.1 |
74.2 |
3.69 |
|
|
September |
47.9 |
114.0 |
2.38 |
|
|
October |
83.8 |
5.3 |
0.06 |
|
|
November |
41.2 |
37.9 |
0.92 |
|
|
December |
15.4 |
32.7 |
2.12 |
|
ANNEX 5 - Mean Prices by Period and Season Estimated for Each of the "Chantal" and Standard Fleet (All Species).
|
SEASON |
PERIOD P1 |
PERIOD P2 |
PERIOD P3 |
|||
|
"CHANTAL" |
FLEET |
"CHANTAL" |
FLEET |
"CHANTAL" |
FLEET |
|
|
High Season |
7.51 |
7.46 |
8.04 |
7.57 |
9.16 |
8.04 |
|
Low Season |
5.46 |
5.69 |
5.77 |
5.36 |
5.93 |
5.77 |
Note: All values are in units of SR/kg.
ANNEX 6 - Mean Catch Values per Fishing Day and Relative Revenue Powers in each month (All species)
|
Month
|
|
Catch Fishing Weights per Day (kg/d) |
RRP
|
|
|
Fleet |
Chantal |
|||
|
Period P1
|
September '83 |
782.6 |
1,387.8 |
1.77 |
|
October |
1,492.7 |
2,165.9 |
1.45 |
|
|
November |
1,251.0 |
2,368.7 |
1.89 |
|
|
December |
1,394.3 |
1,747.6 |
1.25 |
|
|
January '84 |
1,423.4 |
3,513.2 |
2.47 |
|
|
February |
1,438.3 |
1,859.5 |
1.29 |
|
|
March |
1,427.1 |
1,407.4 |
0.99 |
|
|
April |
1,188.4 |
2,352.1 |
1.98 |
|
|
May |
893.9 |
1,681.1 |
1.88 |
|
|
June |
806.8 |
331.4 |
0.41 |
|
|
July |
401.7 |
921.1 |
2.29 |
|
|
August |
716.4 |
2,122.8 |
2.96 |
|
|
September |
1,098.9 |
1,004.1 |
0.91 |
|
|
October |
1,098.1 |
750.2 |
0.68 |
|
|
November |
1,591.2 |
1,947.3 |
1.22 |
|
|
December |
2,960.9 |
no fishing |
|
|
|
January '85 |
1,481.6 |
no fishing |
|
|
|
February |
948.9 |
1,488.5 |
1.57 |
|
|
March |
1,502.4 |
3,773.0 |
2.51 |
|
|
April |
1,407.7 |
2,723.1 |
1.93 |
|
|
May |
918.9 |
1,480.8 |
1.61 |
|
|
Period P2
|
June |
1,076.8 |
1,406.1 |
1.31 |
|
July |
595.5 |
1,282.1 |
2.15 |
|
|
August |
597.1 |
733.4 |
1.23 |
|
|
September |
956.1 |
1,862.1 |
1.95 |
|
|
October |
969.7 |
1,721.4 |
1.78 |
|
|
November |
982.6 |
2,126.6 |
2.16 |
|
|
December |
1,155.2 |
888.4 |
0.77 |
|
|
January '86 |
1,993.2 |
3,087.4 |
1.55 |
|
|
February |
2,009.1 |
3,618.0 |
1.8 |
|
|
March |
1,638.1 |
2,232.7 |
1.36 |
|
|
April |
1,912.9 |
2,457.0 |
1.28 |
|
|
May |
1,722.7 |
991.9 |
0.58 |
|
|
June |
999.1 |
1,285.6 |
1.29 |
|
|
July |
1,249.4 |
1,655.4 |
1.32 |
|
|
August |
835.1 |
1,224.4 |
1.47 |
|
|
Period P3
|
September |
1,908.7 |
2,486.0 |
1.3 |
|
October |
1,699.7 |
3,041.1 |
1.79 |
|
|
November |
2,161.2 |
4,303.4 |
1.99 |
|
|
December |
1,719.0 |
3,637.4 |
2.12 |
|
|
January '87 |
1,446.4 |
3,117.1 |
2.15 |
|
|
February |
1,884.6 |
4,459.1 |
2.37 |
|
|
March |
2,045.4 |
6,079.5 |
2.97 |
|
|
April |
1,828.3 |
5,363.2 |
2.93 |
|
|
May |
1,297.1 |
3,274.0 |
2.52 |
|
|
June |
1,094.6 |
1,936.7 |
1.77 |
|
|
July |
1,159.2 |
2,344.1 |
2.02 |
|
|
August |
1,039.8 |
1,518.1 |
1.46 |
|
|
September |
1,221.3 |
2,036.3 |
1.67 |
|
|
October |
1,674.7 |
4,447.2 |
2.66 |
|
|
November |
1,417.5 |
2,971.5 |
2.1 |
|
|
December |
1,729.4 |
2,374.3 |
1.37 |
|
![]()
![]()