Activities related to the terms of reference
The consultant implemented a database system in order to allow for the data compiled since 1993 to be organized in computer files. NARA staff initiated the data entry process, which allowed testing and refinement of the system during the consultant stay. The completion of the data entry process, which should precede any final data analysis, will take five to six months with full-time dedication of the staff involved. A preliminary bio-economic model was set up, although more complete analysis will have to be completed once the data is available in the computer, and once the results of a parallel survey currently undergoing, can be brought on for further support.
The continental shelf of Sri Lanka is relatively narrow, the surface area being 30,000 sq. km, equivalent to about 6% of the EEZ of the country. The shelf and the slope areas are rich in demersal finfish resources (e.g. snappers, emperors and groupers). Demersal finfish production reached 40,000 t in the early 1980's, equivalent to half of the 80,000 t potential yield estimate. It has declined since then, mainly due to civil disturbances in the north and east, areas that previously contributed over 80% of the demersal finfish landed. Of the annual coastal fish production of 157,500 t, demersal fish now contribute about 7,000 t.
Demersal fishing in Sri Lanka is still practised at an artisanal level. A variety of small crafts are engaged using different gears and gear combinations. Except in the north coast and at few places such as Chilaw, Negombo, and Hambanthota the fishing for demersal fish is done only seasonally. Several trawl surveys have been conducted in the past to study the abundance and distribution of demersal resources. These were of limited use in the sense that they provided data only for the species vulnerable to capture by trawling. The existing fisheries mainly involve the use of handline gear.
NARA commenced a comprehensive sampling programme to monitor the demersal finfish landings in May 1993, covering the important demersal fishing areas along the western and southern coasts. Its objective was to provide a more representative sampling (than that from trawl surveys) to determine exploitation levels, and to identify potential resources. The sampling is carried out for two days at fortnightly intervals (i.e. four days/month) at each of seven principal landing sites (Chilaw, Negombo, Beruwala, Weligama, Kudawella, Hambanthota and Kirinda). One research officer and four trained research assistants, are engaged in these activities. The sampling programme has collected information on fishing effort, fishing gear, biological data, and economic data (limited to some fisheries operated in west).
The need to organise a computerised repository of this information and to build a bio-economic model of the fisheries involved motivated the request for this consultancy under the framework of the Project SRL/91/022.
The Terms of Reference list the development and application of a bio-economic model of the demersal fishery as he prime objective of the consultancy. For this purpose, however, data on the performance of the fishery in past years is required. Such information is available at NARA covering a period going back to 1993, but .the data were only available as paper records and had not been entered into computer files Therefore, the first task of the consultant was to establish a computerised database that NARA staff could use as a regular tool for the entry, maintenance and reporting of the data collected by the sampling programs. In this way, the information collected would be structured in computer files suitable for access by the model.
In relation to this task, it came to the attention of the consultant that a unified system for the collection and reporting of fishery statistics (ARTFISH) had been proposed and it is currently being implemented in Sri Lanka with assistance from the Fisheries Information, Data and Statistics Division, Fisheries Department, FAO (FIDI). After a review of the status of the implementation of ARTFISH at the time, the decision was made that an independent demersal database (DDB) was necessary at least until ARTFISH is fully operational. This is because of the immediate need for entering the existing data, and the fact that some ARTFISH modules (like those required for the storage of length-frequency distributions) will not be available in the short term.
This action is not detrimental of a future conversion of the DDB to ARTFISH. As discussed in the Appendix I, the DDB was designed while keeping in mind that, in the future, it will desirable to merge it with the ARTFISH system. It is to be noted that such a conversion will not require a significant effort as both ARTFISH and the DDB are based on the same basic principles and software.
The DDB includes procedures to carry out data entry and a basic level of reporting and was tested to the extent possible given the short amount of time available. More sophisticated (and useful) level of reporting will need to be developed once the DDB is fully tested. Further data entry verification procedures would also be useful in the future.
Implementing the DDB was only the first (albeit crucial) part of the work. The main objective was to leave a system that would enable NARA staff to recover from a four-year backlog in the data entry in a short period of time. In this respect, it has been estimated that four to six months of work will be necessary to eliminate the backlog of data. Given the amount of data to be entered, it is recommended that additional personnel is either hired or assigned temporarily to the task of data entry.
In general, NARA capabilities regarding data entry and processing should be strengthened. More specifically, NARA would benefit from the hiring of a person with experience in programming, use of statistical methods and database management, an area of expertise that is crucial to data analysis. For example, such a person could have supported the work related to the DDB that was carried out by the consultant leaving more time for the modeling exercise. In the long term, the development of local expertise at NARA seems a more cost-effective solution and one that would reinforce the institutional ability to execute this and future projects.
The design, implementation and testing of the database extended through most of the consultant's stay. However, this task was a first priority given the need to eliminate the extensive backlog of data. Leaving a functional database gave the opportunity to the staff of NARA to focus their efforts on entering the data over the next few months. The consultant trained the staff in the use of the database for data entry and reporting, and provided an overview of how to connect the database results with GIS software available at NARA to provide mapping facilities.
Before developing an analytic model, it is necessary to document the scope of the data available for the exercise. As its name suggests, a bio-economic model provides a way to predict the future economic performance of the fishery on the basis of the current status and productivity of the resource and some assumptions about future economic responses. Therefore, it requires the analysis of data from two different sources, as follows:
a) To predict future yields, biological data on the species exploited is necessary, as well as data on fishing effort. The scope of the biological data depends on the technique used for the yield assessment. One option is to fit data from catch rates at different levels of fishing effort to a simple production model. In this approach, only data on total catch and effort (and possibly an index of abundance) are required. This analysis can be done on separate species or on a set of species combined but it requires several years of data to produce reliable results. An alternative option, is to perform a yield-per-recruit analysis where the yield to be expected from any group of fish born at the same time is estimated for a particular level of fishing effort or age- or size-at-entry in the fishery. This approach requires estimates of fishing mortality that could be estimated by the numbers of fish caught by size (assuming the population is in equilibrium) and estimates of growth in weight. It also requires knowledge of the rate of natural mortality. This basic set of data is usually collected directly by port samplers and fishery biologists.
b) To assess the economic well being of the fishermen associated with each future yield, data about the economic performance of the fishery is required. A set of assumptions about the future evolution of this performance is also needed. The data required include price per unit weight landed (and evolution of price related to future market demand), operational costs (fuel, ice, salary costs of the crew, maintenance of gear, insurance, etc.), the amount of the initial investment, depreciation costs, as well as any financial costs associated with initial investments. These data could be collected through dedicated surveys, usually the responsibility of an economic department or, less frequently, through the same samplers collecting the information.
What follows is a review of the data situation at the time the consultant arrived to Sri Lanka.
The collection of biological data has been, to date, partially sufficient to produce a reliable estimate of productivity, limiting to some extent the applicability of the mathematical models available.
With respect to the two basic approaches mentioned above, the application of a production model approach has to be discouraged, for a number of reasons. First, data on catches and effort have to be available for a long period of time for the productivity parameters to be well identified. To date, it is possible to compile data for four years at the most. Furthermore, the catch rate data has to be obtained from a wide range of fishing efforts, so that there is enough contrast to properly estimate the productivity parameters through a procedure that would not assume equilibrium conditions. Methods that assume equilibrium to estimate productivity have to be discouraged for the demersal fishery, because the main species in the fishery are relatively long-lived, which means that as the fishery evolves and fishing effort increases, it takes a relatively long time before the catch rates reach equilibrium.
The application of the second type of models mentioned (yield-per-recruit) also present difficulties. First, they are based on the rather restrictive assumption that the recruitment of new fish to the population is constant over the range of fishing efforts analyzed or expected. Secondly, it requires a more extensive collection of basic information. For example, studies on growth rates are required but yet not available. Estimation of fishing mortality rates can be carried out, as some length-frequency distributions are available, but only if the data for all years are combined. This would be equivalent to assuming that the population is in equilibrium with the current fishing mortality rate and no changes occurred in the probabilities of capture by size. The latter is ostly aa function of the gear characteristics but variation from other sources can also occur. For example, the differences in length frequency distributions between Chilaw and Negombo for the same species and the same gear are unexpected and could point to a spatial dependence in the average size of the fish (bigger fish in Negombo), although the two fisheries are relatively close to each other.
Thirdly the fishery has been changing and expanding over time, making more difficult to collect information which might be safely assumed to represent equilibrium conditions. This is of concern because yield-per-recruit assessments actually assume equilibrium conditions. Of particular concern are changes in the gear deployed which might affect the equilibrium size-distribution in the catch. For example, changes in hook size will affect the selectivity of the handline gear. These problems can be solved by further stratifying the gear-related data, or by modeling the gear efficiency (standardizing catch rates to a single gear configuration). In general, for long-lived species such as the ones prevailing in the demersal fishery of Sri Lanka, the time to reach a new equilibrium could be of several years.
The problem of assessing future yields for the average fishermen participating in the demersal fishery is compounded by the fact that it is a multi-species fishery. The complications arise because there might interactions between the main species that could modify the results expected from single-species analyses. To cope with this problem, various solutions have been proposed. One of them, fitting a production model to data pooled over species, has been mentioned above. Another alternative is the application of ecosystem models that model the dynamics of the major species involved not only as a function of population size and fishing mortality but as a function of the interactions with other species as well. Unfortunately, while these models represent a theoretical improvement relative to the traditional single-species models, the reality imposed by the scarcity of data to estimate the interactions (typically, predation rates for the major species) limits their application. Usually, most of these additional parameters are fixed at somewhat arbitrary values so that the theoretical advantages disappear at the time of implementation.
The current data situation suggests that it would be better to focus the study to of the main species of the family Lethrinidae in the Negombo fishery. This study can be completed as soon as the information from the four years of sampling is incorporated in the databases. The main limiting factor in all cases is the availability of reliable data on length-frequency distributions of the species involved.
A reasonable way of coping with the existing uncertainties is to incorporate these uncertainties into the analyses. This is done by performing a risk analysis in which the future yields are predicted a large number of times, allowing the main parameters to vary randomly, within a reasonable range, between replicated analyses. The results provide a distribution of plausible scenarios regarding future yields and their associated probabilities. Therefore, this type of analysis allows managers to evaluate the risks associated with different policies and implement a precautionary approach or a more aggressive policy to the management of the resource.
Given the level of uncertainties surrounding any technique, the consultant recommends that a risk analysis be carried out in conjunction with the bio-economic modeling, irrespective of the techniques adopted for the stock assessment.
The economic data relevant to has also been collected on an opportunistic basis by the sampling teams, and that means that there is incomplete coverage of most ports. The typical interview carried out with the fishermen included questions regarding the cost of fuel, ice, and bait used for a particular fishing operation. Unfortunately, the uneven level of cooperation of the fishermen interviewed determined that the data are incomplete in most cases. Furthermore, some data relevant to the bio-economic model (such as level of investment, costs of maintenance of vessels and gear) were not being routinely acquired during NARA sampling. This is to be expected, as the sampling was designed to collect the information more closely related to the specific fishing operation.
Fortunately, also as part of the Project, Ms. S. Andrahennedi, fishery economist associated to the Department of Fisheries and Aquatic Resources (DFAR) is carrying out a questionnaire-based survey of important economic factors that might provide the necessary information. The results from this survey should provide a complement for the information collected by NARA. The consultant strongly recommends that, as the results of this survey become available, the data be entered into a computer database so that they can be more easily reported and more easily used in support of further bio-economic analyses. To achieve this convergence, there is a need to improve the coordination of the activities of both the demersal groups working at NARA and Ms. Andrahennedi at DFAR. In summary, both activities would benefit from better communication, a close cooperation and a unified database system.
The following are the final recommendations:
1) Work on the final bio-economic advice to be provided to the management authorities has to be based on the full amount of information available.
2) Additional data entry facilities in the form of a dedicated computer and the temporary additional manpower have to be provided to NARA to facilitate the elimination of the data backlog.
3) Close collaboration between the staff working on the economic survey and the demersal group is necessary to reduce the duplication of efforts.
4) Given the uncertainties that most likely will affect the biological assessment of the resources, the final analysis through the bio-economic model has to be complemented by a risk analysis.
Finally, the consultant would like to appreciate the efforts and dedication of the demersal group at NARA to accommodate his requests, as well as the advice and guidance provided by Dr. Michael Sanders. Also important were the support provided by the National Programme Coordinator, Mr. H.V.C.Fernando, the FAO Representative, Mr. G. Bernard and the UNDP officer responsible for the Project, Dr. Fredrick Abeyratne.
The Terms of Reference stated that under the general direction and supervision of the Chief, Operations Group, RAPR to whom the staff member would be directly responsible, the guidance of the designated technical and operations officers and with frequent referral to the national authorities directly concerned in the Government Executing Agency, in particular the project National Co-ordinator and in collaboration with the Director, MBRD, the international consultant, Stock Assessment Specialist, would assist the relevant research staff at NARA in establishing a computer database and undertaking a bio-economic assessment of the demersal fishery based on the existing data, through the conduct of the following duties:
Develop suitable mathematical models of the multigear multispecies demersal fishery, from which the future bio-economic performance of the fishery can be determined.
Based on the findings from the assessment, to advice on the future management and development of the demersal fishery.
1) Together with the Research Officer working on demersal fisheries prepare a report, describing the findings and the management and development implications arising from the bio-economic assessment.
On- the-job training of the Research Officer in the methodology used in bio-economic assessment so that the officer would be able to carry out such analysis in the future.
During the course of his stay, the consultant met the following people in relation to the activities required:
Ms. S. Andrahennedi, Fishery Economist, DFAR
Mr. David Ardill, Chief FIDI, FAO
Dr Fredrick Abeyratne, National Programme Officer, UNDP
Mr. G. Bernard, FAO Representative for Sri Lanka and the Maldives.
Mr. H.V.C. Fernando, National Programme Coordinator.
Ms Rekkha Maldeniya, Research Officer, NARA.
Dr. Michael Sanders, Consultant.
The database for the demersal fishery, DDB, was set up in Microsoft Access 97. The DDB is composed of a number of interrelated tables, some containing the actual data and other containing a list and description of the codes utilised. The number of tables was designed with the idea to normalise as much as possible the design of the DDB, reducing the possible redundancies and repetitions of the data.
In Table 1 an overview of the relationships between the tables is shown, following the format provided by the Relationships View in Access. Each rectangle in the figure represents a table and contains the fields holding the data. The lines connecting fields in different tables indicate the type of relationship between the tables. For example, a "1" joined to a "8" indicates a one-to-many relationship between tables, so that one record in one table can be connected to one or more records in the other table.
The main table is Landing-sites, containing information a site, date, boat type and gear type. Includes the number of vessels operated and sampled, so future correction factors can be calculated to estimate total production for the site. Also in this table data for sites not sampled can be entered if available from independent sampling schemes, for the purpose of estimating total production for the region. The DDB enforces referential integrity, so no entries can be made to other tables in the DDB unless there is a record for the site-date-boat-gear combination in Landing-sites.
The table Boat-details contains information about the fishing operation of one particular boat during the day sampled. It includes a text field called Comments to incorporate any marginal notes taken by the samplers.
The table Catch-details contains information on a species-basket combination. This feature was necessary due to the way that prices are recorded. In some instances, fish are sorted by size, placed in different baskets and receive a different per unit weight according to the size. To preserve that information, it was agreed to adopt the compromise solution of indexing the table by both species and basket.
This compromise had consequences for the remaining two tables. The problem is that, in some cases, baskets can contain a mixture of species. In order to preserve the information on the species composition and avoid duplication of price-per-basket data, an additional table Price-per-basket was added, where the price obtained for each basket is listed uniquely. A similar problem occurs with the Length-details since the length-frequency data can refer to more than one basket. For these reasons, although both tables are related to the Catch-details table, the relationship is undetermined and referential integrity is not enforced. This is a weakness in the design that could not be circumvented at the time. A further point worth mentioning about the Length-details table is that a field called Sequence (an Autonumber field) was added to the primary key to make records unique.
The code tables (see Tables 2-6) were developed jointly with NARA staff. A code table that deserves further explanation is the one listing species names (see Table ??). Initially, to preserve future compatibility with ARTFISH, three-letter alphanumeric codes were proposed. However, it soon became obvious that the three-letter codes could not accommodate the degree of detail provided by the identification done during the sampling. Therefore, five-letter codes were devised. The principle used in the definition of the codes is that the first three letters represents the genus and the last two letters represents the species. Families are identified by the postfix -DE, and known genus with unknown species by the postfix -SP. In the future, it might be necessary to establish a correspondence table with these codes and the three-letter codes used in ARTFISH. In addition, it will be necessary to request that new codes be incorporated in the ARTFISH tables.
In addition to the tables, forms were designed to facilitate the data entry work. Basically there are four forms:
Entry of Landing Sites. The initial form to be used.
Entry of Boat and Catch Information. To simplify the data entry, this is actually a container form, with two sub-forms: Boat-details subform and Catch-details subform.
Entry of Length Frequency. Structured also as a form with component subforms to display simultaneously the corresponding information from the catch table. This added information reduces the chances that a record is entered for which there is no catch information.
Entry of Price per Basket. This form is structured in the same way as the length-frequency form for identical reasons.
The inclusion of validation rules was only done for the most important fields due to a lack of time. This is an area that needs to be improved to reduce chances of typing errors.
Some basic reports were provided and further work is needed in this area. One of the interests of the NARA group is to use the information compiled in the databases to obtain production reports for different sites, regions and, eventually, the totality of the demersal fishery. This type of reporting was not completed, although all the constituent elements are in place.
The existing reports include:
Boat-details. This report summarizes some of the economic variables available by fishing trip.
Catches-by-species-month. To summarize total catches in weight and number by species.
Length-frequency by species/month.
Table 2 . Codes for gear/fishing strategy types.
Gear code |
Gear description |
| BGNL | Large-mesh bottom set gillnet > 8" |
| BGNS | Small-mesh bottom set gillnet 2"-7" |
| BSLL | Bottom set longline for demersal fish. |
| BSTN | Bottom set trammel net 1.5"-4". |
| DBLL | Deepwater bottom set longline for dogfish. |
| DWHL | Deep-water hadline > 50m. |
| HLGN | Handline/gillnet combination. |
| HLIN | Undetermined handline |
| SPFI | Spear fishing. |
| SWHL | Shallow-water handline < 50m. |
| TRLL | Troll line |
| UNKW | Unknown gear utilised. |
Table 3. Codes for boat types.
Boat code |
Boat type |
| FRP | |
| TR5 | Mechanised traditional craft- Single day boats - assumed to be fishing in COASTAL WATERS |
| TR6 | Non-mechanised traditional oru/ crafts - Hand paddle. |
| TR7 | Non-mechanised traditional oru /crafts - Sailing. |
| UN1 | 5.5 - 7.2 m (17'-21') FRP dinghy. Outboard engine - 8-25 HP (usually 15-25 HP) |
| UN2A | 8.8 - 9.8 m (28'-34') displacement hull. FRP or wooden. Inboard engine (single) - 40 HP No icebox or insulated fish hold only - no gear hauler, nav or acoustic equipment. Single day boats - assumed to be fishing in COASTAL WATERS |
| UN2B | 8.8 - 9.8 m (28'-34') displacement hull. FRP or wooden. Inboard engine (single) - 40 HP Insulated fish hold - no gear hauler, may have GPS/sounder/fish finder Multi-day boats - assumed to be fishing in OFFSHORE WATERS |
| UN3A | 9.8 - 12.2 m (34'-40') displacement hull. FRP or wooden. Inboard engine (single) - 60 HP - [includes Abu Dhabi vessels] Insulated fish hold and may have gear hauler/GPS/sounder/fish finder Multi-day boats - assumed to be fishing in OFFSHORE WATERS |
| UN3B | 12.2m - (40'- ) displacement hull. FRP or wooden. Inboard engine (single) - 60+ HP Insulated fish hold and may have freezer facilities. Gear hauler/ GPS/ sounder/ fish finder Multi-day boats - assumed to be fishing in OFFSHORE WATERS |
| UN4 | Reserved for vessel category eg. 15.2 - 18.3 m (50'-60') |
| UN5 | Reserved for vessel category eg. 18.3m+ (60'+ ) |
Table 4. Codes for species or other taxonomic categories.
| Species-code | Scientific-name |
| ACTDE | ACANTHURIDAE |
| ACTSP | Acanthuridae sp |
| ALECI | Alecits ciliaris |
| ALEIN | Alectis indicus |
| APHRU | Aphareus rutilens |
| APHSP | Aphareus sp. |
| APRVI | Aprion virescens |
| ARIID | ARIIDAE |
| ARIYA | *Ariyalaya |
| ATHCS | Acanthocybium solandri |
| ATUMA | Atule mate |
| BALDE | BALISTIDAE |
| BALSP | Balistidae SP. |
| BELDE | BELONIDAE |
| BELSP | Belonidae SP |
| CARDE | CARANGIDAE |
| CARUI | Carangoides uii |
| CEADE | CEASIONIDAE |
| CEASP | Ceasio sp. |
| CENDE | CENTROPOMIDAE |
| CHADE | CHANIDAE |
| CHEDE | CHEATODONTIDEAE |
| CHESP | Cheatodon sp |
| CLUDE | CLUPEIDAE |
| CORDE | CORYPHAENIDAE |
| CORSP | Coryphaena sp. |
| CRXCA | Caranx caeruleopinnatus |
| CRXFU | Caranx fulvoguttatus |
| CRXGY | Caranx gymnostethus |
| CRXME | Caranx melampygus |
| CRXPR | Caranx praeustus |
| CRXSA | Caranx ingobilies |
| CRXSE | Caranx sem |
| CRXSO | Caranx sonnerati |
| CRXSX | Caranx sexfaciatuis |
| CUTTL | *Cuttlefishs |
| DECSP | Decapterus sp. |
| DERDE | DERIPANIDAE |
| DERSP | Deripanidae SP |
| ECHNA | Epinepholus nauerates |
| ELABI | Elagatis bipinnulatus |
| ELODE | ELOPIDAE |
| EPHDE | EPHIPPIDAE |
| EPIMA | Epinepholus malabarias |
| Speciess-code | Scientific-name |
| EPISP | Epinenethelus sp |
| EPIUN | Epinepholus undulosus |
| FISDE | FISTULARIIDAE |
| FISSP | Fistularia sp |
| FLATF | *Flat fish |
| FRITU | Auxis thazard |
| GALKA | *Gal katilla |
| GERDE | GERRANIDAE |
| GERSP | Gerres sp |
| GONSC | Gonathodon speciosus |
| GYMSP | Gymnocarnius sp. |
| HEADE | HEAMULIDAE |
| HEASP | Heamulidae sp |
| HEMDE | HEMIRAMPHIDAE |
| HEMSP | Hemiramphus sp. |
| HOLDE | HOLOCENTRIDAE |
| HOLSP | Holocentridae SP. |
| ISTDE | ISTIOPHORIDAE |
| ISTPL | Istiophorus platypterus |
| KALWA | *Kalawa |
| KAWKA | Euthynnus afinnis |
| LABDE | LABRIDAE |
| LABSP | Labridae sp |
| LACDE | LACTRARIIDAE |
| LATSP | Lates sp. |
| LEIDE | LEIOGNATHIDAE |
| LOBDE | LOBOTIDAE |
| LOBST | Lobster |
| LOLDE | LOLIGINIDAE |
| LOLSP | Loliginidae Sp. |
| LTHCO | Lethrinus conchylatus |
| LTHDE | LETHRINIDAE |
| LTHEL | Lethrinus elongatus |
| LTHHA | Lethrinus hark |
| LTHLJ | Lethrinus letjan |
| LTHMA | Lethrinus mahsen |
| LTHMI | Lethrinus microdon |
| LTHNE | Lethrinus nebulosis |
| LTHOB | Lethrinus obsalatus |
| LTHOR | Lethrinus ornatus |
| LTHRU | Lethrinus rubreoperculatus |
| LTHSP | Lethrinidae sp |
| LUTAR | Lutjanus argentimaculatus |
| LUTBO | Lutjanus bohar |
| Species-code | Scientific-name |
| LUTDC | Lutjanus decustatus |
| LUTDE | LUTJANIDAE |
| LUTFF | Lutjanus fulviflama |
| LUTFU | Lutjanus fulvus |
| LUTGI | Lutjanus gibbus |
| LUTJO | Lutjanus johni |
| LUTKA | Lutjanus kasmira |
| LUTLM | Lutjanus lemniscatus |
| LUTLT | Lutjanus lutjanus |
| LUTLU | Lutjanus lunulatus |
| LUTMD | Lutjanus madras |
| LUTML | Lutjanus malabaricus |
| LUTQU | Lutjanus qunqueolineatus |
| LUTRI | Lutjanus rivulatus |
| LUTRU | Lutjanus ruselli |
| LUTSE | Lutjanus sebea |
| LUTVI | Lutjanus vittus |
| MEGCO | Megalaspis cordyla |
| MOADE | MONACATHIDAE |
| MONDE | MONODACTYLIDAE |
| MULDE | MULLIDAE |
| MULSP | Mulllidae SP. |
| NEMDE | NEMIPTERIDAE |
| NEMSP | Nemipterus sp. |
| OCTDE | OCTOPODIDAE |
| OCTSP | Octopus sp |
| OTHCG | Other carangids |
| OTHER | Other |
| PARIN | Penaeus indicus |
| PARPL | Parascolopsis pleuroethtitum |
| PARSP | Parascolopsis sp. |
| PENDE | PENAIDAE |
| PERDE | PERICANTHIDAE |
| PERSP | Pericanthus sp. |
| PINPI | Pinjalo pinjalo |
| PINSP | Pinjalo sp. |
| PLCSP | Plectorhinchus sp. |
| POASP | Pomadasys sp. |
| POAUR | Pomadasys urgenteus. |
| POLDE | POLYNEMIDAE |
| POMDE | POMACANTHIDAE |
| POMSP | Pomacanthus sp |
| PRIMU | Pritipomides multidens |
| PRISP | Pritipomides sp |
| PRITY | Pritipomides typus |
| PRIZO | Pritipomides zonatus |
| RACDE | RACHICENTRIDAE |
| RAHCA | Rachicentrus canadum |
| RASSP | Rastrelleger Sp. |
| SCADE | SCARIDAE |
| SCASP | Scaridae Sp. |
| SCMCR | Scomberomorus cromoson |
| SCMDE | SCOMBRIDAE |
| SCMSP | Scomberoides sp. |
| SCOBI | Scolopsis bimaculatus |
| SCOGH | Scolopsis ghanum |
| SCOVO | Scolopsis vosmeri |
| SEACC | *seacucumber |
| SEACR | Sea crabs |
| SELLE | Selaroides leptolepis |
| SEPDE | SEPIOLIDAE |
| SEPSP | Sepia Sp. |
| SERDE | SERRANIDAE |
| SERIS | *Seri |
| SERRI | Seriola rivoliana |
| SERSP | Serranidae sp |
| SHARK | Shark |
| SIGDE | SIGANIDAE |
| SIGSP | Siganus sp |
| SKATE | SKATES |
| SKJTU | Katsuwonus pelamis |
| SPADE | SPARIDAE |
| SPASP | Sparidae sp. |
| SPHDE | SPHYRAENIDAE |
| SPHSP | Sphyraenidae SP. |
| SQUID | *Squid |
| STRDE | STROMATEIDAE |
| TERDE | TERAPONIDAE |
| TERSP | Terapon sp |
| THNKT | *Thunkatuwa |
| TRASP | Trachinotus Sp. |
| ULUME | Ulua mentalis |
| URALA | *urala |
| VARLO | Variola louti |
| YFTUN | Thunnus albacares |
Table 5. Codes for landing sites.
| Site code | Site name | Statistical zone |
| BA | Batticoloa | East |
| BE | Beruwala | Southwest |
| CW | Chilaw | Northwest |
| DO | Dondra | South |
| GA | Galle | Southwest |
| GD | Gandara | South |
| HA | Hambantota | Southeast |
| KI | Kalmunai | East |
| KM | Kalmetiya | Southeast |
| KO | Kottegoda | South |
| KR | Kirinda | Southeast |
| KU | Kudawela | Southeast |
| KY | Kandakuliya | Northwest |
| MI | Mirissa | South |
| MK | Malikaikadu | East |
| MT | Matara | South |
| MU | Colombo (Mutwal) | West |
| NE | Negombo | West |
| TA | Tangalle | Southeast |
| TR | Trincomalee | Northeast |
| WE | Weligama | South |
Table 6. Codes for bait types.
Species code |
Common name |
| ART | Artificial bait |
| CUT | Cuttlefish |
| DEC | Decapterus |
| HER | Heriing |
| NOB | Without bait |
| OTH | Other Fish |
| PRW | Prawn |
| SAR | Sardines |
| SHK | Sharks |
| SQD | Squid |
| TUN | Tuna fish. |
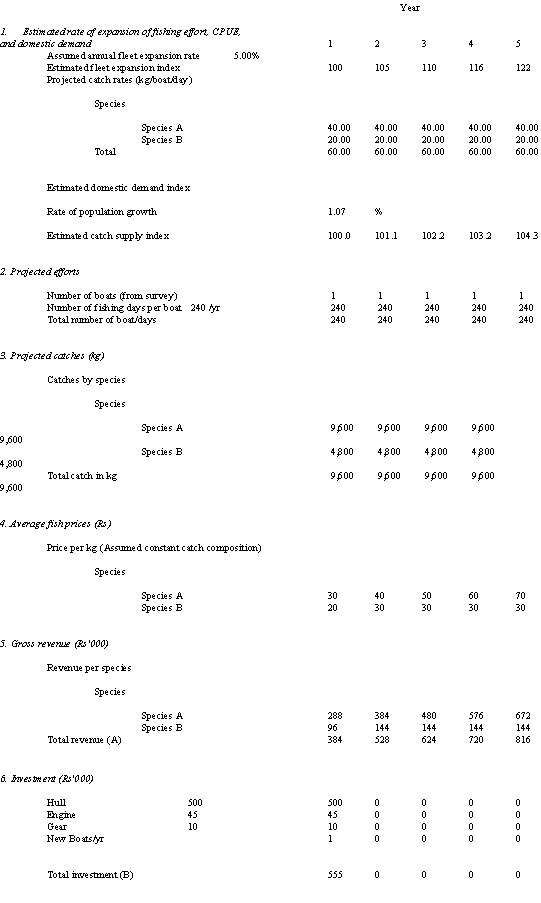
Given the amount of time taken by the database design activities and the reduced amount of data available, the bio-economic model was defined and implemented in a spreadsheet program with the understanding that, as data becomes more readily available, a complete analysis of the data will be carried out. The main missing part due to the lack of data is the biological assessment of the status of the resource.
The model shown in Table 7 is based on an arbitrary projection of future yields. These can be obtained on a species-by-species basis, and the future yields added, or by fitting a production model to data for a group of species. These options will have to be explored once the data entry is finalized. For the sake of simplicity, the template model is based on two species and assumes that catch rates remain stable during the five years (this is the area where the results of the yield analysis have to be introduced). Alternatively, plausible scenarios can be explored by assuming different trends in catch rates.
The example is set up for a hypothetical fishery patterned after the handline fishery operating in the Negombo lagoon. Thus far, the model assumes that prices remain constant over the time horizon of the analysis (five years). Using an index of the evolution of the demand and assuming an inverse relationship between average price and the supply/demand ratio, it is possible to relax this assumption.
The average price is set by species. In some species, price can vary with the average size, something that can be easily implemented by subdividing the species in the appropriate number of commercial categories. The gross revenue to the fishermen is then obtained by multiplying the average price per species and the catch per species, then adding up the results.
Investment is effected every time a new boat enters the fishery. No license costs or any other entry fees are assessed but incorporating these additional costs in the calculation sheet is straightforward.
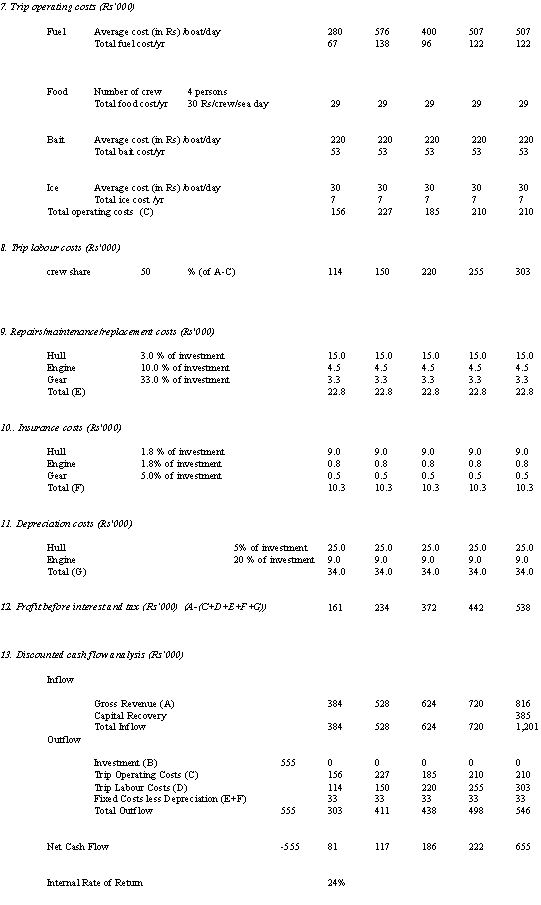
Trip operating costs are divided into different categories including cost of fuel, bait, ice and meal for the crew members. This information is collected from the fishermen during the regular interviews by NARA samplers. Costs of fuel and bait, in particular, deserve further consideration in the future, as they might be correlated to the status of the stocks. Declines in local stocks might force fishermen to travel further in search for profitable grounds, increasing the related costs. The cost of bait might increase as the bait species become under more pressure.
The costs associated with repairs and maintenance of the vessels and gear are included only as indicative. NARA samplers during their interviews do not collect this information, but it will be available from the survey carried out by the Fisheries Economist. The values indicated in the spreadsheet will have then to be substituted by the numbers resulting from the analysis of the survey. The same can be said of some of the depreciation and insurance costs.
At the end of the spreadsheet, the net cash flow over the period is shown together with the internal rate of return, indicating the return on the initial investment. The model does not include the financial costs associated with interests paid on the amount of money, if any was borrowed at the moment of initial investment or incurred as taxes or licensing fees. Scenarios that include ranges for these management variables can very easily be included in a final analysis, as managers indicate the possible policies that they would like to consider.
In an earlier section it was recommended that a full risk analysis be carried out in association with these models given the amount of uncertainty associated with the input variables and some functional relationship (like the future evolution of prices). This can be done within the framework of the spreadsheet programme, but it will require some additional programming.
By assuming that some of the variables follow a probability distribution function, rather than assuming them fixed, the results of the analysis represent a distribution of possible outcomes or economic performance over the time horizon for the analysis. For example, as a way to assessing the risk associated with an investment, we can look at the proportion of projected outcomes that predict a negative return and compare it with the median projected return, for example as a median/variance ratio trade-off.
As it is set right now, the model allows for the assessment of the performance of the fleet as a whole, or the performance of an individual fishermen over the established period of time. To achieve the latter, the expansion index of the fleet has to be set up to zero, and the number of boats to one. In this way, we can compare the expected economic performance of an average fisherman using different gear combinations.
Table 7. Structure of the bio-economic model.
Fishery : Negombo Lagoon
Gear : Handline