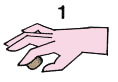
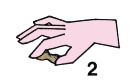
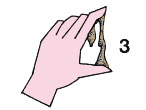
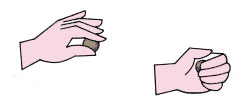
8. SOIL CONSISTENCY8.0 Definition of soil consistencySoil consistency is the strength with which soil materials are held together or the resistance of soils to deformation and rupture. Soil consistency is measured for wet, moist and dry soil samples. For wet soils, it is expressed as both stickiness and plasticity, as defined below. Soil consistency may be estimated in the field using simple tests or may be measured more accurately in the laboratory. Note: in each case, indications will be obtained concerning the relative value of soil for fish-pond construction, particularly when the wet-soil consistency is determined. 8.1 Determination of wet-soil consistencyTesting is done when the soil is saturated with water, as, for example, immediately after a good rainfall. First, determine stickiness, that is, the ability of soil materials to adhere to other objects. Then, determine plasticity, that is, the ability of soil materials to change shape, but not volume, continuously under the influence of a constant pressure and to retain the impressed shape when the pressure is removed. Field test for stickiness of wet soilPress a small amount of wet soil between your thumb and forefinger to see if it will stick to your fingers. Then slowly open your fingers. Rate the stickiness as follows:
8.4 Determination of soil consistency using the Atterberg LimitsAs can be seen from the various wet, moist and dry soil tests in Sections 8.1 to 8.3, the consistency of a soil sample changes with the amount of water present. Such changes in soil consistency may be accurately measured in the laboratory following standard procedures which determine the Atterberg Limits. These limits may then be used for judging the suitability of the soil, e.g., for the construction of small earth-dams and pond dikes. You should become familiar with the terminology related to this process, as well as with its general significance, the better to understand and discuss fish-pond design and construction with specialized technicians. An Atterberg Limit corresponds to the moisture content at which a soil sample changes from one consistency to another. Two of the Atterberg Limits are of particular interest for aquaculture, the liquid limit and the plastic limit, which are defined from three soil consistencies:
The liquid limit (LL)The percentage moisture content at which a soil changes with decreasing wetness from the liquid to the plastic consistency or with increasing wetness from the plastic to the liquid consistency. The plastic limit (PL)The percentage moisture content at which a soil changes with decreasing wetness from the plastic to the semi- solid consistency or with increasing wetness from the semi-solid to the plastic consistency. The plastic limit is the lower limit of the plastic state. A small increase in moisture above the plastic limit will destroy the cohesion* of the soil. Note: these limits may be easily and cheaply determined in the laboratory, using disturbed or undisturbed samples. They provide very useful information for classifying soils (see Chapter 11). In Tables 12 and 13, examples of Atterberg Limits are given. Both the liquid and plastic limits depend upon the amount and type of clay present in the soil:
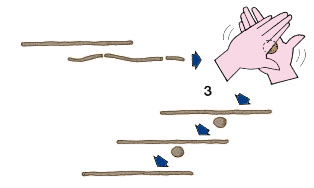
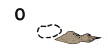
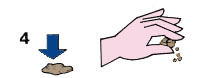
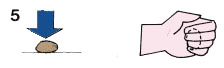
Some critical values of the Atterberg Limits for aquacultureFor constructing a pond dike without a clay core*, the liquid limit of the soil material should be equal to 35 percent for best compaction*results. For constructing the impervious clay core* of a pond dike, you should use soil material with an LL greater than 60 percent and a PLgreater than 20 percent. Field determination of the plastic limit - the
thread method
|
||||||||||||||||||||||||||||||||||||||||||||||||||||||||||||||||||||||||||||||||||||||||||||||||||||||||||||||||||||||||||||||||||||||||||||||||||||||||||||||||||||||||||||||||||||||||||||||||||||||||||||||||||||||||||||||||||||||||||||||||||||||||||||||||||||||||||||||||||||||||||||||||||||||||||||||||||||||||||||||||||||||||||||||||||||||||||||||||||||||||||||||||||||||||||||||||||||||||||||||||||||||||||||||||||||||||||||||||||||||||||||||


 |
 |
|
 |
8.5 Calculation of the plasticity index and its significance
On the basis of the liquid limit and the plastic limit, the plasticity index (PI) can be defined as the numerical difference between them:
The plasticity index is expressed in percent of the dry weight of the soil sample. It shows the size of the range of the moisture contents at which the soil remains plastic. In general, the plasticity index depends only on the amount of clay present. It indicates the fineness of the soil and its capacity to change shape without altering its volume. A high PI indicates an excess of clay or colloids in the soil. Its value is zero whenever the PL is greater or equal to the LL.
The plasticity index also gives a good indication of compressibility (see Section 10.3). The greater the PI, the greater the soil compressibility. Examples of plasticity index values are given below in Tables 12 and 13.
Some critical values of the plasticity index for aquaculture
To construct a pond dike without a clay core*, the plasticity index of the soil material should have a value between 8 and 20 percent. For best compaction, the PI should be as close to 16 percent as possible (see Section 10.3).
To construct the impermeable clay core* of a pond dike, you should use soil material with a plasticity index greater than 30 percent.
TABLE 12
Selected results of mechanical soil analyses (analyses of disturbed soil samples collected from open pits)1
1 Soil survey for the construction
of the Soraon Pati Hatchery (Uttar Pradesh, India).
Comments: |
||||||||||||||||||||||||||||||||||||||||||||||||||||||||||||||||||||||||||||||||||||||||||||||||||||||||||||||||||||||||||||||||||||||||||||||||||||||||||||||||||||||||||||||||||
|
TABLE 13
Selected results of mechanical soil analyses (analyses of disturbed soil samples collected from auger bores)1
1 Soil survey for a fish-farm site
(Majargahi Gaura, India). Comments: |
||||||||||||||||||||||||||||||||||||||||||||||||||||||||||||||||||||||||||||||||||||||||||||||||||||||||||||||||||||||||||||||||||||||||||||||||||||||||||||||||||||||||||||||||||||||||||||||||||||||||||||||||||||||||||||
8.6 The plasticity chart for fine-grained soils
Many properties of clays and silts (the cohesive soils) such as their compressibility* (reaction to the shaking test and consistency near the plastic limit) can be correlated with the liquid limit and the plasticity index. This correlation has been expressed in Casagrande's plasticity chart for fine-grained soils. It is based on the following observations:
- As the liquid limit of soils increases, the plasticity and compressibility of soils also increase;
- The values LL = 30 percent and LL = 50 percent differentiate between the various degrees of plasticity of inorganic soils;
- At equal LL values, the dry strength of inorganic soils increases generally with an increasing plasticity index.
The plasticity chart for fine-grained soils (see Table 14) is divided into six sections by the oblique line A drawn so that the PI = 0.73 (LL - 20) and two vertical lines drawn at LL = 30 percent and LL = 50 percent.
Each section of the chart characterizes a group of soils with well-defined mechanical characteristics. The three sections above line A are inorganic clays of low, medium or high plasticity. The three sections below line A are inorganic silts of varying compressibility, organic silts and organic clays. These form the basis of a useful soil classification system (see Chapter 11).
Note: soils with a plasticity index lower than 10 percent and a liquid limit lower than 20 percent are cohesionless soils. These appear in a separate section of the plasticity chart and the above considerations do not apply.
