
| World Fish Market at a glance | |||||||||
|---|---|---|---|---|---|---|---|---|---|
| 2020 | 2021 estim. | 2022 f'cast | Change: 2022 over 2021 | ||||||
| million tonnes (live Weight) |
% | ||||||||
| World balance1 | |||||||||
| Production | 177.8 | 182.0 | 184.1 | 1.2 | |||||
| Capture fisheries | 90.3 | 92.3 | 92.1 | -0.2 | |||||
| Aquaculture | 87.5 | 89.7 | 92.0 | 2.6 | |||||
| Trade value (exports USD billion) |
150.9 | 174.8 | 193.5 | 10.7 | |||||
| Trade volume (live weight) |
64.3 | 68.3 | 68.9 | 0.8 | |||||
| Total utilization | 177.8 | 182.0 | 184.1 | 1.2 | |||||
| Food | 157.4 | 161.1 | 163.7 | 1.6 | |||||
| Feed | 16.4 | 16.9 | 16.4 | -2.8 | |||||
| Other uses | 4.0 | 4.0 | 4.0 | 1.1 | |||||
| Supply and demand indicators | |||||||||
| Per caput food compsumption: | |||||||||
| Food fish (kg/yr) | 20.1 | 20.4 | 20.5 | 0.8 | |||||
| From capture fisheries (kg/year) |
8.9 | 9.0 | 9.0 | -0.5 | |||||
| From aquaculture (kg/year) |
11.2 | 11.3 | 11.5 | 1.8 | |||||
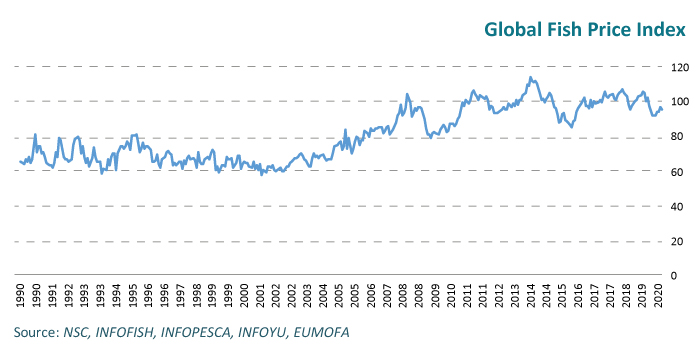
| FAO FISH PRICE INDEX 2 (2014-2016=100) |
2020 | 2021 | 2022 Jan-Sep. |
% Change Sep 2022 over Sep 2021 | |||||
| 94.9 | 101.7 | 124.0 | 22.8 | ||||||
Totals may not match due to rounding.